BNBCalc market data, November 2025 to October 2026 · Reviewed by Parker Place, CTO of BNBCalc.com · Updated November 3, 2026
Best Airbnb Markets in Tennessee (2026)
Ranked by gross yield
BNBCalc's market data for November 2025 to October 2026 ranks Memphis first in Tennessee by gross yield, followed by Chattanooga, Johnson City, Knoxville and Crossville. Average-tier listings in Memphis have median annual room-revenue potential of $24,615 and gross yield of 13.8%, with 46% occupancy at an average daily rate of $177. Memphis has 2,165 average active listings.
Top gross yield
13.8%
Memphis
Median gross yield
10.0%
12 markets with yield data
Median annual room potential
$32.6K
Median across market-level medians
Tracked markets
12
Statewide market coverage
Filter market rankings
Default rankings show all bedrooms at the average performance tier.
Bedroom count
Performance tier
Top 10 Tennessee Airbnb and Vrbo Markets
#1
Memphis
Average-tier listings in Memphis have median annual room-revenue potential of $24,615 and gross yield of 13.8%, with 46% occupancy at an average daily rate of $177.
Yield
13.8%
Revenue
$24.6K
Average active listings
2,165
#2
Chattanooga
Average-tier listings in Chattanooga have median annual room-revenue potential of $37,793 and gross yield of 11.8%, with 43% occupancy at an average daily rate of $228.
Yield
11.8%
Revenue
$37.8K
Average active listings
3,032
#3
Johnson City
Average-tier listings in Johnson City have median annual room-revenue potential of $25,710 and gross yield of 10.5%, with 40% occupancy at an average daily rate of $179.
Yield
10.5%
Revenue
$25.7K
Average active listings
1,123
#4
Knoxville
Average-tier listings in Knoxville have median annual room-revenue potential of $31,911 and gross yield of 10.4%, with 39% occupancy at an average daily rate of $245.
Yield
10.4%
Revenue
$31.9K
Average active listings
2,685
#5
Crossville
Average-tier listings in Crossville have median annual room-revenue potential of $27,242 and gross yield of 10.2%, with 35% occupancy at an average daily rate of $206.
Yield
10.2%
Revenue
$27.2K
Average active listings
1,626
#6
Jackson
Average-tier listings in Jackson have median annual room-revenue potential of $22,982 and gross yield of 10.1%, with 31% occupancy at an average daily rate of $187.
Yield
10.1%
Revenue
$23.0K
Average active listings
1,044
#7
Sevierville
Average-tier listings in Sevierville have median annual room-revenue potential of $47,477 and gross yield of 9.9%, with 46% occupancy at an average daily rate of $317.
Yield
9.9%
Revenue
$47.5K
Average active listings
25,859
#8
Nashville
Average-tier listings in Nashville have median annual room-revenue potential of $43,179 and gross yield of 9.6%, with 45% occupancy at an average daily rate of $308.
Yield
9.6%
Revenue
$43.2K
Average active listings
11,161
#9
Tracy City
Average-tier listings in Tracy City have median annual room-revenue potential of $33,291 and gross yield of 9.6%, with 34% occupancy at an average daily rate of $262.
Yield
9.6%
Revenue
$33.3K
Average active listings
1,077
#10
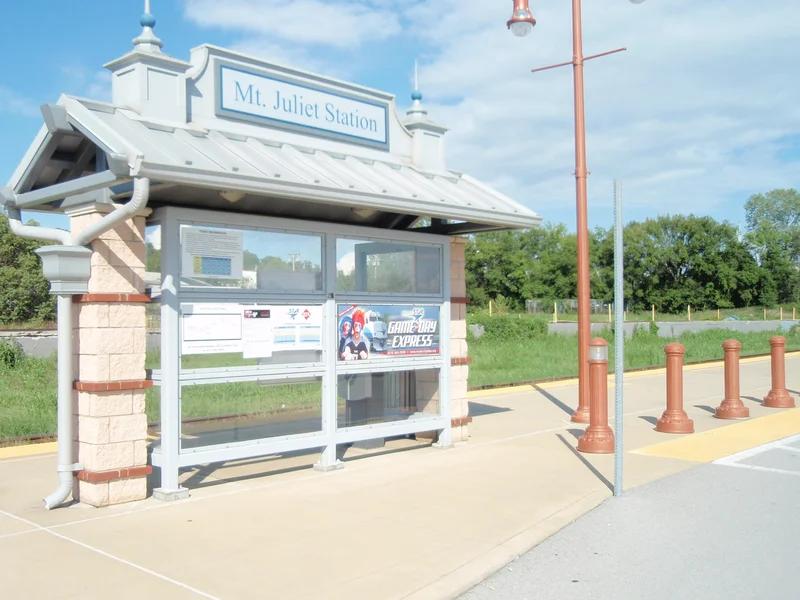
Mount Juliet
Average-tier listings in Mount Juliet have median annual room-revenue potential of $36,556 and gross yield of 8.6%, with 42% occupancy at an average daily rate of $237.
Yield
8.6%
Revenue
$36.6K
Average active listings
850
Best Tennessee Airbnb Markets by Goal
Gross yield isn't the only way to pick a market. These are the leaders on each measure among the Tennessee markets ranked by gross yield in BNBCalc market data, November 2025 to October 2026, for all bedrooms at the Average performance tier.
The biggest markets aren't always the best yields. Here's where Tennessee's largest short-term rental markets rank in BNBCalc market data, November 2025 to October 2026, for all bedrooms at the Average performance tier, and how their revenue potential and home values compare with the state medians.
Sevierville ranks #7 of 12 by gross yield (9.9%), below the Tennessee median of 10.0%. Its median annual room-revenue potential of $47,477 is above the state median of $32,601, and its median home value of $440,675 is above the state median of $342,531.
Nashville ranks #8 of 12 by gross yield (9.6%), below the Tennessee median of 10.0%. Its median annual room-revenue potential of $43,179 is above the state median of $32,601, and its median home value of $458,239 is above the state median of $342,531.
Chattanooga ranks #2 of 12 by gross yield (11.8%), above the Tennessee median of 10.0%. Its median annual room-revenue potential of $37,793 is above the state median of $32,601, and its median home value of $332,391 is below the state median of $342,531.
Knoxville ranks #4 of 12 by gross yield (10.4%), above the Tennessee median of 10.0%. Its median annual room-revenue potential of $31,911 is below the state median of $32,601, and its median home value of $303,290 is below the state median of $342,531.
All Tennessee Short-Term Rental Markets
Ranked by gross yield from BNBCalc market data, November 2025 to October 2026. Every market below links to its full BNBCalc market page, and markets without yield data are ranked by revenue potential.
Average active listings is the average number of Airbnb and Vrbo listings active in a market each month over the last 12 months. It counts every performance tier, so it doesn't change when you pick a tier, and it's the same figure you'll see on that market's page. It isn't broken out by bedroom count, so the column shows a dash when you filter by bedrooms.
Markets are ranked by the median of each eligible home’s annual room-revenue potential divided by its ZIP- and bedroom-matched home value. Cleaning income is excluded. Gross yield is before expenses, financing, taxes, and local rules.
Revenue uses the same matched homes as yield and excludes estimated cleaning income. Monthly potential is annual potential divided by 12.
ADR is the average booked nightly rate. It includes cleaning fees, which are bundled into the nightly rate, and excludes other guest fees.
Occupancy is adjusted occupancy of bookable nights, excluding host-blocked nights.
Gross yield is the median of individual home yields, rather than a ratio of the displayed medians.
For long-term rental context, compare statewide Section 8 Fair Market Rent data alongside short-term rental market performance.
Check Tennessee Short-Term Rental Rules Before You Buy
Gross yield doesn't account for local rules. Short-term rental rules can come from the state, the county and the city, so a market can rank well here and still restrict rentals at a specific address.
Tennessee charges 7% state sales tax plus local sales tax on stays under 90 days, and platforms usually collect it, along with local occupancy tax, on their bookings. If local rules change after your rental is running legally, the 2018 Short-Term Rental Unit Act generally keeps you under the old ones until the property changes hands, sits unrented for 30 straight months or racks up three violations. HOAs can still ban short-term rentals.
As of October 2026. Confirm the rules for the exact address with the county and city.
Frequently Asked Questions About Tennessee Airbnb and Vrbo Markets
BNBCalc's market data for November 2025 to October 2026 ranks Memphis as the best Tennessee market for Airbnb and Vrbo investors by gross yield, followed by Chattanooga, Johnson City, Knoxville and Crossville. Average-tier listings in Memphis have median annual room-revenue potential of $24,615 and gross yield of 13.8%, with 46% occupancy at an average daily rate of $177. Memphis has 2,165 average active listings.
BNBCalc's November 2025 to October 2026 data puts the median Tennessee market at $32,601 a year in room-revenue potential for an Average-tier listing, before expenses and not counting cleaning income. Memphis, the top market by gross yield, comes in at $24,615, and Sevierville is highest among ranked markets at $47,477. You can run any Tennessee address through the BNBCalc Calculator to see what that home could earn.
For an Average-tier listing, BNBCalc's November 2025 to October 2026 data ranks Memphis first for gross yield (13.8%), Sevierville first for revenue potential ($47,477) and Franklin first for occupancy (47% of bookable nights). If you want a lower purchase price without giving up yield, Memphis also has the lowest median home value among markets with an above-median yield ($183,488). BNBCalc Markets ranks US markets by gross yield and maps every Airbnb and Vrbo listing in each market, so you can compare these picks side by side.
BNBCalc's November 2025 to October 2026 data puts Sevierville highest among ranked Tennessee markets on median annual room-revenue potential, at $47,477. It ranks #7 by gross yield, with a median home value of $440,675.
Markets are ranked by the median of each eligible home’s annual room-revenue potential divided by its ZIP- and bedroom-matched home value. Cleaning income is excluded. Gross yield is before expenses, financing, taxes, and local rules.
Gross yield is usually better for market comparison because it accounts for both revenue potential and property value. Revenue alone can favor expensive markets where purchase prices may reduce investor returns.
Start with BNBCalc's Tennessee short-term rental regulations guide, then confirm the rules for the exact address with the county and city, since local rules can differ from the state's.
BNBCalc's state rankings show monthly room potential, which is a market's median annual room-revenue potential divided by 12. It uses the same price-matched homes as gross yield, leaves out cleaning income, and is before expenses like platform fees and property management.
ADR is the average nightly price that guests pay to book a short-term rental in a given market. It's calculated by dividing the total revenue by the number of booked nights. Higher ADR markets typically have premium properties or are in high-demand tourist destinations.