
Free instant analysis
Reveal Airbnb revenue for any address or city
Where can you see Airbnb occupancy rates, nightly rates and revenue for a city, and how do the big US markets compare? Well, BNBCalc Markets shows all three on each market's page. Across the 454 US markets with a full year of BNBCalc data, a typical listing's median occupancy over the 12 months to September 2026 was 38.4%, with a median nightly rate of $257 and median annual revenue of $41,059.
The spread is wide, though. Among 20 of the best-known US cities, BNBCalc's data has a typical listing earning anywhere from $33,627 in Houston to $88,507 in San Diego, and among the 100 US markets with the most active listings, Oahu's typical listing booked the highest share of its bookable nights, 57.8%.
I'll start with where to find a city's numbers and what you can see without a plan. Then I'll put 20 major cities side by side, rank the highest-occupancy markets with a size rule that keeps smaller markets from crowding the top, and explain how a market's typical listing differs from all of its listings.
Where Can You See Airbnb Occupancy Rates and Nightly Rates for a City?
The quickest place is BNBCalc Markets, since the Marketwide Stats tab on each market's page leads with a typical listing's annual revenue, occupancy rate and average daily rate (ADR) over the last 12 months, plus lead time, RevPAR and, for US markets, gross yield.
You don't even need an account for the headline numbers, since a market page still shows the annual revenue, lead time and RevPAR without a Markets plan, plus gross yield in US markets and, in most markets, the occupancy rate and nightly rate too. All of them describe the typical listing across every bedroom size. For example, when I opened Oahu's BNBCalc market page logged out on October 21, 2026, the cards read $81.5k a year, 58% occupancy, $333 a night and a 14.2% gross yield.
If you're on a Markets plan, you can switch the view from the typical listing to the low or high performance tier, or to all listings, and pick a bedroom count from studios to 4+. You'll also see revenue by bedroom count, the top ZIP codes by gross yield and what each listing on the map earned.
And if you'd like a whole state at a glance, BNBCalc's public market rankings list each US market's gross yield, ADR, occupancy and median annual room potential, state by state, with no account needed. Remember that room potential, what homes could earn if they were bookable all year with cleaning income left out, isn't the annual revenue a market page shows, so the two won't match.
Unless I say otherwise, every figure here comes from that same default view, the typical listing at BNBCalc's average performance tier across all bedroom sizes, so until the next monthly refresh you can check a market's revenue against its own page, and its occupancy, nightly rate and gross yield against either that page or BNBCalc's state rankings.
What Does a Typical US Airbnb Earn?
Across the 454 US markets with a full year of BNBCalc data, a typical listing earned a median of $41,059 over the 12 months to September 2026, booked 38.4% of its bookable nights and charged a median of $257 a night. Keep in mind that those are three separate medians, each taken across all 454 markets, so multiplying the nightly rate by occupancy won't get you back to the revenue figure.
Most markets sit close to that middle, too. The middle half of them ran between 34.1% and 42.4% occupancy, which is about four points either side of the median. At the edges, 26 of the 454 markets booked half or more of their bookable nights, while 38 booked fewer than three in ten.
Updated October 22, 2026: added these national figures, from the same October 6, 2026 BNBCalc data update as the rest of the page.
Airbnb Occupancy Rates, Nightly Rates and Revenue by City
For a sense of the spread, take 20 of the best-known US markets, sorted by what a typical listing earned over the 12 months to September 2026. If your city isn't one of them, BNBCalc Markets has the same figures for every US market it tracks.
| Market | Annual revenue | Occupancy | Nightly rate (ADR) | Gross yield |
|---|---|---|---|---|
| San Diego, CA | $88,507 | 54.6% | $363 | 7.2% |
| San Francisco, CA | $79,948 | 61.4% | $310 | 6.2% |
| Las Vegas, NV | $75,148 | 48.9% | $344 | 13.9% |
| New York City, NY | $74,428 | 51.3% | $390 | 7.5% |
| Boston, MA | $71,316 | 50.4% | $337 | 8.7% |
| Nashville, TN | $62,899 | 44.9% | $306 | 9.5% |
| Chicago, IL | $62,278 | 51.5% | $267 | 12.8% |
| Miami, FL | $60,720 | 52.4% | $276 | 10.0% |
| Los Angeles, CA | $58,404 | 51.4% | $267 | 6.5% |
| Phoenix, AZ | $55,972 | 49.2% | $274 | 9.4% |
| Seattle, WA | $54,927 | 50.2% | $251 | 7.1% |
| Denver, CO | $51,874 | 49.3% | $243 | 8.4% |
| Austin, TX | $51,522 | 45.6% | $265 | 9.3% |
| New Orleans, LA | $48,529 | 38.9% | $280 | 12.0% |
| Washington, DC | $47,465 | 47.8% | $238 | 7.9% |
| Orlando, FL | $40,686 | 49.9% | $202 | 11.1% |
| Dallas, TX | $40,529 | 43.4% | $224 | 11.1% |
| Philadelphia, PA | $37,224 | 46.6% | $188 | 9.6% |
| Atlanta, GA | $35,777 | 39.0% | $221 | 9.8% |
| Houston, TX | $33,627 | 33.7% | $233 | 10.3% |
Source: BNBCalc market pages (October 7, 2026 data update), typical listing at the average performance tier, all bedrooms: Annual revenue (actual), occupancy and ADR over the 12 months to September 2026, cleaning fees included, and gross yield as the card's Current potential.
Each row is one market's typical listing, so read down a column to compare the cities on one measure. When you do, you'll see how rarely BNBCalc's columns agree: San Diego led on revenue, San Francisco on occupancy at 61.4%, New York City on nightly rate at $390 and Las Vegas on gross yield at 13.9%, while Houston came last on both revenue and occupancy yet still sat sixth of the 20 on gross yield, at 10.3%.
Gross yield works differently from the other three columns, because BNBCalc builds it home by home. For each eligible home, it divides that home's annual room-revenue potential, cleaning income left out, by a home value matched to its ZIP code and bedroom count, and a market's yield is the median of those home yields, before expenses, financing, taxes and local rules. So you won't get a city's yield by dividing its revenue by a home price.
San Francisco's typical listing booked more of its nights than any other city's on the list, yet the market came last on gross yield, at 6.2%, because homes there cost so much next to what they could earn: BNBCalc's California page puts San Francisco's median home value at $1,090,153, the highest of the 20.
Unfortunately, a busy calendar doesn't tell you whether you can run a rental there at all.
New York City's Office of Special Enforcement says hosts can't rent out an entire apartment or home for fewer than 30 days, and that short-term rentals are only legal when the host lives in the same unit with the guests. San Francisco has a residency rule too, and its planning department's FAQ says you must be the permanent resident of the unit you rent, which means living there at least 275 nights in a calendar year.
So make sure to check a city's rules before you read anything into its numbers, and BNBCalc's regulation guides are a good place to start, city by city.
Which US Cities Have the Highest Airbnb Occupancy Rates?
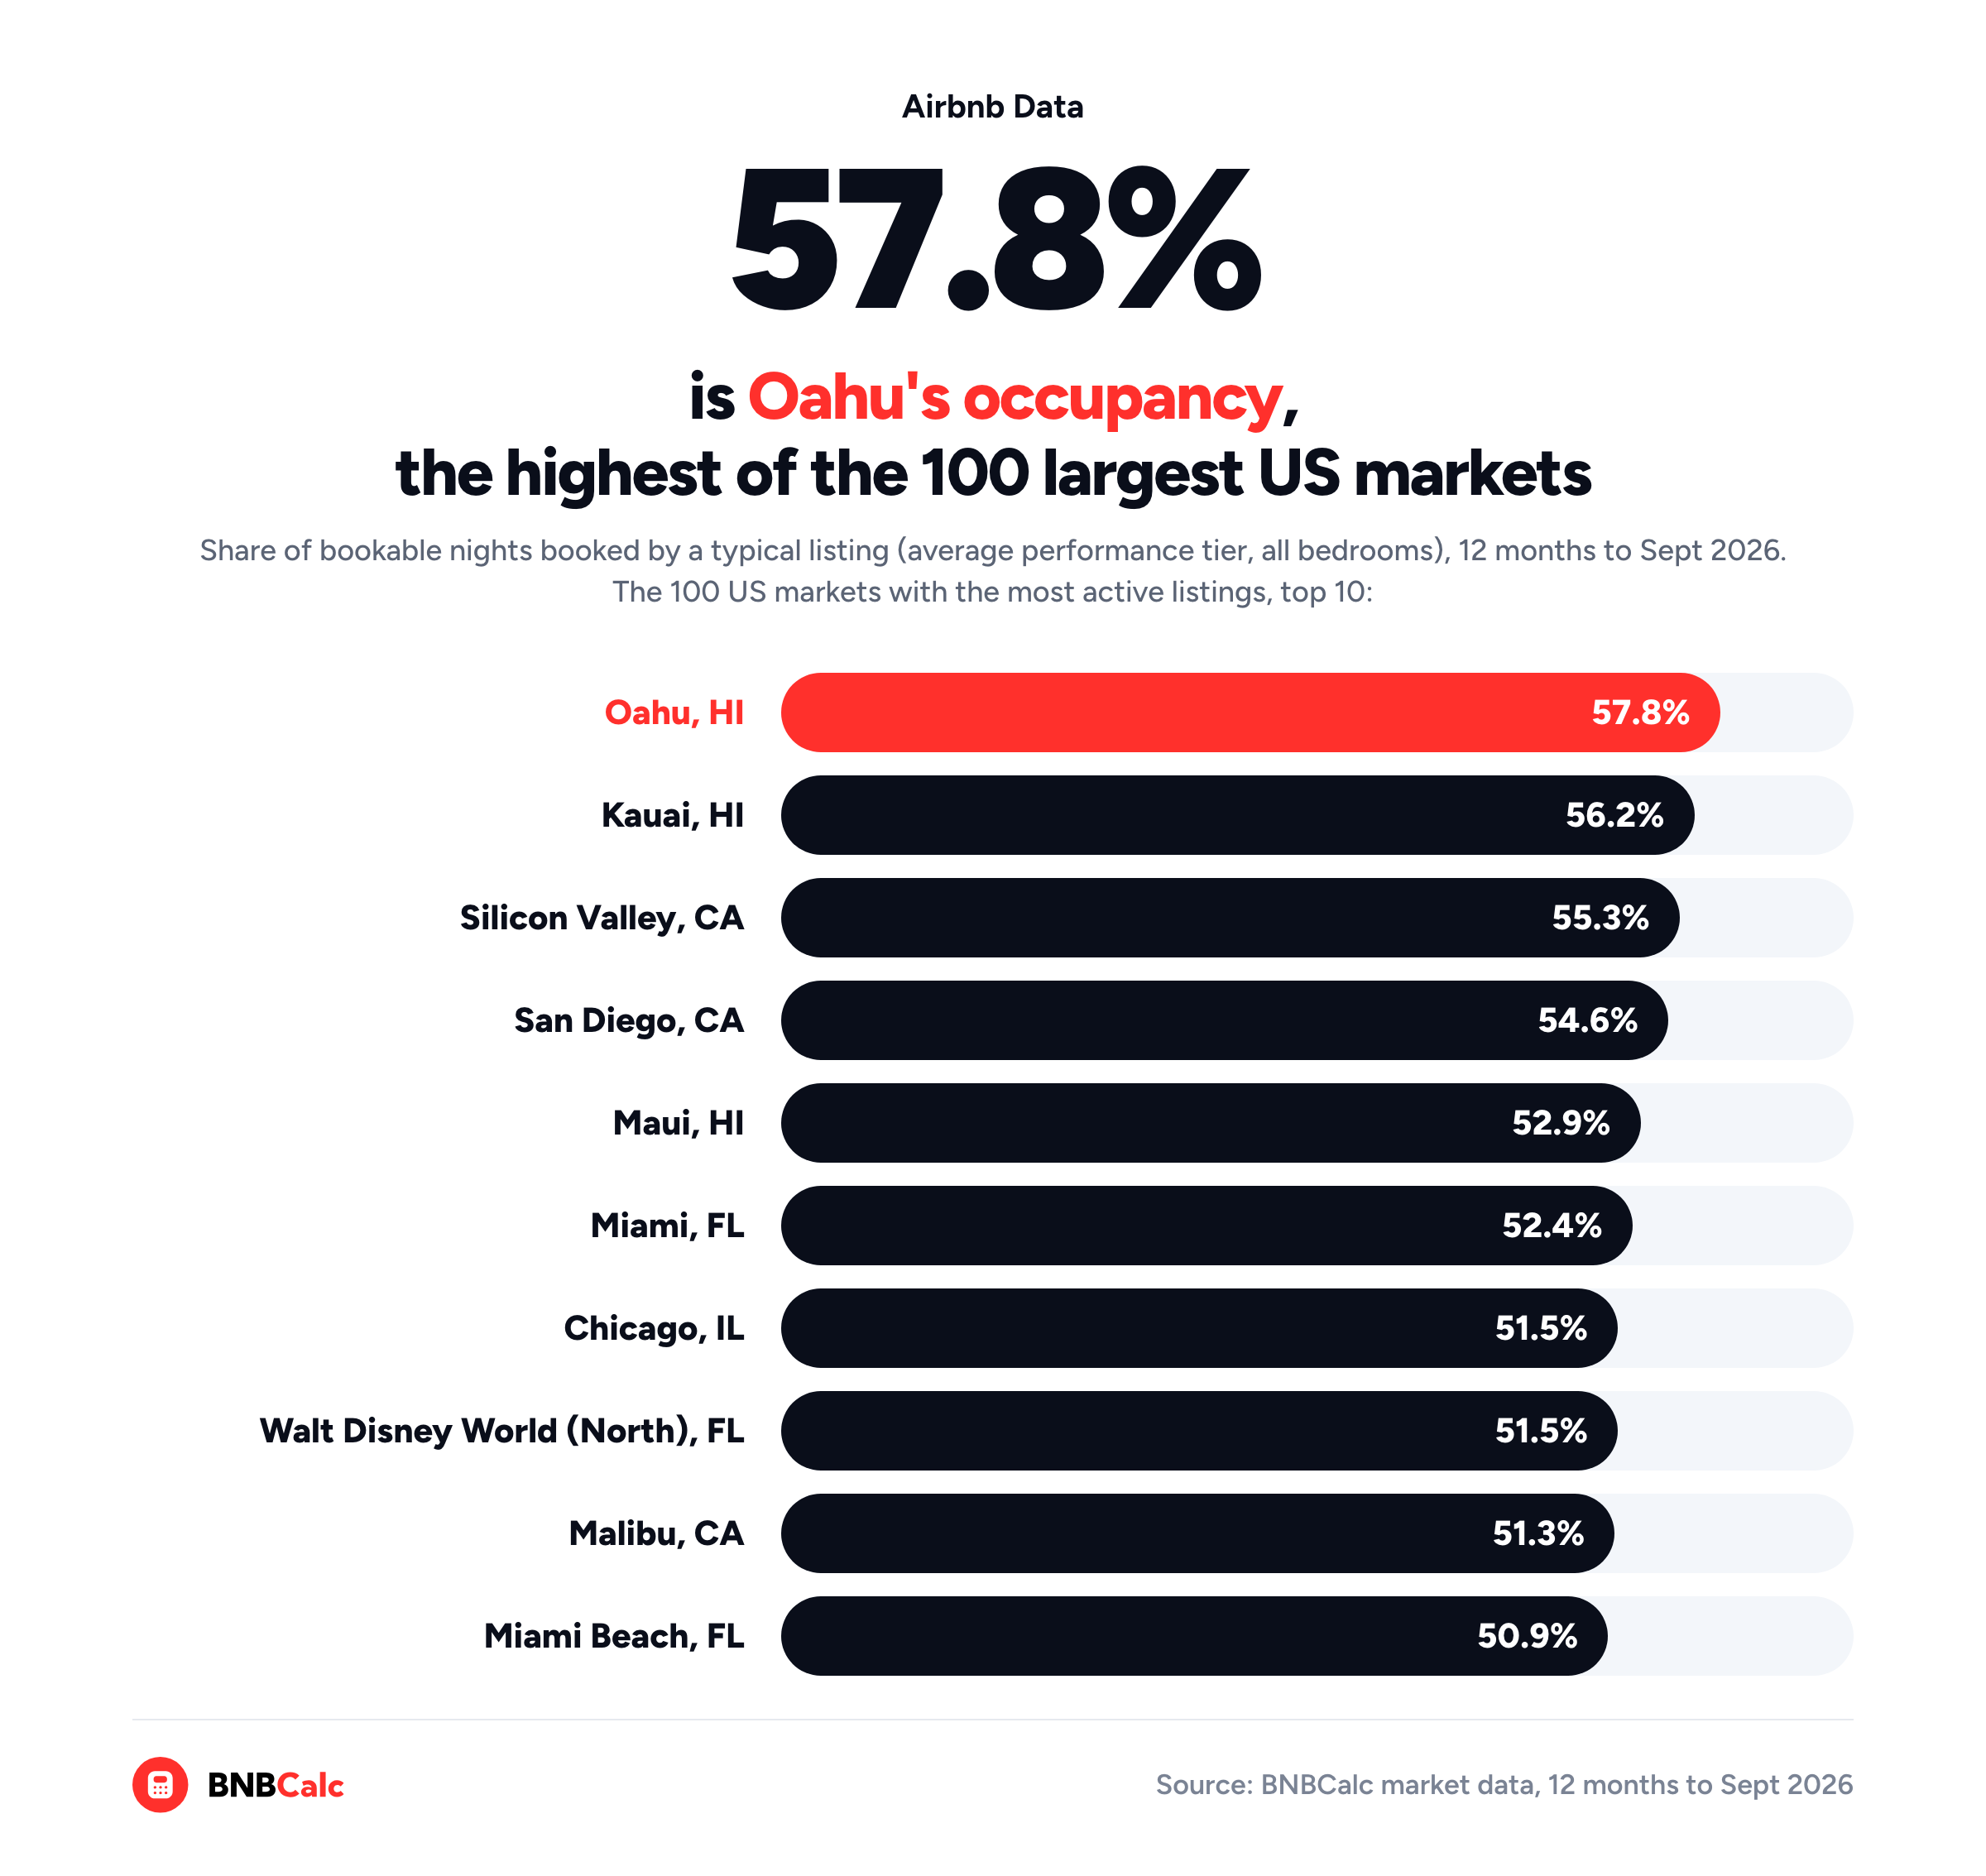
If you rank all 454 US markets with a full year of BNBCalc data on occupancy alone, half of the top ten turn out to be smaller California markets, such as San Francisco, Oakland and Oceanside. That's why I only ranked the 100 largest of the 454, measured by how many listings were active on average over the year.
| Rank | Market | Occupancy | Nightly rate (ADR) | Annual revenue |
|---|---|---|---|---|
| 1 | Oahu, HI | 57.8% | $333 | $81,466 |
| 2 | Kauai, HI | 56.2% | $493 | $105,728 |
| 3 | Silicon Valley, CA | 55.3% | $269 | $57,152 |
| 4 | San Diego, CA | 54.6% | $363 | $88,507 |
| 5 | Maui, HI | 52.9% | $502 | $104,593 |
| 6 | Miami, FL | 52.4% | $276 | $60,720 |
| 7 | Chicago, IL | 51.5% | $267 | $62,278 |
| 8 | Walt Disney World (North), FL | 51.5% | $267 | $58,592 |
| 9 | Malibu, CA | 51.3% | $386 | $83,411 |
| 10 | Miami Beach, FL | 50.9% | $397 | $94,490 |
Source: BNBCalc market pages, typical listing (average performance tier, all bedrooms), 12 months to September 2026, among the 100 US markets with the most active listings.
Each row is a typical listing in one of those 100 markets, highest occupancy first, and Hawaii holds three of the top five spots. Oahu is first in BNBCalc's data at 57.8%, while the median across all 100 sat at 42.2%.
By BNBCalc's figures, San Francisco's typical listing booked even more of its nights, 61.4%, but it isn't among those 100 by active listings, and neither are Los Angeles, at 51.4%, or New York City, at 51.3%, so none of the three shows up in the ranking.
Does a Higher Airbnb Occupancy Rate Mean More Revenue?
Not on its own, because occupancy only tells you how often guests booked, not what they paid. Among the same 100 markets, BNBCalc's typical listing in Vail, Colorado, booked only 31.3% of its bookable nights, yet it earned $108,290, since guests there paid $820 a night. On BNBCalc's Oahu page, by comparison, the typical listing booked 57.8% of its nights at $333 and earned $81,466.
In other words, the rate matters.
At the other end of the 100, BNBCalc has Osage Beach, Missouri, at the lowest occupancy, 24.8%, with Big Bear Lake, California, and Ocean City, Maryland, just above it.
You can't pick where to buy on occupancy alone, and BNBCalc Markets ranks US markets by gross yield by default, which sets what homes could earn against what they cost. If you're still building a shortlist, BNBCalc's top 10 cities for Airbnb investing is the next thing I'd read.
Why Do Airbnb Statistics for the Same City Differ?
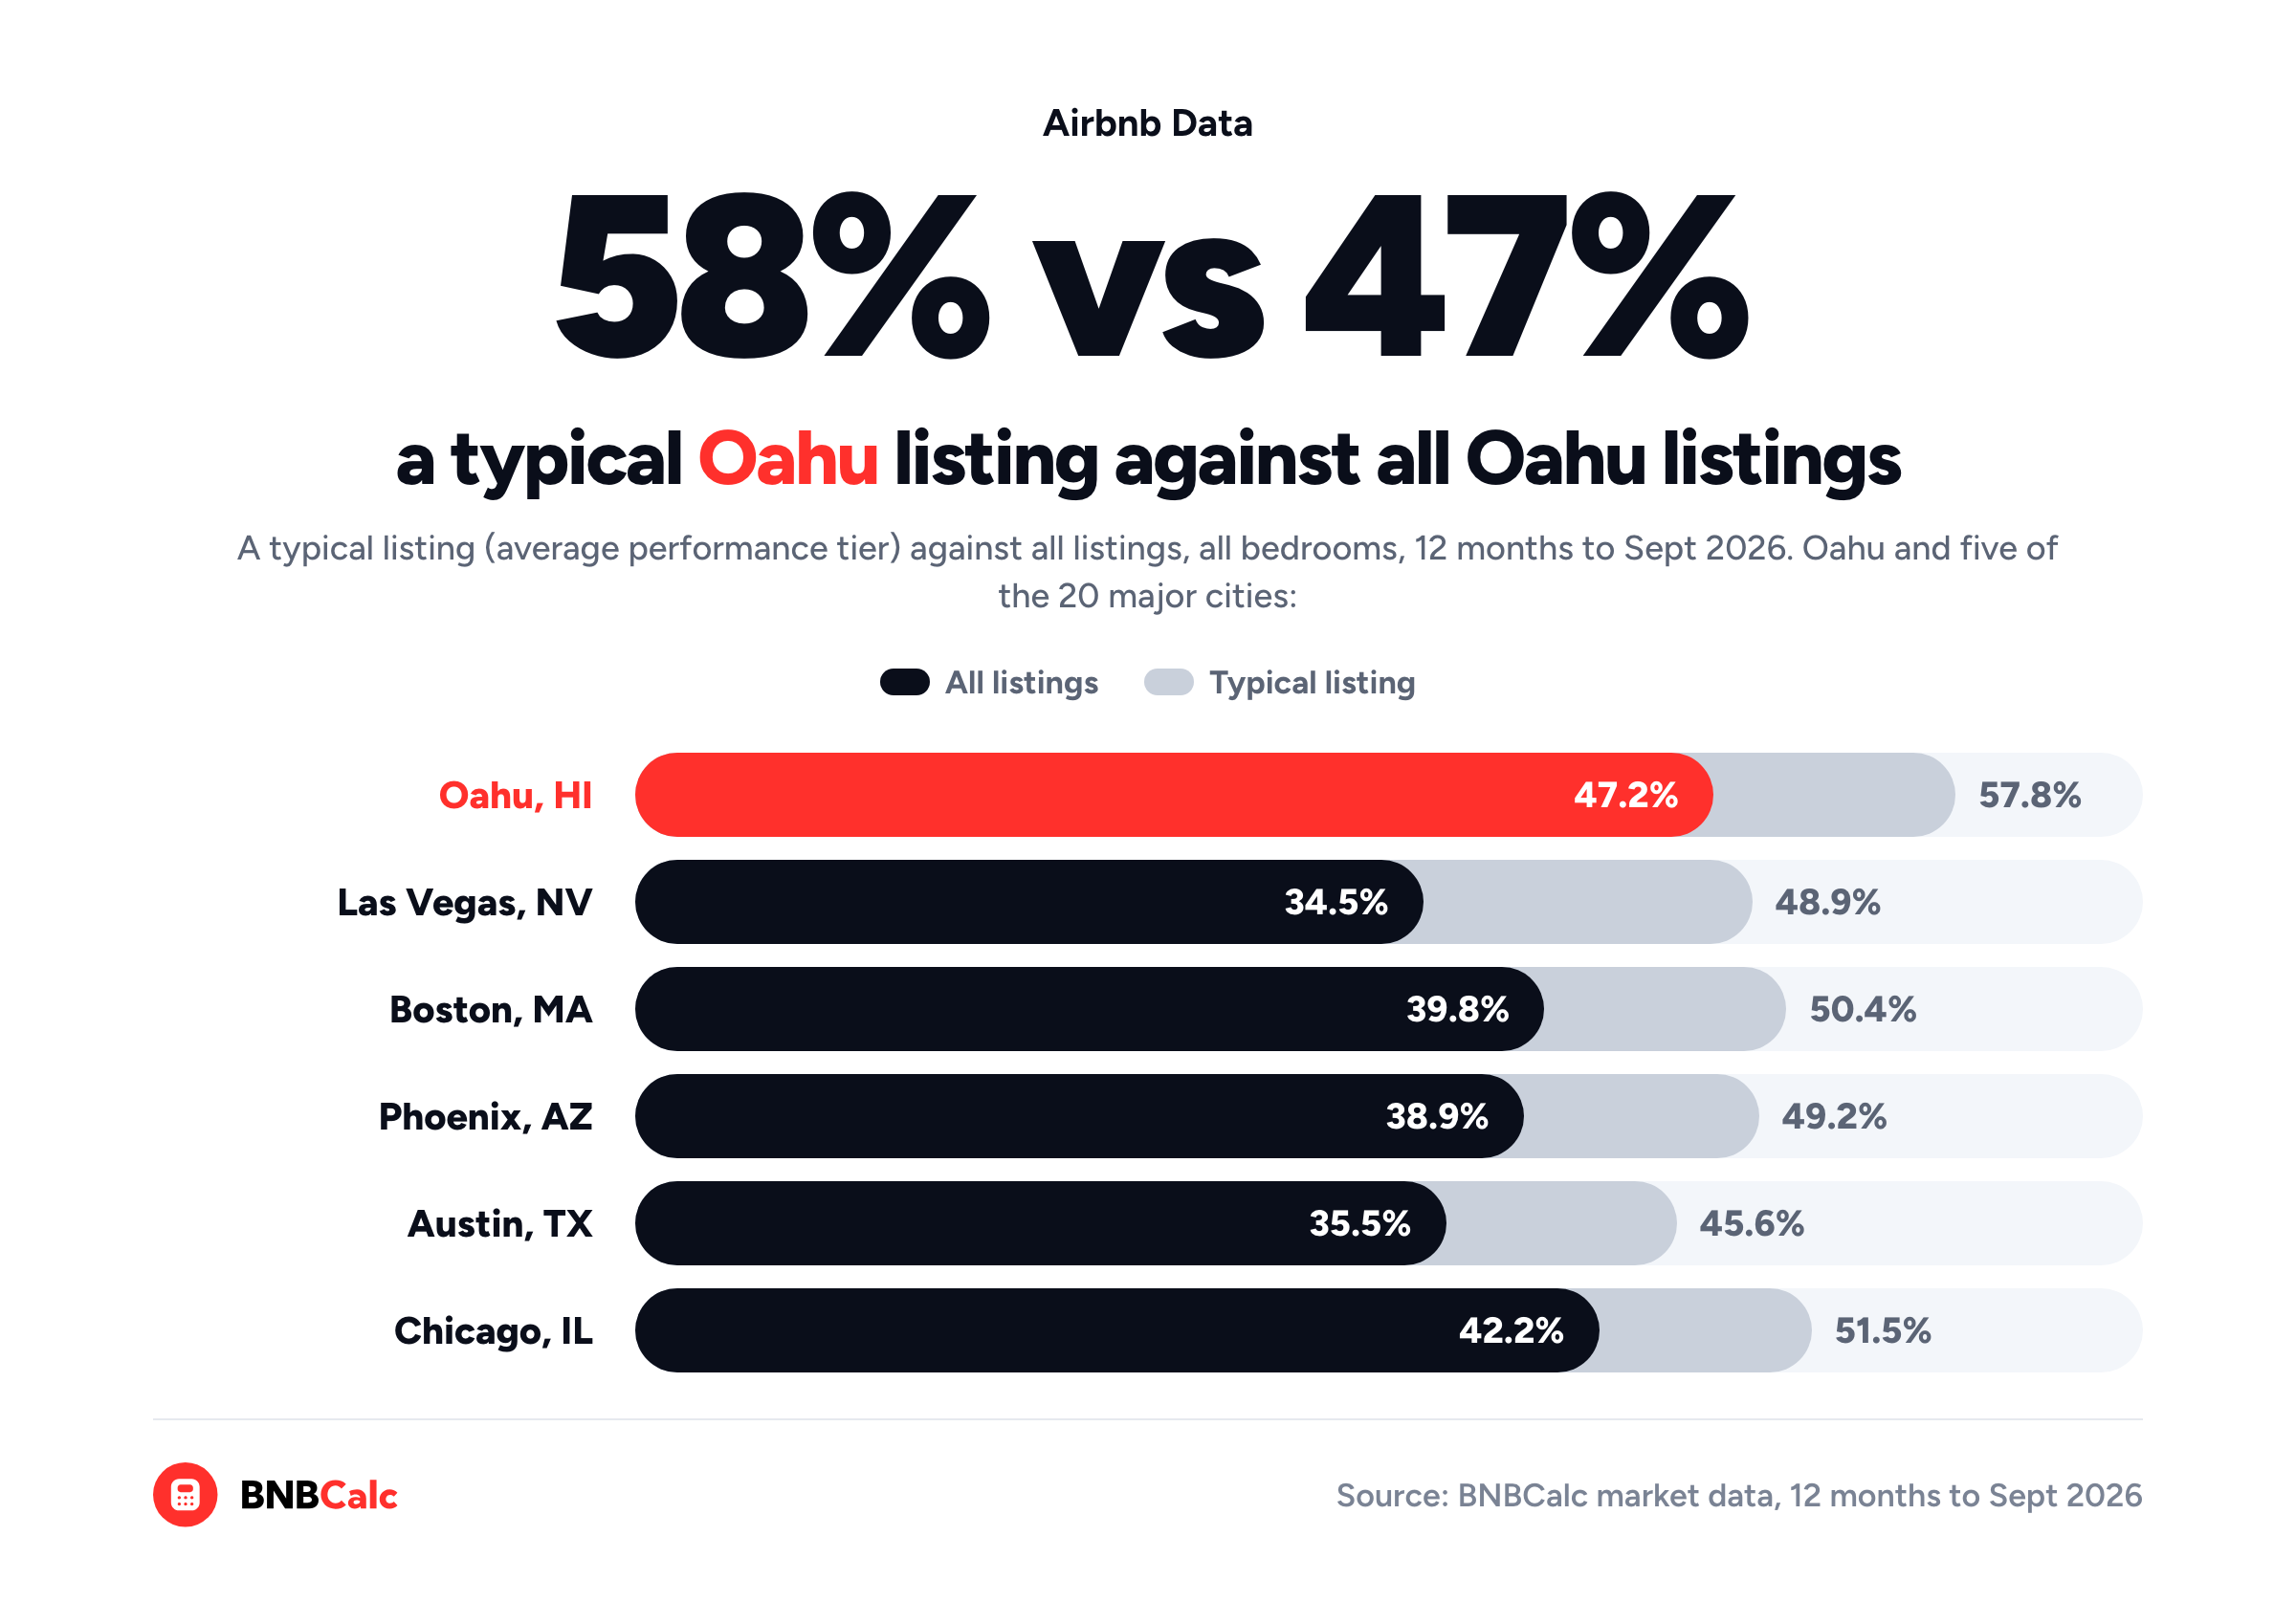
Even on one market's page, the occupancy rate you read depends on which listings it describes. On Oahu's BNBCalc page, the card up top shows 58% for the typical listing, while the market summary further down says occupancy is 47%, because it averages every active listing in the market, the low and high performance tiers included.
| Slice of Oahu's listings | Annual revenue | Occupancy | Nightly rate (ADR) |
|---|---|---|---|
| Low performance tier | $21,905 | 26.3% | $253 |
| All listings (market-wide average) | $75,691 | 47.2% | $387 |
| Average performance tier (the typical listing) | $81,466 | 57.8% | $333 |
| High performance tier | $171,652 | 67.7% | $540 |
Source: BNBCalc Markets, Oahu's Marketwide Stats cards set to each performance tier (a Markets plan view), all bedrooms, 12 months to September 2026.
Each row averages a different group of the same listings, so read down a column to see how much the slice moves the answer. In BNBCalc's Oahu figures, the all-listings nightly rate even sits above the typical listing's, because it's an average price per booked night, and the high tier, at $540, fills more of its nights than the other tiers do.
Oahu isn't an exception, since a typical listing booked a bigger share of its nights than the market-wide average did in all 20 of the major cities in BNBCalc's data.
Two figures can disagree for other reasons too, so run through a few more checks before you compare any two numbers.
First, check what occupancy divides by. BNBCalc's rate is booked nights divided by bookable nights, so the nights a host blocked don't count against it. A figure that divides by all 365 nights will come out lower for the same listings whenever hosts block nights.
Then check what's in the numbers. BNBCalc's annual revenue and nightly rates both include cleaning fees, and both come before Airbnb's host fee is taken out, whereas room potential leaves cleaning income out.
Keep in mind, too, that a BNBCalc market is a market area rather than a city's limits. Brandon, Florida, for example, shows up in Markets as part of the Tampa market area, so the Tampa figures cover more than the city itself. If you only want part of Tampa, BNBCalc's public pages for selected neighborhoods, such as Ybor City, set that area's yearly revenue, occupancy, nightly rate and gross yield against the whole market. Those pages average individual listings that were open for booking at least 127 nights over the past year, though, so their figure for all of Tampa won't match the card on Tampa's market page either.
And don't try to rebuild a market's revenue from its nightly rate and occupancy. These are averages across many listings and 12 months, and averages don't multiply that way.
How Do You Compare Airbnb Statistics Between Cities?
Once you know which slice a number counts, comparing two cities comes down to holding everything else still. On a Markets plan, set both market pages to the same performance tier and the same bedroom count, so a three-bedroom in one city is up against a three-bedroom in the other, over the same 12 months.
Then add the home price. Gross yield does that for you in US markets, which is why I'd shortlist on it before occupancy. For example, BNBCalc's typical listing in Chicago earned less than San Francisco's, yet Chicago's gross yield came to 12.8% against 6.2%.
Still, a market figure is only an average. Once a city makes your shortlist, you'll want to run the specific house through the BNBCalc Calculator. It pulls up to 50 comparable listings nearby, lets you run AI Underwriter to keep the closest matches on a US property, and then takes your costs and your loan through to cash flow.
So, Where Can You Find Airbnb Statistics by City?
You'll find them in BNBCalc Markets, where each US market's page shows a typical listing's annual revenue, occupancy and nightly rate for the past year, and the Markets plan breaks them down by bedroom count and performance tier. Across the 454 US markets with a full year of BNBCalc data to September 2026, the medians came to 38.4% occupancy, $257 a night and $41,059 a year.
So open the page for the city you're weighing, and check which slice and bedroom count you're looking at before comparing it with another city. Read the label before the number.
A city's statistics describe its typical listing, never the house you'll end up owning. The busiest market isn't always the one that pays best, either, and the one that pays best isn't always one where you're allowed to host, so a number only starts to mean something once you know what it leaves out.
Frequently Asked Questions
What Is the Average Airbnb Occupancy Rate in the US?
BNBCalc Markets puts the median at 38.4% for a typical listing across the 454 US markets with a full year of data to September 2026, and the middle half of those markets ran from 34.1% to 42.4%. Only 26 of them reached 50% or more in BNBCalc's data. BNBCalc counts occupancy as booked nights divided by bookable nights, so the nights a host blocked don't drag it down.
Which US City Has the Highest Airbnb Occupancy Rate?
Among the 100 US markets in BNBCalc Markets with the most active listings, Oahu had the highest occupancy over the 12 months to September 2026, with a typical listing booking 57.8% of its bookable nights. Kauai came second in BNBCalc's ranking at 56.2%, and Silicon Valley third at 55.3%. BNBCalc's typical San Francisco listing booked more, 61.4%, but San Francisco isn't one of those 100 markets.
Where Can I See Airbnb Occupancy Rates and Nightly Rates for a City?
On the city's page in BNBCalc Markets. Even without a plan, it shows a typical listing's annual revenue and, in most markets, its occupancy rate and nightly rate for the past 12 months, plus the current gross yield in US markets, and BNBCalc's state rankings list every US market's occupancy, ADR and gross yield with no account needed. The Markets plan adds the other performance tiers, bedroom counts and what each listing earned.
What Is a Good Occupancy Rate for an Airbnb?
A good one beats the typical listing in your own market, and BNBCalc Markets shows you that figure for every US market it tracks. That bar moves a lot from city to city. Over the 12 months to September 2026, BNBCalc's typical listing booked 33.7% of its bookable nights in Houston but 57.8% on Oahu, so 45% would put you well ahead in one and behind in the other. Check revenue alongside it, too, since a full calendar at a low rate can earn less than a quieter one.
Does BNBCalc's Airbnb Occupancy Rate Count Nights the Host Blocked?
No. BNBCalc Markets counts occupancy as booked nights divided by bookable nights, so nights the host blocked don't count against it, whatever they were used for. On BNBCalc's Oahu page, for example, the typical listing booked 57.8% of its bookable nights over the 12 months to September 2026. In Markets, each listing's detail panel also shows how many days its host blocked that year, so you can see how much of the calendar was open.
BNBCalc Markets Pricing and Free Trial
When you want any city's numbers by bedroom count and performance tier, plus the listings behind them, BNBCalc Markets is $79 a month or $399 a year as of October 2026, and it includes the full BNBCalc Calculator. You can compare the plans, run two property analyses free, or start a 7-day free trial with full access.
Airbnb Tax Deduction Calculator
Paying too much in taxes? We have the perfect solution. Simulate an Airbnb home purchase below.
Purchase Price
$450K
Structure Value
70%
Apply Trump's Tax Cut (Bonus Depreciation)
Depreciation
$117,695
Interest
$21,600
Tax
$6,750
Year 1 Deduction
$146,045
Want to claim this deduction? Get a free cost segregation benefit analysis from CSA Partners — no obligation.
Get Full Analysis