
Free instant analysis
Reveal Airbnb revenue for any address or city
Are paid Airbnb analytics tools worth it, or can you get by on the free ones? Well, if you're buying a property, a plan usually pays for itself the first time it keeps you from planning on revenue the house won't earn. A typical three-bedroom in BNBCalc's Wilmington, North Carolina market grossed $59,149 over the 12 months to September 2026. On illustrative costs and a loan, earning 10% less than planned would cost you about $4,518 of cash flow a year, while a year of the BNBCalc Calculator costs $199.
Still, not everyone needs one, and if you're only checking a house or two, BNBCalc's free options and its 7-day free trial are enough.
I'll start with what you can do before you pay and what each plan adds. Then I'll run that Wilmington house through two mistakes, a small revenue miss and buying in a market that earns less at about the same price, to show where a subscription pays for itself.
What Can You Do With BNBCalc for Free?
Start with the BNBCalc Calculator, since you can run two property analyses free, without a plan. Each one takes an address, pulls up to 50 comparable listings nearby and works the house through its running costs and your loan to cash flow, so two are enough to test the houses you're most serious about.
Make sure to create an account before you run them, because signed out, an upgrade window you can't close covers each analysis a few seconds after it loads. With an account, that window appears once per analysis instead.
For market research, every BNBCalc market page shows its headline annual revenue without an account, and most show occupancy and the average daily rate too. For example, BNBCalc's Wilmington market page shows that its typical listing earned $58,213 at 39% occupancy and a $348 average daily rate over the 12 months to September 2026, across all bedroom counts.
On top of that, the state ranking pages are public. When I opened North Carolina's on October 21, 2026, it ranked the 16 markets BNBCalc tracks in the state by gross yield. BNBCalc works that out as the median of each eligible home's annual room-revenue potential divided by its ZIP- and bedroom-matched home value, with cleaning income excluded. The page also listed each market's median annual room potential, nightly rate and occupancy, with filters for bedroom count and performance tier.
Better still, BNBCalc Markets' sample market, Broken Bow, Oklahoma, has everything unlocked, and BNBCalc's free tools, such as its DSCR, amortization and STR tax calculators, work without an account.
And once two analyses aren't enough, the 7-day free trial gives you full access to either plan. It saves your card without charging it, and if you cancel before it ends, you won't be charged. You get one trial per account. Start it once you've got a shortlist ready.
What Does a Paid BNBCalc Plan Add?
A plan takes the limits off.
The BNBCalc Calculator is for checking addresses, one at a time but as many as you like, while BNBCalc Markets is for researching the markets themselves, and it includes the full Calculator.
| What you get | Without a plan | BNBCalc Calculator | BNBCalc Markets |
|---|---|---|---|
| Price, as of October 2026 | No plan needed | $30 a month or $199 a year | $79 a month or $399 a year |
| Property analyses | Two | Unlimited | Unlimited |
| Exact amenity revenue figures in each analysis | Top amenity only | Included | Included |
| Market data | Headline annual revenue (most markets add occupancy and nightly rate), plus state rankings | Same as without a plan | Each market's active listings, by bedroom count and performance tier, with amenity revenue impact and up to 36 months of history |
| Comp sets | Not included | Not included | Build, share and export your own |
Read the table by column: the Calculator lifts the limit on addresses, and Markets adds the research that comes before you have one. Since Markets includes the full Calculator, the two analysis rows read the same for both plans. Either plan also takes the upgrade window off each analysis and unlocks Excel export, which a free account can't use.
There's also the BNBCalc API, billed by use rather than by plan. As of October 2026, it costs $0 a month plus $0.20 for each report it creates and $0.10 for each AI step that completes, such as AI comp selection, and a failed request costs nothing. It returns the Calculator's kind of analysis as data your own software can read, with a link to the hosted report, and our guide to Airbnb analytics software runs one house through all three tools.
When Does an Airbnb Analytics Subscription Pay for Itself?
A subscription pays for itself when it changes a decision that's worth more than the subscription. That's easy to test on your own deal in the BNBCalc Calculator: run the address, switch on Manual revenue input, type in a lower annual revenue and watch what happens to the Profit (Cash Flow) line.
Since I can't run your address for you, I've worked one hypothetical house by hand instead. Say you buy a three-bedroom in BNBCalc's Wilmington market for an illustrative $360,435. It grosses what the typical three-bedroom there earned, $59,149 with cleaning fees included, and by typical I mean BNBCalc's average performance tier.
Everything else is illustrative: Airbnb's single service fee at the 15.5% most hosts pay, cleaning at $400 a month on average, $11,280 a year in other running costs, $3,000 in property tax, and 25% down on a 30-year loan at 6.00%. That rate is the Calculator's default, and it sits below the 7.40% average in Freddie Mac's survey for October 15, 2026.
I've counted year-one cash flow the way the Calculator's Profit box does: bookings less Airbnb's fee, cleaning and running costs, then less Mortgage & Taxes, which is the loan payments plus property tax. As in the Calculator, the fee and cleaning move with revenue, and there's no revenue growth or income tax in it.
Then, for the second mistake, I've bought the typical three-bedroom in BNBCalc's Charlotte market instead, at an illustrative $351,054, with the same costs and loan terms. That's the last column.
| Year one | Wilmington, as planned | Wilmington, 10% less revenue | Charlotte, as planned |
|---|---|---|---|
| Purchase price | $360,435 | $360,435 | $351,054 |
| Gross bookings | $59,149 | $53,234 | $40,814 |
| Airbnb host fee (15.5%) | -$9,168 | -$8,251 | -$6,326 |
| Cleaning | -$4,800 | -$4,320 | -$4,800 |
| Other running costs | -$11,280 | -$11,280 | -$11,280 |
| Mortgage & Taxes | -$22,452 | -$22,452 | -$21,948 |
| Cash flow | $11,449 | $6,931 | -$3,540 |
Revenue: BNBCalc market data, typical (average-tier) three-bedrooms, 12 months to September 2026; the prices, fee, costs and loan terms are illustrative.
Each column is one year on one house: the first is the plan, the second is the same house earning 10% less, and the third is the same kind of purchase in Charlotte, priced about the same but earning a lot less.
How Much Does a 10% Revenue Miss Cost?
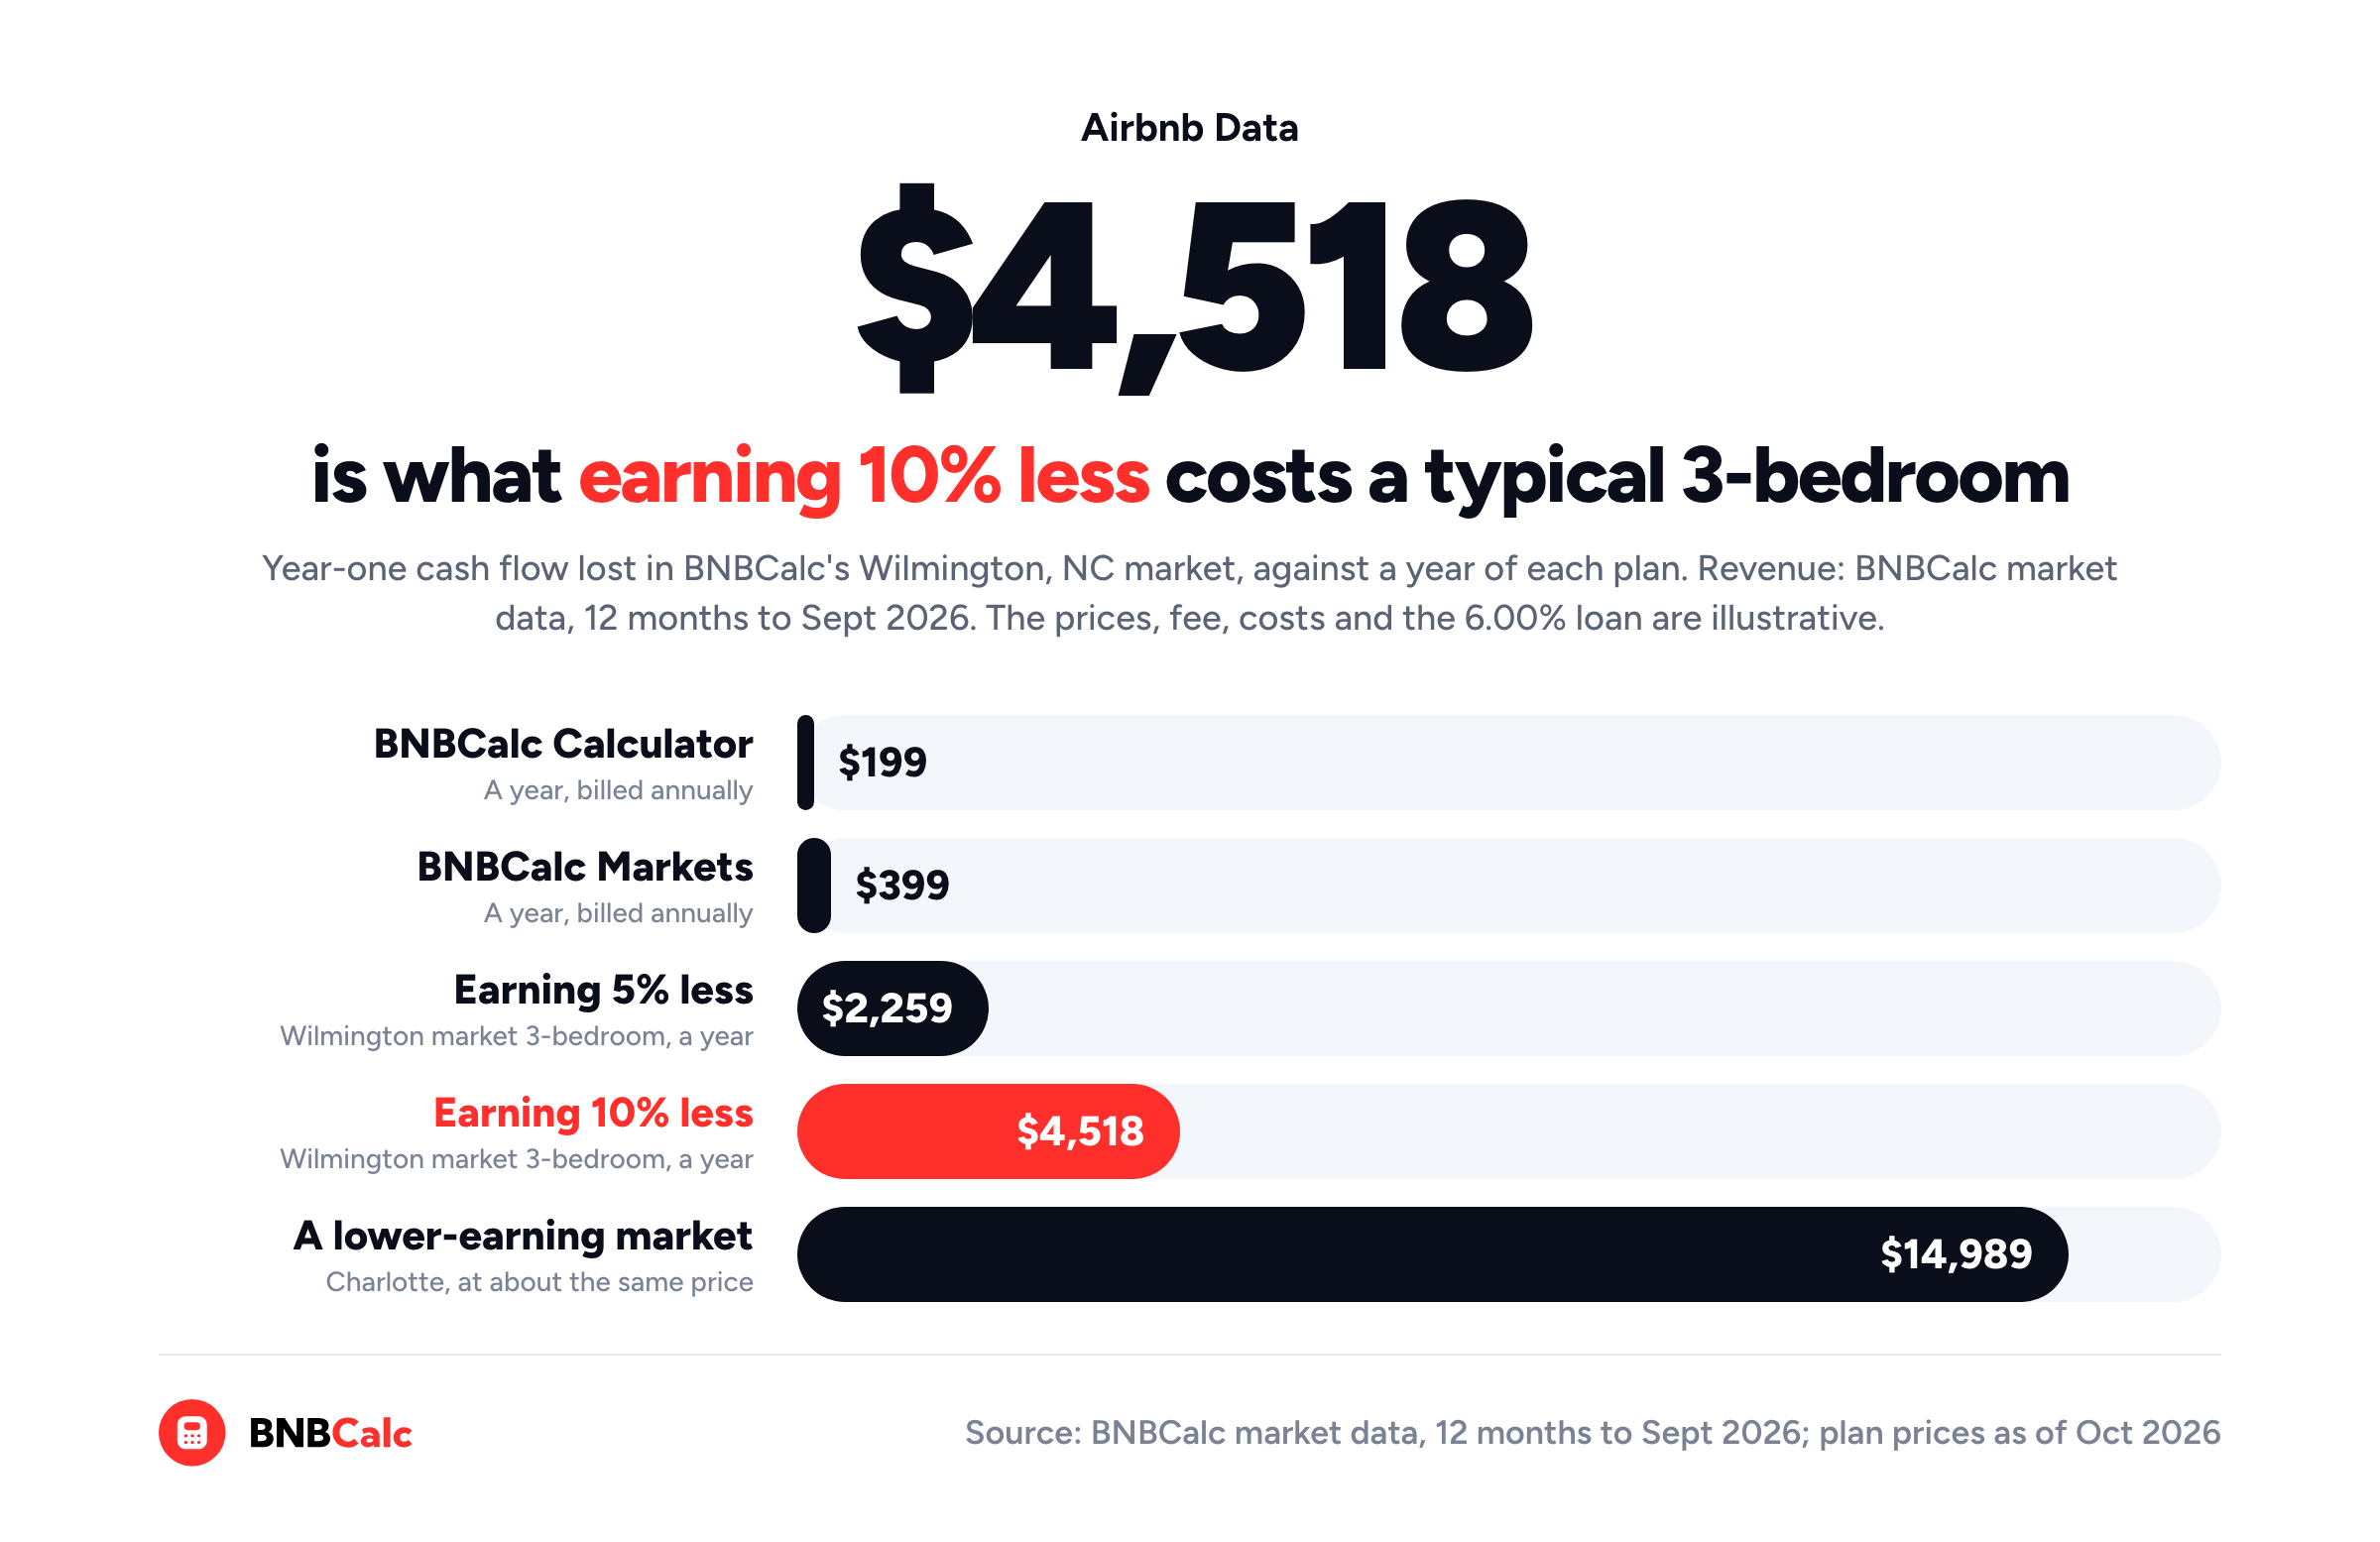
If the Wilmington house earns 10% less than you planned, its gross bookings fall by $5,915. Airbnb's fee falls with them, by $917, and so does cleaning, by $480. Your other running costs, property tax and loan payments still cost the same, so your cash flow drops by $4,518 ($5,915 - $917 - $480), from $11,449 to $6,931. Even a 5% miss would take $2,259 off the year.
In other words, a 10% miss takes 39% of your cash flow, because the loan, the property tax and the other running costs don't shrink when the bookings do.
Set against the plans, that $4,518 is nearly 23 times the $199 a year the BNBCalc Calculator costs, and about 11 times a year of Markets at $399. Put the other way round, this house only has to fall $261 short of its plan, or 0.4%, for the shortfall to cost as much as a year of the Calculator, and $522 short, or 0.9%, to cost as much as a year of Markets.
If checking the comps before you buy keeps you from overestimating this house's revenue by even half of 1%, then, the Calculator has already paid for its year. Our guide to how much you can make on Airbnb walks another house from gross bookings to cash flow, line by line.
How Much Does Buying in a Lower-Earning Market Cost?
Even so, a revenue miss is the smaller mistake. The bigger one is the market itself: a typical three-bedroom in BNBCalc's Charlotte market grossed $40,814 over the same 12 months, $18,335 less than the Wilmington house, even though I've priced the two within 3% of each other.
On the same illustrative costs and loan, the Charlotte house loses $3,540 a year, which leaves it $14,989 a year behind the Wilmington house, more than 37 times what a year of BNBCalc Markets costs. Keep in mind that's one comparison of two typical houses on prices and costs I picked, so it doesn't make Charlotte a bad market, only one that earns less at this price.
To be fair, you could've spotted part of that gap without a plan, because as of BNBCalc's October 7, 2026 data update, the public North Carolina ranking page puts Wilmington's median annual room potential at $44,034, against $29,704 for Charlotte. Its gross yield column tells a different story, putting Charlotte a shade ahead at 8.7% to Wilmington's 8.5%, but each of those is a median of home-by-home yields across every size, with cleaning income left out, while my comparison is of two typical three-bedrooms. What the page can't show you is where the money comes from.
For that, you'd open the Wilmington market's listing map in BNBCalc Markets. A BNBCalc market covers a region rather than one city. By my count of BNBCalc's listing data, about three in four of this one's three-bedrooms are on the coast, in towns such as Oak Island, Carolina Beach and Wrightsville Beach, while about one in five are in Wilmington's own ZIP codes.
If the house you're looking at is in Wilmington itself, its comps may not look much like the market's typical listing, which is why you'd run its address through the Calculator before you make an offer.
Then, make sure the town your house is in allows short-term rentals before you trust any of these numbers, and BNBCalc's regulation guides are a good place to start. Our guide to finding the best Airbnb markets covers the rest of the market screen.
Do You Need a Paid Airbnb Analytics Tool?
Whether you need one depends on how many decisions you've got coming. If it's one or two houses, BNBCalc's free options are usually enough, but if it's a steady stream of houses, markets or comps, a plan earns its cost quickly.
| Your situation | The BNBCalc option that fits | What it costs, as of October 2026 |
|---|---|---|
| Checking one or two addresses | Run two property analyses free in the Calculator | $0 |
| Researching one deal for a week | The 7-day free trial, with full access | $0 if you cancel before it ends |
| Checking several properties, or running comps on a new deal every week | The BNBCalc Calculator | $30 a month or $199 a year |
| Choosing a market | BNBCalc Markets, which includes the Calculator | $79 a month or $399 a year |
| Keeping an eye on the listings you'd compete with | Comp sets in BNBCalc Markets | Included in Markets |
| Screening addresses inside your own software | The BNBCalc API | $0.20 a report, plus $0.10 per AI step |
Only two rows cost nothing. The rest are paid by plan or, for the API, by the report, and the more often you'd do the job, the sooner that cost pays for itself. And if you're comparing BNBCalc with other paid tools, our roundup of the best Airbnb analytics tools sets out their prices and what each one covers.
So, Are Paid Airbnb Analytics Tools Worth It?
For anyone buying a short-term rental, usually yes.
A typical three-bedroom in BNBCalc's Wilmington market, for example, grossed $59,149 over the 12 months to September 2026, so on illustrative costs, earning 10% less would cost it about $4,518 of cash flow a year. The typical Charlotte three-bedroom at about the same price would leave you $14,989 a year behind. Against either of those, a year of the BNBCalc Calculator is $199 as of October 2026, and Markets is $399.
If you're only checking a house or two, the free options are enough: run two property analyses free or start the 7-day free trial, then subscribe once the addresses or markets pile up.
Whatever tool you use, its price is the easy number to see. The expensive one is the mistake you never notice, because nobody sends you a bill for revenue a house was never going to earn.
Frequently Asked Questions
Can You Try BNBCalc for Free?
Yes. You can run two property analyses free in the BNBCalc Calculator, or start a 7-day free trial with full access to either plan and won't be charged if you cancel before it ends. BNBCalc's market pages show headline numbers without a plan too: its Wilmington, North Carolina market page shows a typical listing earning $58,213 at 39% occupancy and a $348 average daily rate over the 12 months to September 2026.
Is the BNBCalc Calculator Worth $199 a Year?
The BNBCalc Calculator is usually worth it to anyone buying a property. It costs $199 a year as of October 2026, which is about a third of 1% of the $59,149 a typical three-bedroom in BNBCalc's Wilmington, North Carolina market grossed over the 12 months to September 2026. Missing that house's revenue by 10% would mean $5,915 less in bookings a year, so catching even a small overestimate on one house covers the plan.
What's the Difference Between BNBCalc's Calculator and Markets?
The BNBCalc Calculator checks one address at a time: its comps, revenue, running costs and your loan, through to cash flow and cash-on-cash return. BNBCalc Markets researches the markets themselves, with each market's active listings, bedroom and performance-tier breakdowns, amenity revenue impact and comp sets, and it includes the full Calculator. As of October 2026, the Calculator is $30 a month or $199 a year, and Markets is $79 a month or $399 a year.
Should You Pay Monthly or Yearly for BNBCalc?
BNBCalc's yearly plans are cheaper if you'll keep a plan for at least six months on Markets or seven on the Calculator. Seven months of the BNBCalc Calculator at $30 come to $210, against $199 for a year, and six months of BNBCalc Markets at $79 come to $474, against $399. If one round of market research will outlast the 7-day free trial both plans start with, a single month of Markets costs less than a year.
How Much Does the BNBCalc API Cost?
The BNBCalc API costs $0 a month plus $0.20 for each report it creates, as of October 2026, with $0.10 more for each AI step that completes, such as AI comp selection or AI expense estimates. A failed request isn't charged. Screening 250 addresses in a month would cost $50, or $75 if AI comp selection completes on each one.
BNBCalc Calculator and Markets Pricing and Free Trial
When you've got an address to check, the BNBCalc Calculator is $30 a month or $199 a year as of October 2026. If you're still choosing where to buy, BNBCalc Markets is $79 a month or $399 a year, and it includes the full Calculator. You can compare the plans, run two property analyses free, or start a 7-day free trial with full access.
Airbnb Tax Deduction Calculator
Paying too much in taxes? We have the perfect solution. Simulate an Airbnb home purchase below.
Purchase Price
$450K
Structure Value
70%
Apply Trump's Tax Cut (Bonus Depreciation)
Depreciation
$117,695
Interest
$21,600
Tax
$6,750
Year 1 Deduction
$146,045
Want to claim this deduction? Get a free cost segregation benefit analysis from CSA Partners — no obligation.
Get Full Analysis