
Free instant analysis
Reveal Airbnb revenue for any address or city
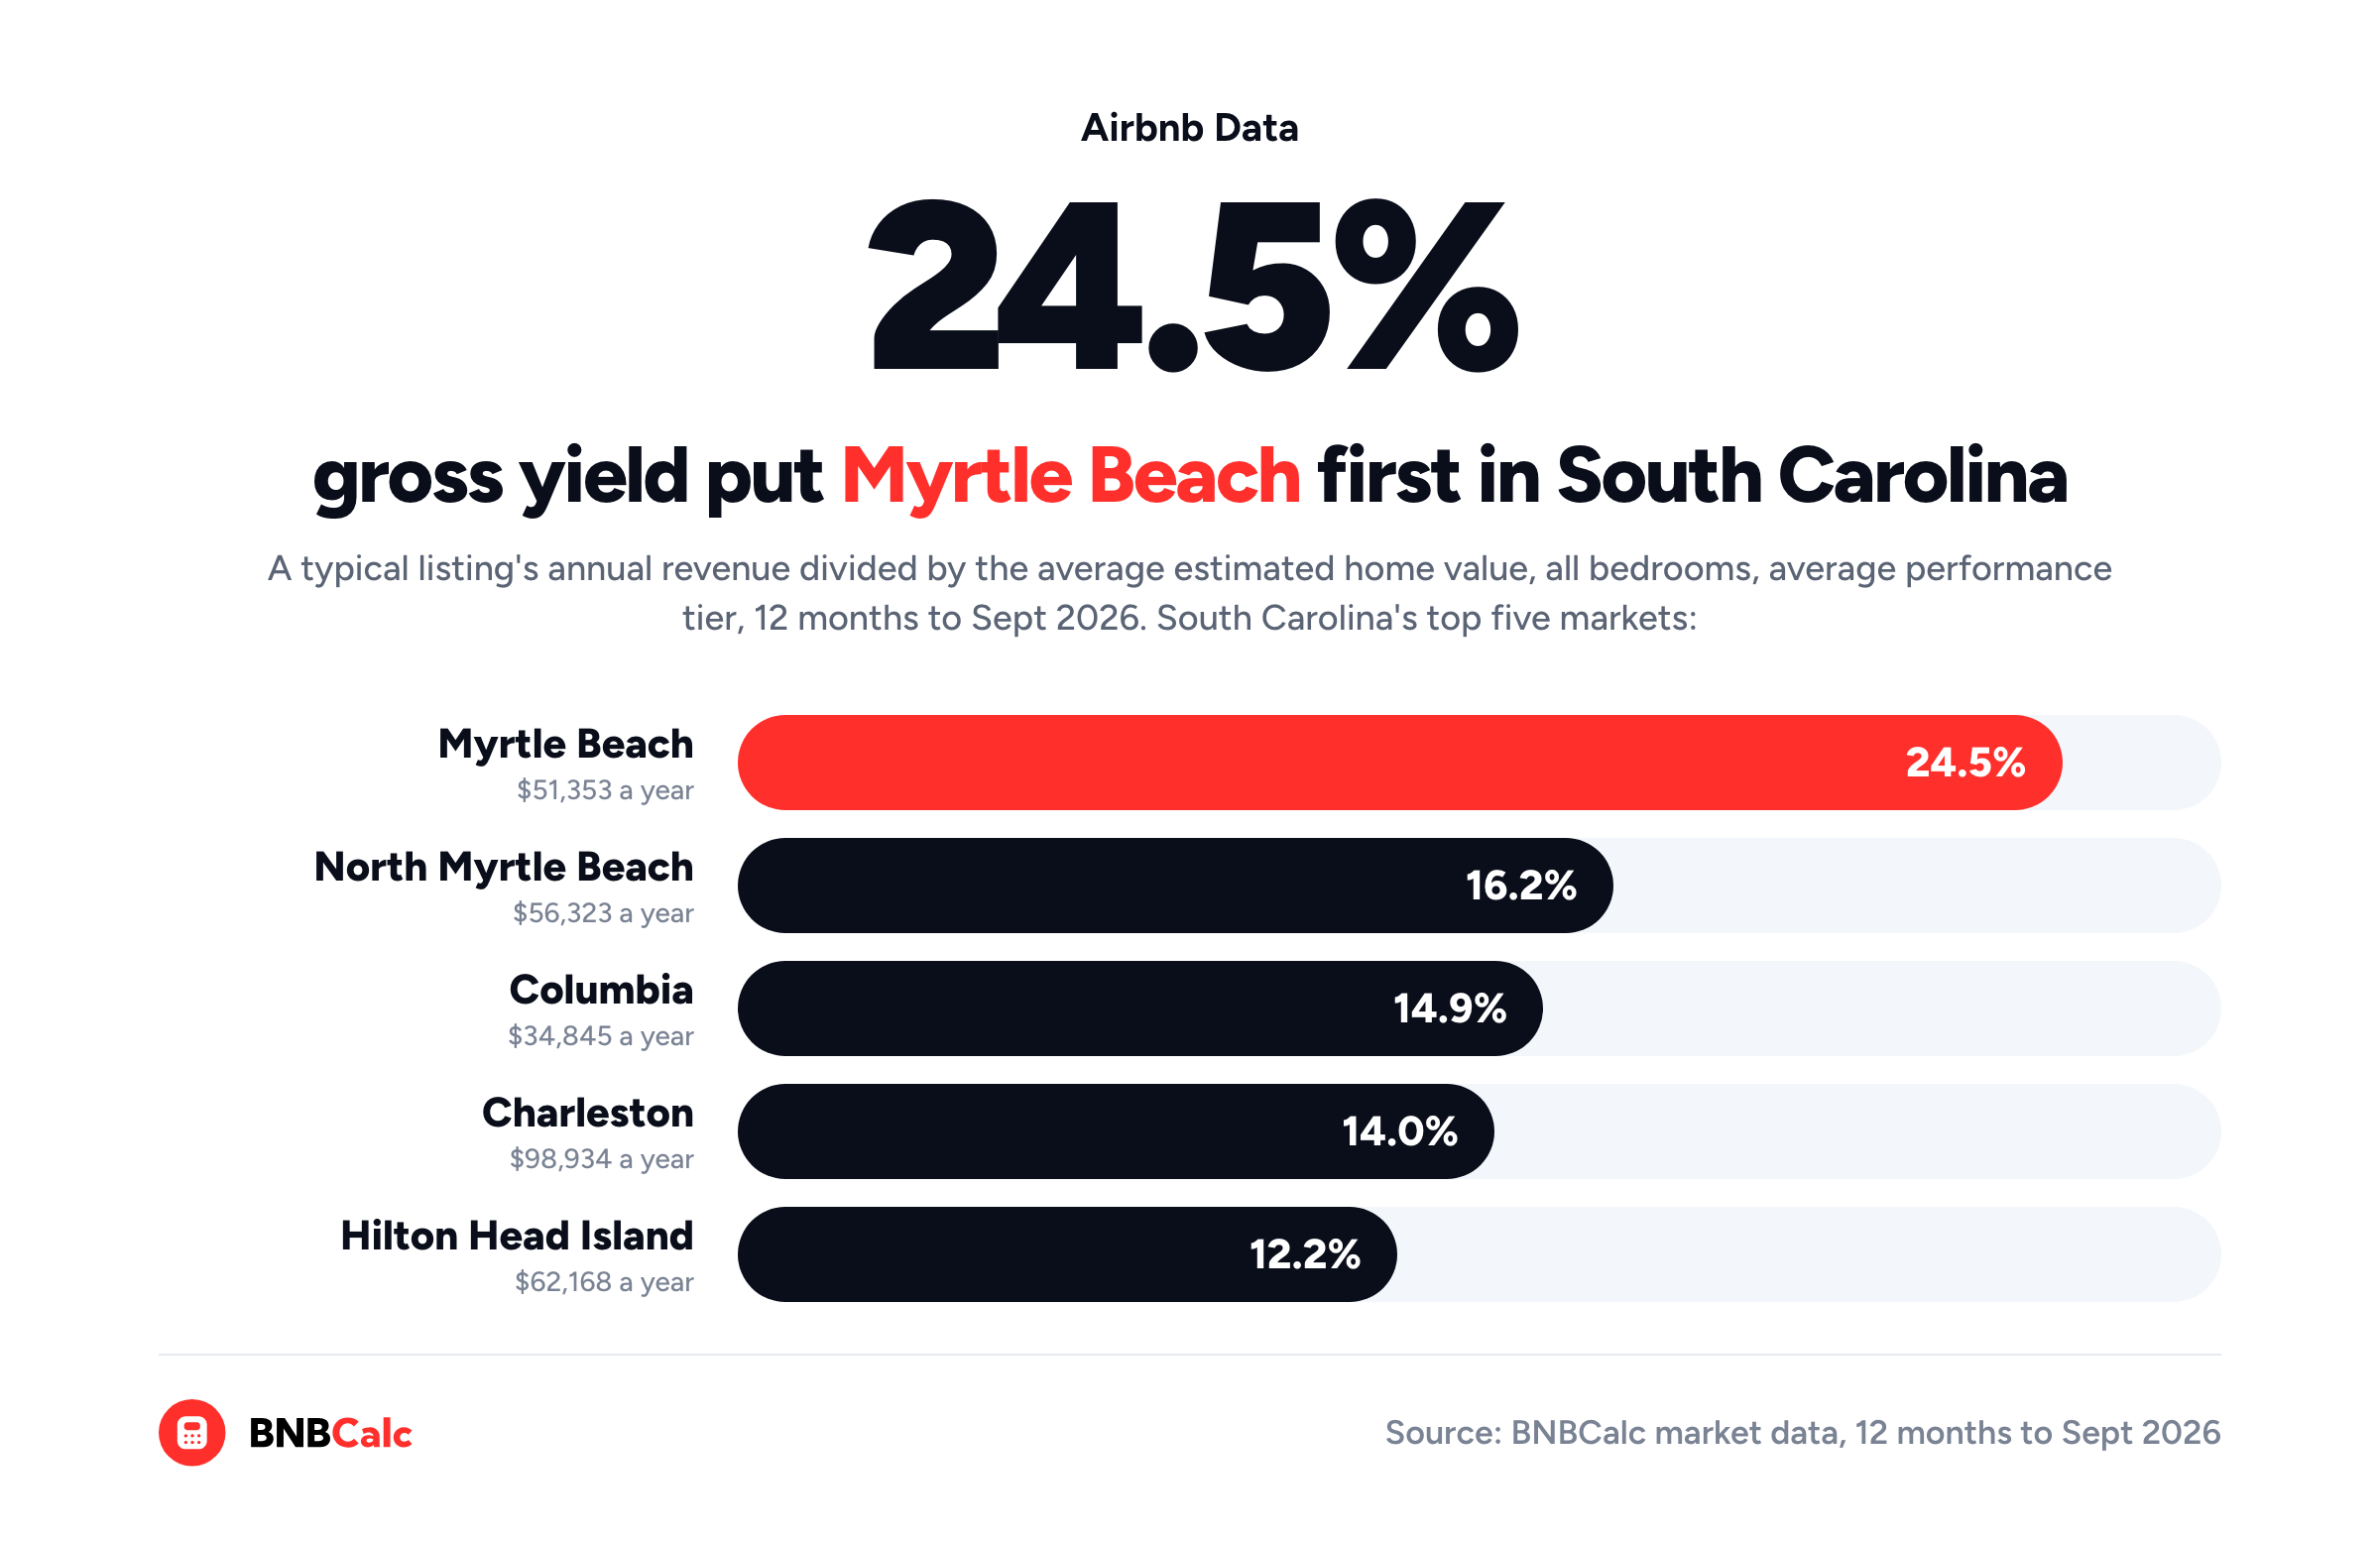
What should Airbnb analytics software do for you, and how do the pieces fit together? Well, it has three jobs, and the first one is picking a market. When I ran South Carolina through BNBCalc in October 2026, Myrtle Beach came out on top, with a typical listing grossing $51,353 over the 12 months to September 2026, a 24.5% gross yield on what homes there cost.
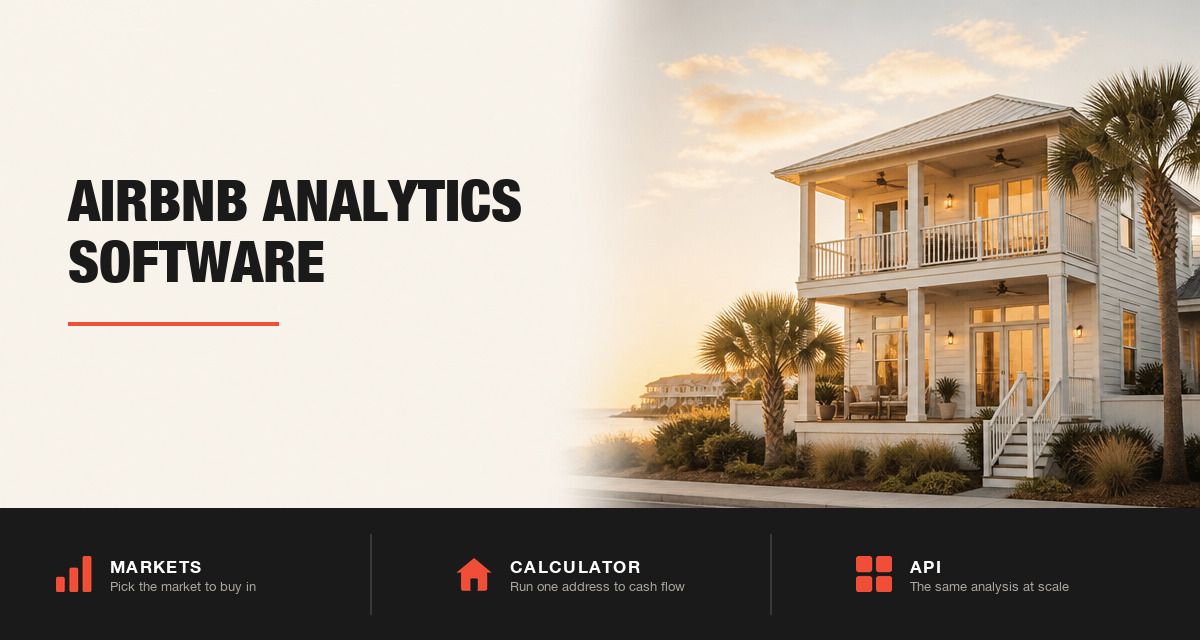
The other two jobs are checking whether one house there would make money if you bought it, and getting the same analysis into your own software once you've got more addresses than you can run by hand. BNBCalc has a tool for each one: BNBCalc Markets for the market, the BNBCalc Calculator for the house and the API for the bulk work, with the Calculator included in Markets. You move between them with an address rather than a button.
I'll take each job in turn, say what to look for in the software that does it, and follow one Myrtle Beach three-bedroom from the state ranking all the way to the API.
What to Look For in Airbnb Analytics Software
Each job asks a different question, so I'd judge any software job by job, on checks like these.
| Job | What to look for | Where BNBCalc does it |
|---|---|---|
| Pick a market | Revenue set against what homes cost | BNBCalc Markets ranks US markets by gross yield, annual revenue divided by estimated home value |
| Pick a market | Numbers for a named slice of listings | Revenue by bedroom count and by low, average and high performance tier |
| Pick a market | What each listing earned, and how many nights it was open | Each listing's actual and potential revenue, nights available and the days its host blocked |
| Analyze one property | Comps you can see and change | Up to 50 nearby listings in the Calculator, plus AI Underwriter, which you can run to keep about five and explain each pick |
| Analyze one property | Costs and a loan, through to cash flow | Line-by-line expenses and your mortgage terms, then cash flow, cap rate, cash-on-cash return and DSCR |
| Use your own systems | The same analysis, returned as data | The API takes an address and returns the analysis, its comps and a hosted report link |
| Use your own systems | A price you can plan around | $0.20 for each report it creates as of October 2026, and nothing for a request that fails |
Read the table one job at a time: the first three rows decide where to look, the next two decide whether one house works, and the last two only matter once you're checking addresses in bulk. If you're weighing BNBCalc against other tools, our comparison of the best Airbnb analytics tools puts them side by side.
How Do You Pick an Airbnb Market With BNBCalc Markets?
For the first job, I'd start in BNBCalc Markets, which covers about 2,400 markets in 157 countries and ranks US markets by gross yield, since revenue only tells you half the story until you set it against what the house costs.
You don't need an account for that part, because BNBCalc's South Carolina ranking is public. When I opened it on October 16, 2026, Myrtle Beach led the state's seven markets, with a typical listing grossing $51,353 over the 12 months to September 2026 against an average estimated home value of $209,448.
That's $51,353 ÷ $209,448, or a 24.5% gross yield, well ahead of North Myrtle Beach at 16.2%, and by my count it put Myrtle Beach 7th of the 454 US markets with a full year of BNBCalc data. By a typical listing, I mean the state page's default, which is all bedrooms at BNBCalc's average performance tier.
Still, a state rank only gets a market onto your shortlist. Next, you'll want numbers for the size of home you'd buy, and on the Markets plan, Myrtle Beach's market page splits them by bedroom count.
| Bedrooms (typical listing) | Annual revenue | Average estimated home value | Gross yield |
|---|---|---|---|
| 1 | $35,850 | $124,371 | 28.8% |
| 2 | $51,738 | $183,526 | 28.2% |
| 3 | $70,279 | $324,326 | 21.7% |
| 4+ | $93,264 | $463,571 | 20.1% |
Source: BNBCalc market data, Myrtle Beach, SC, average performance tier, 12 months to September 2026. Revenue includes cleaning fees.
Revenue climbs with every bedroom, but home values climb faster, so the yield falls from about 28% for one- and two-bedrooms to 21.7% for a three-bedroom. In other words, a three-bedroom earns less on its price than the 24.5% headline suggests, so it's the yield for the size you'd buy that counts.
From there, Markets maps every listing, and each one's page shows what it earned over the past 12 months, what it could've earned if it were bookable all year, its occupancy of the nights it was open and how many days its host blocked. Its Amenity revenue impact table estimates how much more listings with an amenity like a hot tub earn, comparing similar listings in the market. On top of that, Markets lets you save the listings you'd compete with as a comp set to share or export.
How Do You Analyze One Airbnb Property Before You Buy?
Once Myrtle Beach is on your shortlist, the second job is one specific house, which is what the BNBCalc Calculator does. Give it an address or a Zillow link with the bedrooms, bathrooms and guests, and it pulls up to 50 comparable listings nearby.
For a US property, you can also run its AI Underwriter, which reviews each one's photos, layout and amenities against yours, keeps about five of the closest, never more than eight, and tells you why it kept or left out each one.
Then it turns those comps into a year's revenue estimate, and its Seasonality card draws your monthly break-even as a dashed line, so you can plan the cash a slow stretch will need. Its Estimate with AI button proposes values for running costs like utilities, insurance and repairs, each with its source. Once you add your down payment, rate and term, it runs the deal through to cash flow, cap rate, cash-on-cash return and DSCR.
Before you run any address in Myrtle Beach, though, make sure the house sits in a zone that allows short-term rentals. When I read the City of Myrtle Beach's notice on rental zoning in October 2026, it said that inside city limits, any zoning district beginning with R, for residential, doesn't allow short-term rentals. The one exception is the RMV zone (Residential Multifamily Visitor), and the city adds that a home that isn't already in an allowed zone "cannot be converted to or approved for that use."
In practice, then, a market can top its state even when, by the city's own account, most traditional residential neighborhoods inside city limits aren't zoned for short-term rentals. That's why the zone comes first.
What Would a Typical Myrtle Beach 3-Bedroom Clear?
Say you find a three-bedroom, two-bath house in a zone that allows short-term rentals and buy it for $317,823, BNBCalc's median estimated value for a Myrtle Beach three-bedroom. I'll give it the typical three-bedroom's $70,279 in gross bookings and take out Airbnb's single service fee of 15.5%. Beyond that, everything is illustrative: cleaning at $400 a month on average, $11,280 a year in running costs, $3,000 in property tax and 25% down on a 30-year loan at the Calculator's default 6.00% rate.
I've grouped the lines the way the Calculator's Profit box does, with property tax in Mortgage & Taxes.
| Line | Year one | How it's figured |
|---|---|---|
| Gross bookings | $70,279 | BNBCalc typical 3-bedroom, 12 months to Sept 2026, cleaning included |
| Airbnb host fee | -$10,893 | 15.5% of gross bookings |
| Cleaning | -$4,800 | $400 a month on average (illustrative) |
| Running costs | -$11,280 | Utilities $4,200, repairs $3,000, insurance $2,400, supplies $1,200, software $480 (illustrative) |
| Operating income | $43,306 | Gross bookings minus the three lines above |
| Mortgage & Taxes | -$20,148 | $1,429 a month on $238,367 (75% of $317,823) at 6.00% for 30 years, plus $3,000 property tax (illustrative) |
| Cash flow | $23,158 | Operating income minus Mortgage & Taxes |
| Cash invested | $97,491 | $79,456 down, plus $9,535 closing (3%) and $8,500 furnishing, both at BNBCalc's defaults |
| Cash flow ÷ cash invested | 23.8% | $23,158 ÷ $97,491 |
Of the $70,279 guests pay, Airbnb's fee, the cleaner, the running costs, the property tax and the lender take $47,121, which leaves $23,158, or about $33 of every $100. On paper, year one looks strong.
Still, two of my inputs can move it a long way. The first is the rate: if you borrowed at the 7.40% average in Freddie Mac's survey for October 15, 2026, the loan payments would come to $19,800 a year and cash flow would fall to $20,506.
But the listing itself moves it much further. For example, a Myrtle Beach three-bedroom in BNBCalc's low performance tier grossed $29,386 over the same 12 months, and at that level, this house would lose $11,397 a year.
Because the tier moves the result that much, I'd let the Calculator build the revenue line from a real address's own comps, at its real asking price, instead of a market's typical figure. Keep in mind, too, that if you type these inputs into the Calculator, its cash-on-cash return adds a year of revenue growth, 3% by default. On this house, that puts it at about 25.9%, next to my 23.8%.
As for my $2,400 for insurance, it's only a placeholder, so swap in a real quote.
How Does an Airbnb Data API Fit In?
Running addresses one at a time works for a shortlist. But say you've got a list of 100 Myrtle Beach addresses to screen, or a product that needs a revenue estimate on every property page. That's the third job, and it's what the BNBCalc API is for.
For a purchase, you send it an address or coordinates with the price, bedrooms, bathrooms and guests, and it runs the analysis on the same engine as the Calculator. Then it hands the result back as data your software can read, including the nightly rate, occupancy, revenue with percentiles, expenses, cash flow, cap rate, cash-on-cash return, the comps behind the estimate and a link to the hosted BNBCalc report. There are separate versions for rental arbitrage, a home you already own and co-hosting, too.
As of October 2026, the API costs $0 a month plus $0.20 for each report it creates, and a failed request costs nothing. On top of that, each optional AI step that completes adds $0.10, whether that's AI comp selection or AI expense estimates. For those 100 addresses, that's $20, or $30 with AI comp selection on each.
Every request carries your API key in a header, and BNBCalc's API page says to keep that key server-side, out of any frontend code. The API takes up to 100 requests a second, while calls with an AI step are limited to 10 a minute per key. AI comp selection also only works on US addresses with at least eight listing photos.
Each call runs on BNBCalc's default assumptions, so presets you've saved in the app don't apply. And since it's an analysis API and BNBCalc doesn't search homes for sale, you bring the addresses.
How Do You Move Between Markets, the Calculator and the API?
All three run on one BNBCalc account. Markets and the Calculator also share one search box, so picking a city from it opens that market's page, while picking an address starts an analysis. There's no button that turns a Markets listing into an analysis, so to run the numbers on a home you've found, you type its address into that box.
Going the other way, an analysis's amenity card links to that market's amenity revenue data in Markets. As for the API, its analyses don't show up in your Properties list, so make sure to keep the hosted report link that comes back with each one.
So, What Should Airbnb Analytics Software Do?
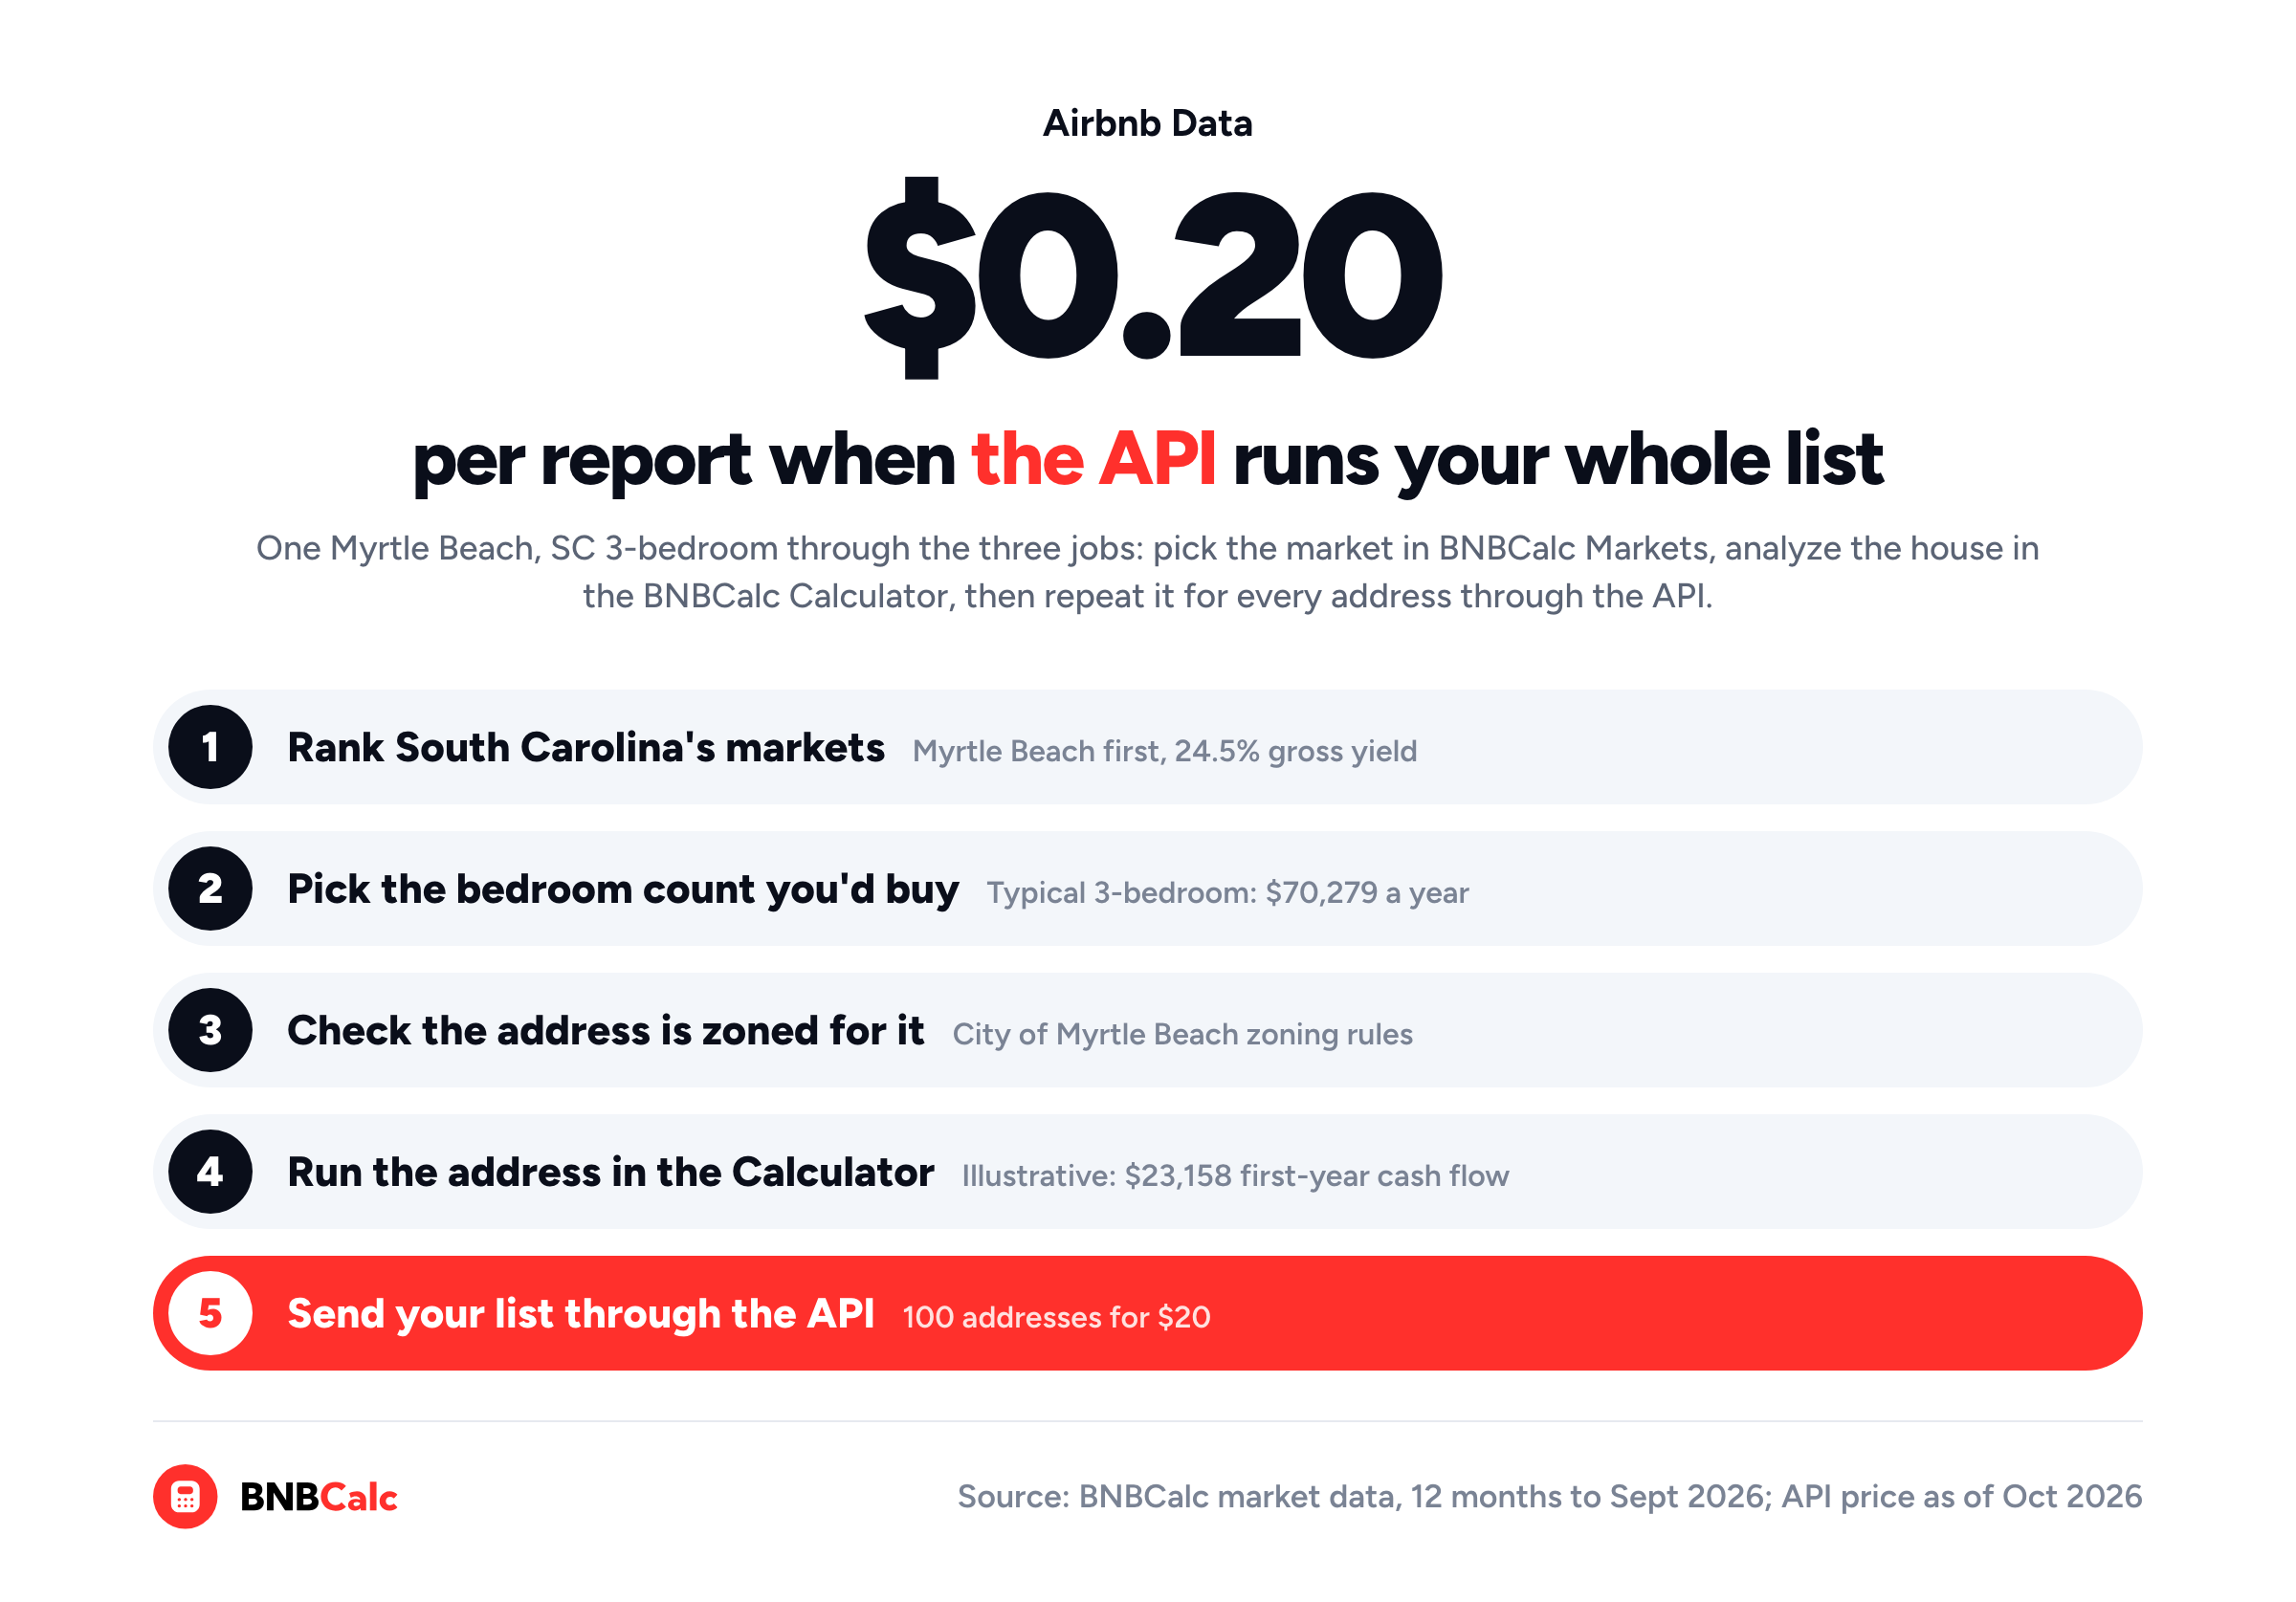
Good Airbnb analytics software should help you pick a market, test one house in it and then repeat that test at scale. For example, BNBCalc's data put Myrtle Beach first in South Carolina, with a 24.5% gross yield over the 12 months to September 2026, and there, a typical three-bedroom bought at the median value cleared $23,158 in my illustrative first year.
The order to work in, then, is to shortlist markets in BNBCalc Markets, check the zoning, run the address through the Calculator and bring in the API once you've got a list.
Whichever tool you use, the market is only the first filter. A ranking can tell you where to look, but it can't tell you which street you're allowed to rent on or what your own house will book, so the real decision still gets made one address at a time.
Frequently Asked Questions
What's the Best Tool for Airbnb Market Research?
BNBCalc Markets ranks US markets by gross yield, annual revenue divided by estimated home value, and splits every market by bedroom count and performance tier. Myrtle Beach's typical listing, for example, had a 24.5% gross yield over the 12 months to September 2026, first in South Carolina.
What Is Airbnb Market Intelligence?
Airbnb market intelligence is the research BNBCalc Markets is built for, so you can see where to buy and who you'd compete with. Markets ranks markets by gross yield, splits revenue by bedroom count and performance tier, shows what each listing earned and estimates how much more listings with an amenity earn. A typical Myrtle Beach three-bedroom, for example, grossed $70,279 over the 12 months to September 2026, against a median estimated value of $317,823.
Does BNBCalc Have an API for Airbnb Data?
Yes. The BNBCalc API turns an address, its price and its bedrooms, bathrooms and guests into a full analysis returned as data, from the nightly rate, occupancy and revenue to cash flow, cap rate, cash-on-cash return, the comparable listings and a hosted report link. As of October 2026, it costs $0 a month plus $0.20 per report it creates, with $0.10 more for each AI step that completes and no charge for a request that fails.
Can One Tool Do Both Airbnb Market Research and Property Analysis?
BNBCalc can, since BNBCalc Markets includes the full BNBCalc Calculator on one account. Markets ranks and breaks down the market, and when you want to check one home, you type its address into the search box Markets shares with the Calculator to open an analysis with its comps, costs, loan and returns. Markets is $79 a month or $399 a year as of October 2026.
Is There Free Airbnb Analytics Software?
BNBCalc lets you run two property analyses free, or start a 7-day free trial with full access. Without an account, its US market rankings are public, each market page shows its headline annual revenue and, in most markets, occupancy and nightly rate, and one market, Broken Bow, Oklahoma, is fully unlocked in BNBCalc Markets.
BNBCalc Markets Pricing and Free Trial
When you're ready to research markets and run the houses in them, BNBCalc Markets is $79 a month or $399 a year as of October 2026, and it includes the full BNBCalc Calculator. If you only need to check addresses, the Calculator on its own is $30 a month or $199 a year. You can compare the plans, run two property analyses free, or start a 7-day free trial with full access.
For your own software, the BNBCalc API is billed separately, at $0 a month plus $0.20 for each report it creates and $0.10 for each AI step that completes, as of October 2026.
Airbnb Tax Deduction Calculator
Paying too much in taxes? We have the perfect solution. Simulate an Airbnb home purchase below.
Purchase Price
$450K
Structure Value
70%
Apply Trump's Tax Cut (Bonus Depreciation)
Depreciation
$117,695
Interest
$21,600
Tax
$6,750
Year 1 Deduction
$146,045
Want to claim this deduction? Get a free cost segregation benefit analysis from CSA Partners — no obligation.
Get Full Analysis