
Free instant analysis
Reveal Airbnb revenue for any address or city
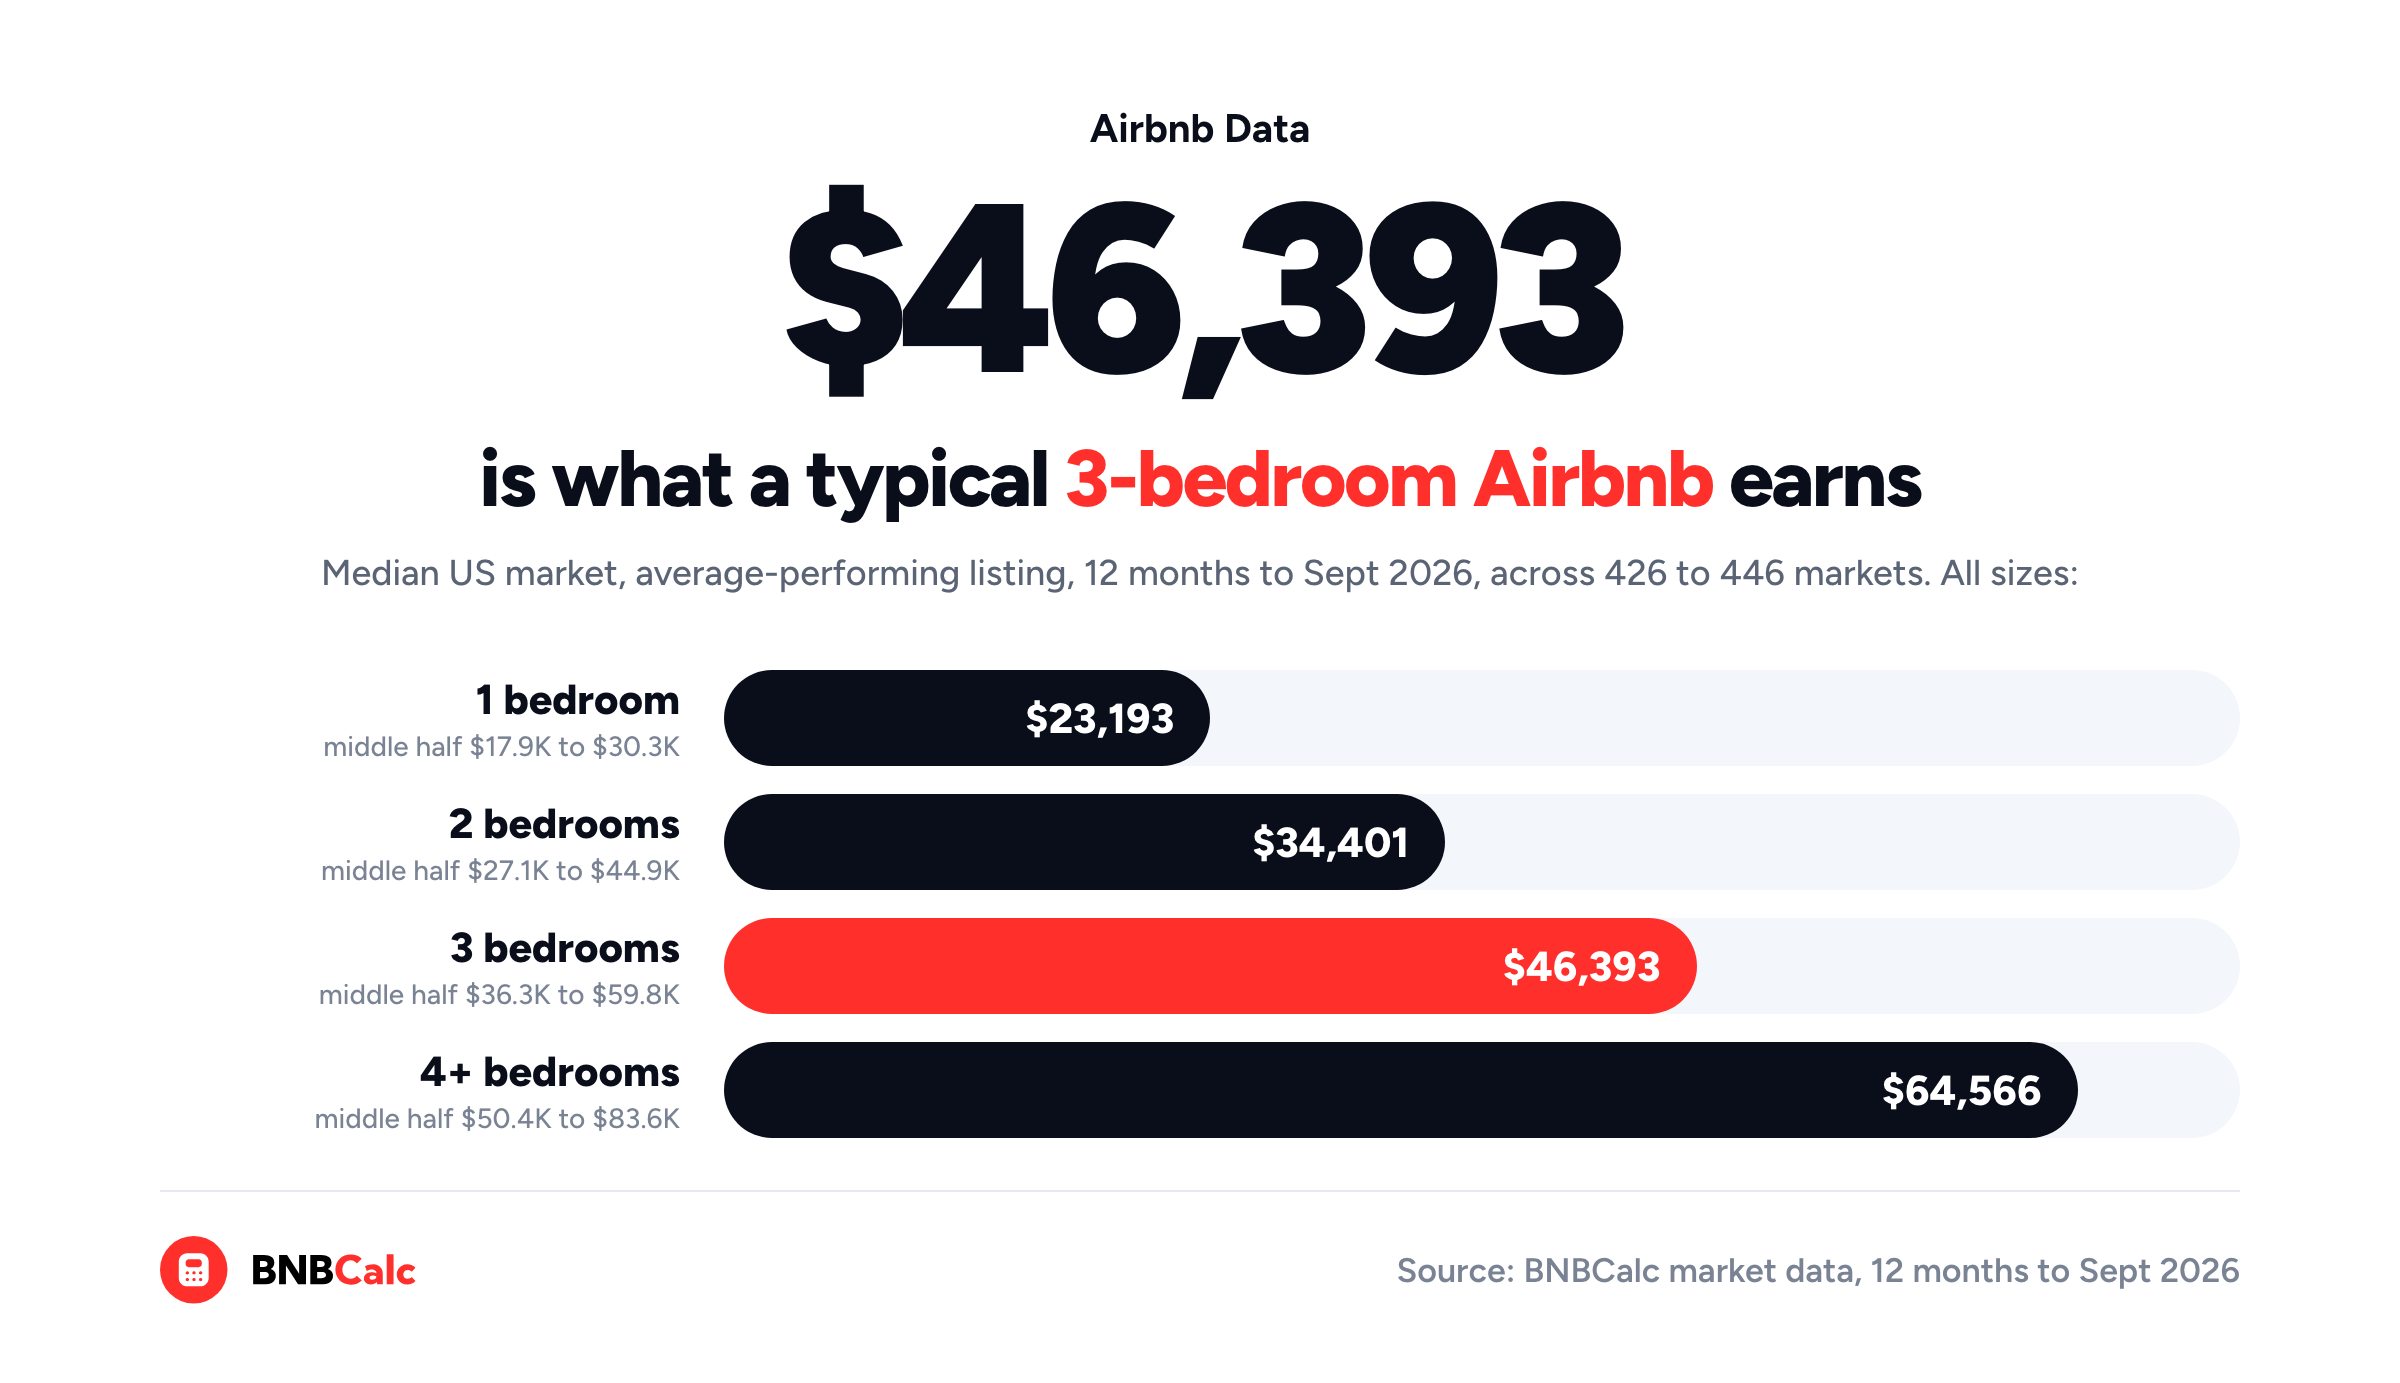
How much can you make on Airbnb, and how do you work it out for one specific house before you buy it? Well, over the 12 months to September 2026, the typical listing in the median US market BNBCalc tracks grossed $23,193 with one bedroom, $34,401 with two, $46,393 with three and $64,566 with four or more.
Those are gross bookings, though, and since they come before Airbnb's host fee, your cleaner, your running costs or your mortgage, none of them is what you'd keep.
So to find what one house would actually keep, you'll want to run its address through the BNBCalc Calculator. Below, I'll show you what it does with an address, and then I'll walk a typical Phoenix three-bedroom from $58,788 in gross bookings down to $7,470 of cash flow, once illustrative costs and a loan come out.
What Airbnbs Earn by Bedroom Count
Before we get to that Phoenix house, it helps to see how far those medians stretch, since across the 426 to 446 US markets with a full year of BNBCalc data, the middle half of markets spreads a long way either side of each one.
By typical listing, I mean BNBCalc's average-performing tier, which sits between its low performers and its top performers.
| Bedrooms | Median US market (typical listing) | Middle half of markets |
|---|---|---|
| 1 | $23,193 | $17,885 to $30,312 |
| 2 | $34,401 | $27,079 to $44,865 |
| 3 | $46,393 | $36,251 to $59,808 |
| 4+ | $64,566 | $50,409 to $83,574 |
However, those ranges overlap, so a three-bedroom in a stronger market can out-earn a four-bedroom in a weaker one, which is why I'd look at the overall state of a market first before the floor plan.
For example, let's take ten well-known US markets, where the typical three-bedroom listing earned anywhere from $35,489 in Houston to $107,814 in San Diego over the same 12 months.
| Market (typical listing) | 1 bedroom | 2 bedrooms | 3 bedrooms | 4+ bedrooms |
|---|---|---|---|---|
| Phoenix | $26,744 | $41,585 | $58,788 | $80,106 |
| Tampa | $29,081 | $45,661 | $60,418 | $83,586 |
| Houston | $17,820 | $27,351 | $35,489 | $52,112 |
| Dallas | $21,942 | $33,106 | $43,976 | $61,064 |
| San Diego | $52,661 | $81,080 | $107,814 | $150,805 |
| Nashville | $34,928 | $50,903 | $66,883 | $95,017 |
| Orlando | $21,725 | $32,655 | $50,692 | $65,519 |
| Austin | $29,234 | $43,281 | $57,197 | $83,328 |
| Las Vegas | $39,281 | $63,950 | $77,359 | $115,142 |
| Sevierville | $35,689 | $53,377 | $71,151 | $108,013 |
Each row is one market and each column a bedroom count, so reading across a row shows what an extra bedroom adds there. Reading down a column, meanwhile, shows how much the market itself matters: a typical three-bedroom in San Diego earned about three times what one in Houston did, and a two-bedroom in Las Vegas out-earned a typical three-bedroom in Phoenix or Austin.
Keep in mind that every figure here is gross bookings, though, meaning what guests paid for the nights they booked, cleaning fees included but not the guest's own service fee, before Airbnb's host fee or any of your costs come out.
If your market isn't on the list, BNBCalc Markets breaks revenue down by bedroom count, so you can look up the same figures for it.
How to Estimate a Property's Airbnb Income, Step by Step
Market figures get you into the right range, but for one property, you'll want to put its address or a Zillow link into the BNBCalc Calculator. First, it pulls up to 50 comparable listings nearby. Then, for a US property, its AI Underwriter reviews each one's photos, layout and amenities against yours, keeps the closest matches and tells you why it kept or left out each comp.
From the comps it keeps, it projects your year's revenue. Because it builds that estimate from the comps' full-year figures, their slow months come in with their busy ones.
After that, it estimates your operating expenses line by line and tells you where each number came from. It also takes Airbnb's host fee out as an expense, at a default rate you can change.
Once you add your purchase price, down payment, rate and term, it runs the whole deal through to cash flow, cap rate, cash-on-cash return and ROI.
Still, you should be able to check its work, so let's go through the estimate one step at a time, the way you'd do it by hand.
Step 1: Check That You Can Rent It Short Term
Make sure you can legally rent the house short term before you trust any revenue number, since a cap like San Francisco's 90 un-hosted nights a year limits what you can earn no matter what the comps say.
Step 2: Build Revenue From Comps That Match the House
Since the comps have to match the house on bedrooms, bathrooms, guest count and setting, the Calculator asks for the bedrooms, bathrooms and guests along with the address.
And if you don't agree with AI Underwriter's picks, you can tick its left-out comps back in, pick the set yourself or override the revenue figure.
Then build the year from what those comps booked, meaning the nights guests paid for at the prices they paid, since a price on a calendar only tells you what the host asked.
So which number should you plan on? Once you've optimized the report, with the comps you trust and the house's bedrooms, bathrooms and guests filled in, use its revenue estimate as your baseline and your sanity check. Treat it as a picture of what the property can earn, and then build on it with your own costs and your loan in the next steps.
Step 3: Take Out Airbnb's Host Fee
As of October 2026, Airbnb is moving every home host to its single service fee, which takes 15.5% of each booking straight out of most hosts' payouts.
The older split fee, where most hosts pay 3% and guests pay the rest, is being phased out, so 15.5% is the rate to plan on. It's also the Calculator's default.
Step 4: Subtract Cleaning and Running Costs
Start with cleaning. BNBCalc's revenue figures already include the cleaning fees guests pay, so don't add those again, but do count what you pay your cleaner.
After that come the running costs, like utilities, supplies, insurance and repairs, and the Calculator estimates each of those for you.
You'll enter the management fee and lodging tax yourself, though, so check whether Airbnb already collects your state's occupancy taxes from guests before you count them as a cost.
And don't forget to call your insurer before the first booking. The Insurance Information Institute said in March 2026 that standard homeowners insurance typically doesn't cover commercial activity, and that includes renting short term.
Step 5: Add the Loan and Read the Cash Flow
Finally, take your operating income, meaning what's left after the fee, cleaning and running costs, and subtract a year of loan payments and property tax, which the Calculator groups as Mortgage & Taxes. Whatever remains is your cash flow.
For the loan, plug in the rate, term and down payment from a real quote on the house you're buying, since the BNBCalc Calculator takes all three. In the Phoenix example below, I've assumed a 30-year fixed at 6.00% with 25% down.
Once you've got a cash flow number, the next step is judging whether the return is good enough. Before that, though, let's put all five steps together on one house.
How Much Does a 3-Bedroom Airbnb Make in Phoenix?
Say you buy a typical Phoenix three-bedroom at $428,576, BNBCalc's median estimated value for a three-bedroom there.
That price and its revenue over the 12 months to September 2026 come from BNBCalc's Phoenix market data, while the cleaning, the running costs, the property tax, the down payment, the loan term and the closing and furnishing costs are illustrative. I've also assumed the house is legal to rent short term all year, which you'd check against Phoenix's rules before a real purchase.
Keep in mind, though, that BNBCalc's three-bedroom listings in Phoenix vary a lot: low performers averaged $19,201 over the same 12 months, while top performers averaged $110,461.
That typical figure is a fair target for a well-run listing, so it's what I'd aim for as a bottom line if you plan to host well. For a real address, though, I'd still build the revenue line from that house's own comps in the Calculator. Even then, where your house lands depends on things no dataset can see, like your photos and how well you host.
The Inputs
| Input | Value | Source |
|---|---|---|
| Purchase price | $428,576 | BNBCalc median estimated value, Phoenix three-bedrooms |
| Gross bookings | $58,788 a year, cleaning included | BNBCalc market data, typical listing |
| Cleaning | $400 a month on average ($4,800 a year) | Illustrative |
| Airbnb host fee | 15.5% of gross bookings | Airbnb's service-fee help page, October 2026: most hosts on the single fee pay 15.5%. Applied to all gross bookings, cleaning included, as the Calculator does |
| Running costs | Utilities $350 a month, software $40 a month; supplies $1,200, insurance $2,400 and repairs $3,000 a year | Illustrative |
| Management and HOA | Self-managed, no HOA | Illustrative |
| Occupancy taxes | Collected from guests by Airbnb, so left out | Airbnb's Arizona tax page |
| Financing | 25% down; $321,432 loan, 30-year fixed at 6.00% | Down payment, term and rate illustrative; Freddie Mac's survey average was 7.40% as of October 15, 2026 |
| Property tax | $3,000 a year ($250 a month) | Illustrative; the Calculator counts it in Mortgage & Taxes, with the loan |
| Revenue growth | 3% a year | The Calculator's default Revenue Appreciation |
| Other cash in | 3% closing; $8,500 furnishing | Furnishing at the BNBCalc Calculator's defaults ($2,000 a bedroom, $250 a bathroom, $2,000 a living space); closing illustrative |
The Results
| Line | Year one | How it's figured |
|---|---|---|
| Gross bookings | $58,788 | BNBCalc typical listing, 12 months to Sept 2026, cleaning included |
| Airbnb host fee | -$9,112 | 15.5% of gross bookings |
| Cleaning cost | -$4,800 | $400 a month on average (illustrative) |
| Running costs | -$11,280 | Utilities $4,200, supplies $1,200, insurance $2,400, repairs $3,000, software $480 (illustrative) |
| Operating income | $33,596 | Gross bookings minus the three lines above |
| Mortgage & Taxes | -$26,126 | $23,126 of loan payments ($1,927.15 a month on $321,432, 75% of the $428,576 median 3-bedroom value, at 6.00% for 30 years) + $3,000 property tax (illustrative) |
| Cash flow | $7,470 | Operating income minus Mortgage & Taxes |
| Cash invested | $128,501 | 25% down + 3% closing + $8,500 furnishing |
| Cash-on-cash return | 7.2% | (Cash flow + $1,764 of revenue growth) ÷ cash invested |
| Cap rate | 7.8% | Operating income ÷ purchase price |
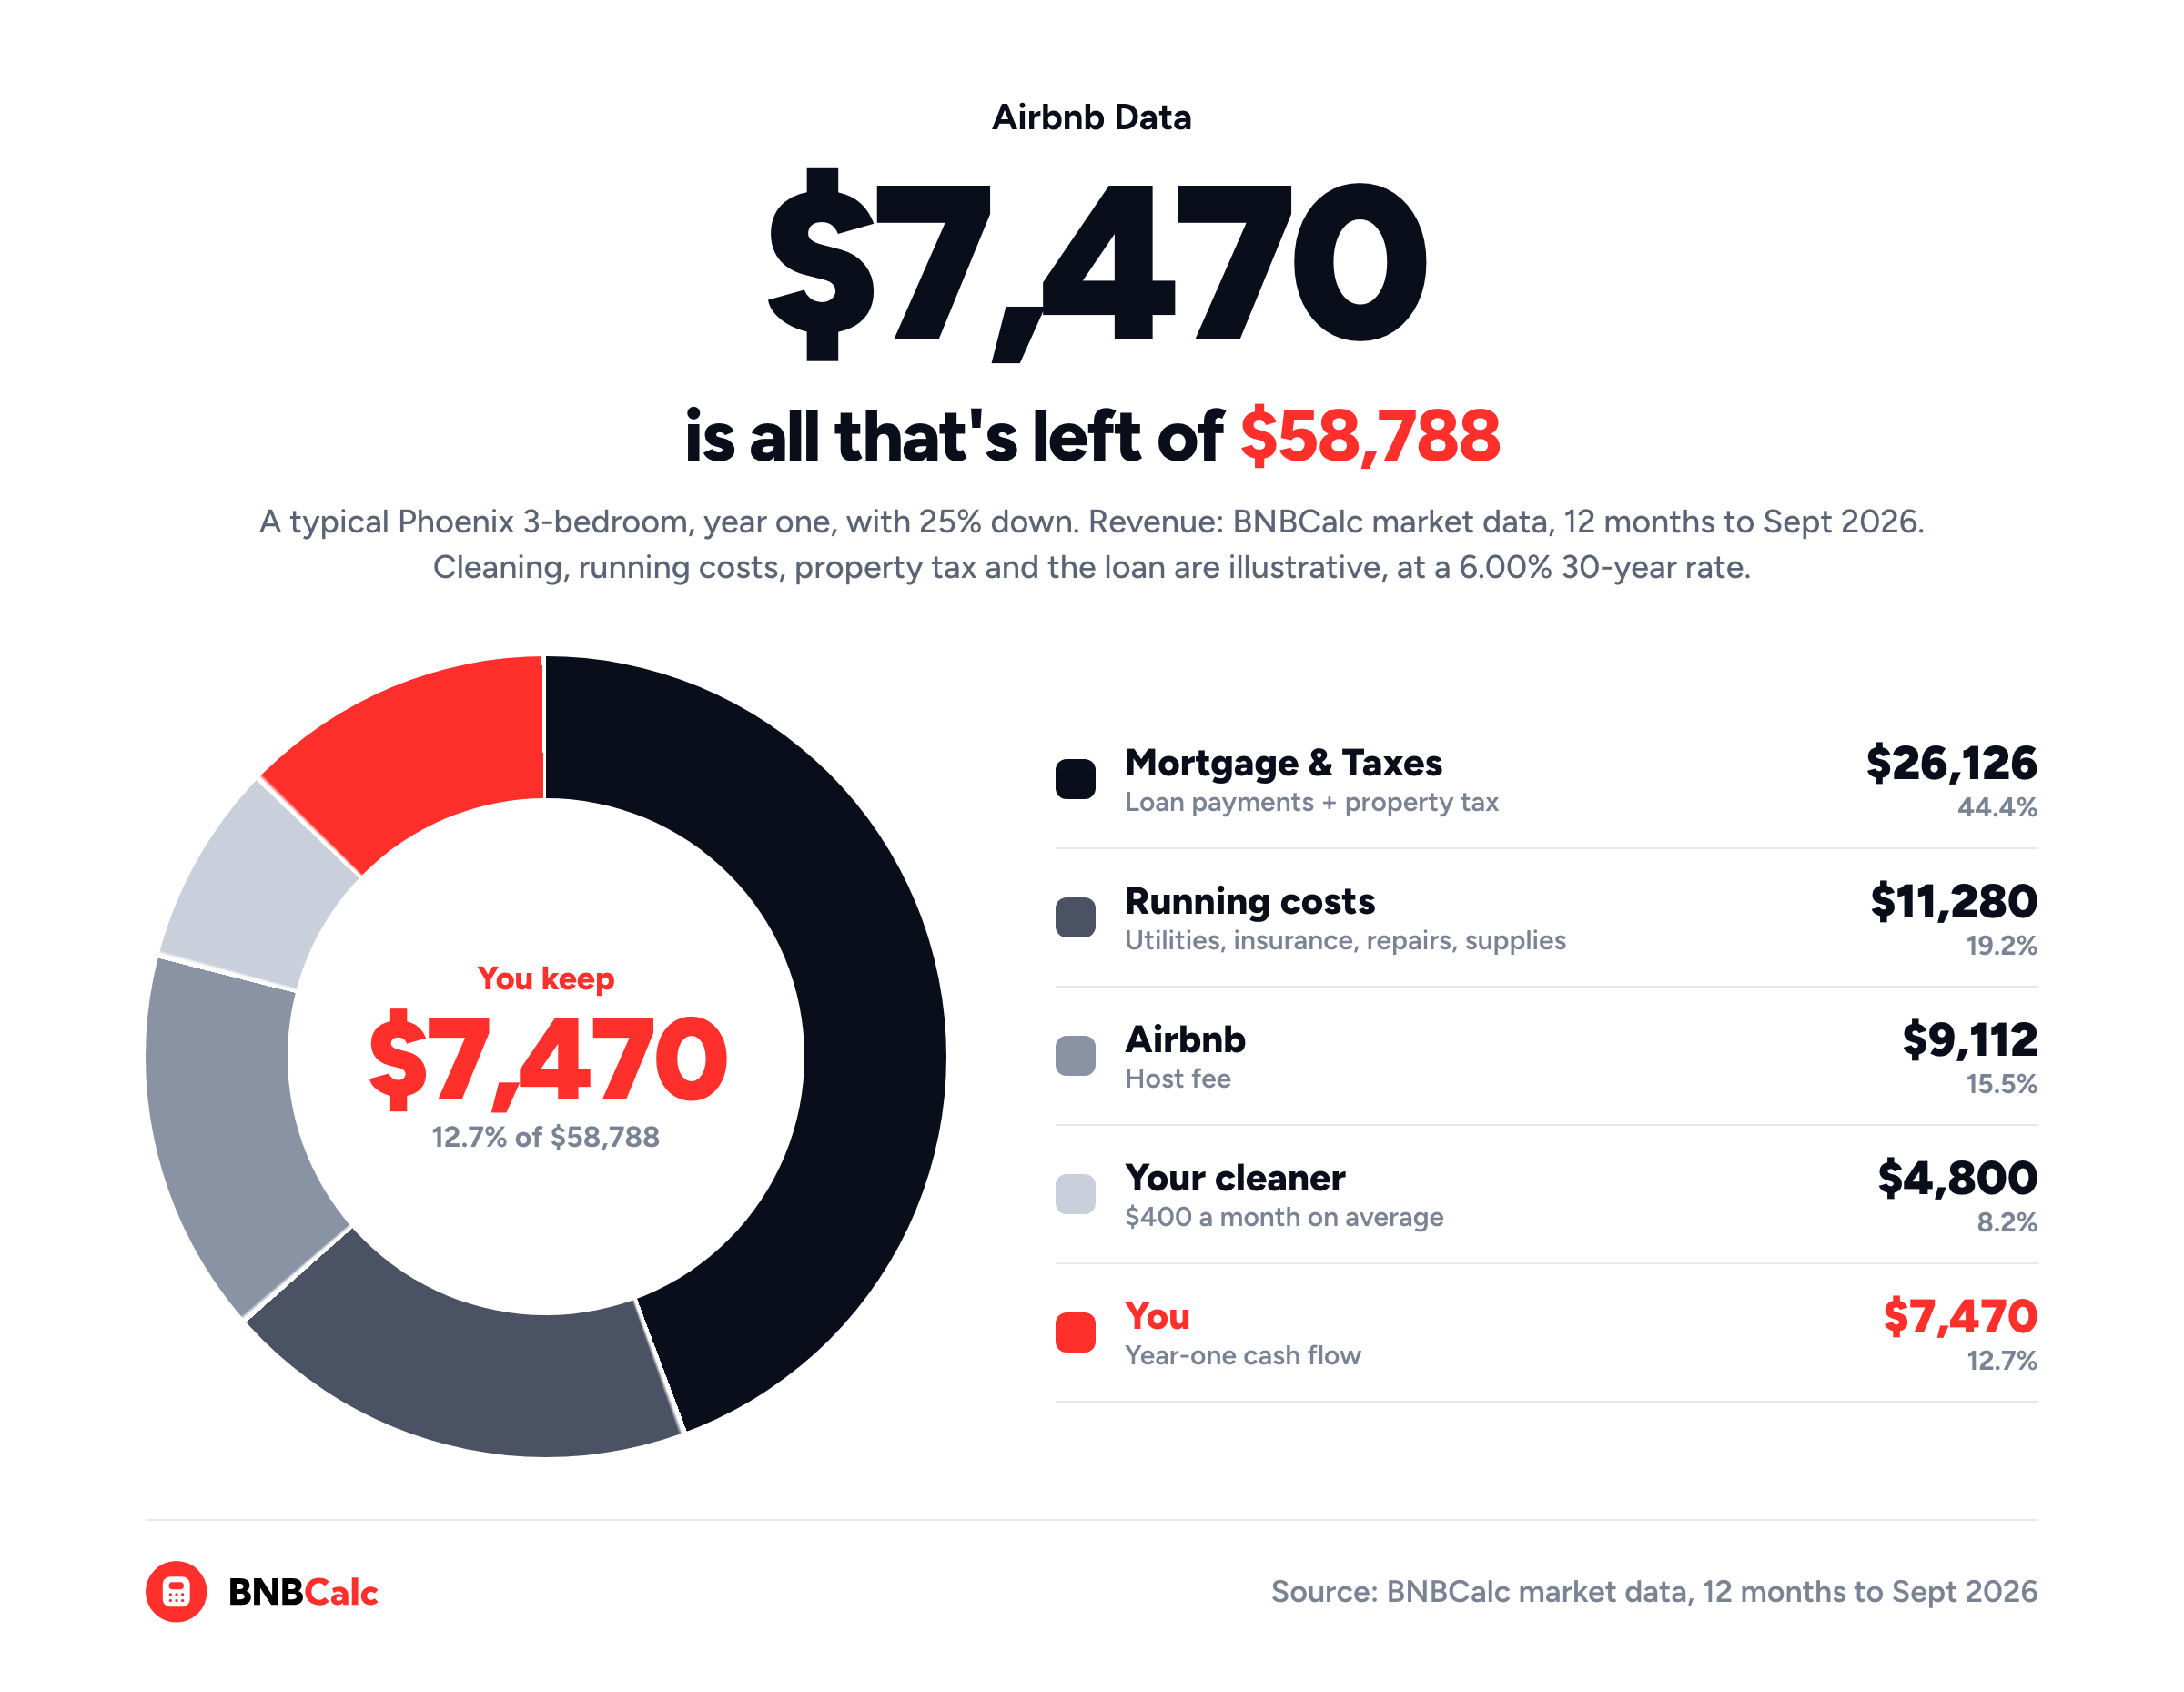
So where does the money go? Out of $58,788 in gross bookings, Airbnb's fee takes $9,112 and the cleaner takes $4,800, and then the running costs take $11,280 and the loan and property tax take $26,126.
That leaves $7,470 of cash flow, which is all you keep once everyone else has been paid, or about $12.71 of every $100 guests pay.
On $128,501 of cash invested, that's a 7.2% cash-on-cash return, because the Calculator adds a year of revenue growth to the cash flow before it divides. At its default Revenue Appreciation of 3%, that's $1,764, so ($7,470 + $1,764) ÷ $128,501 = 7.2%. If you set Revenue Appreciation to 0%, it's cash flow ÷ cash invested alone, or 5.8%.
The cap rate looks healthier at 7.8%, but it leaves the loan out, so don't judge a financed deal on cap rate alone. Its operating income also comes before property tax, which the Calculator keeps in Mortgage & Taxes. The math behind both is in this guide to cash-on-cash and cap rate.
So how do you get more out of a house like this? Most of the upside sits in how well the listing performs. Phoenix's top-performing three-bedrooms averaged $110,461 over the same 12 months, nearly twice the typical figure, and even a listing that earns 10% more than typical would add about $4,488 to the year's cash flow.
Amenities are one of the clearest places to find that extra 10%. For Phoenix three-bedrooms, BNBCalc Markets' Amenity revenue impact estimates that, compared with similar listings, those with a pool earn about 22% more and those with a hot tub about 12% more. That's the table's three-bedroom view, which you pick from its bedroom menu with a Markets plan; logged out, it opens on all bedroom counts. Pools are common there, since about seven in ten three-bedrooms have one, while fewer than one in five offer a hot tub, so a hot tub still sets a listing apart.
BNBCalc Markets shows the same estimates for every market, so you can see what guests pay more for before you buy, then run the house through the BNBCalc Calculator to see what it does to your cash flow.
So, How Much Can You Make on Airbnb?
Across the US markets BNBCalc tracks, a typical listing in the median market grossed anywhere from $23,193 with one bedroom to $64,566 with four or more over the 12 months to September 2026. And as the tables above show, the market you buy in can matter as much as the bedroom count.
What you keep is a different question, though. As the Phoenix house shows, it can be a thin slice of the gross once Airbnb's fee, cleaning, running costs, property tax and a loan come out. That's why the number worth planning on is the one built from your own address: run the house through the BNBCalc Calculator, adjust the comps and costs until the report reflects the property, and use it as the baseline you build on.
Wherever your estimate comes from, it's only as good as the one line nobody bothered to check. So the number I'd trust is one you could walk through, line by line, with someone who's hoping to find a mistake.
Frequently Asked Questions
How Much Could I Make Renting My House on Airbnb?
If you enter your address in the BNBCalc Calculator, it'll use comparable listings nearby to project what your house would earn, then take out your expenses and any loan to show your cash flow. Make sure to look past the revenue, though, because BNBCalc's typical Phoenix three-bedroom grossed $58,788 over the 12 months to September 2026, but only $7,470 of that was left once Airbnb's fee, illustrative costs and a loan came out.
How Much Does a Typical Airbnb Make per Year in the US?
BNBCalc's data shows the typical listing in the median US market grossed $23,193 with one bedroom, $34,401 with two, $46,393 with three and $64,566 with four or more over the 12 months to September 2026, before Airbnb's host fee and your costs. Look up your own market in BNBCalc Markets, though, since the typical three-bedroom ran from $36,251 to $59,808 across the middle half of US markets with a full year of data.
What's the Best Way to Estimate Airbnb Income Before Buying a House?
Run the house's address through the BNBCalc Calculator once you've made sure the city allows short-term rentals there. It pulls up to 50 comparable listings nearby, lets its AI Underwriter keep the closest matches and explain why, then projects a year of revenue with the slow months counted in. After that, it estimates running costs line by line and factors in your purchase price and loan to get you to cash flow and cash-on-cash return.
Does BNBCalc's Airbnb Revenue Data Include Cleaning Fees?
Yes. BNBCalc's annual revenue figures include cleaning fees, and so do the nightly rates (ADR) you'll see in BNBCalc Markets, because cleaning is folded into the booked price in the data behind them. So don't add cleaning revenue on top. Those figures come before Airbnb's host fee and what you pay your cleaner, though, and the BNBCalc Calculator takes both out as expenses, estimating cleaning with your other running costs and applying Airbnb's fee at a default rate you can change.
BNBCalc Calculator Pricing and Free Analyses
When you've got an address of your own to check, the Calculator costs $30 a month or $199 a year as of October 2026.
If you'd like to try it first, you can run two property analyses free, or start a 7-day free trial with full access.
On the other hand, if you don't know where to invest yet, use BNBCalc Markets to compare US markets by gross yield and see what the individual listings in each one actually earned.
Airbnb Tax Deduction Calculator
Paying too much in taxes? We have the perfect solution. Simulate an Airbnb home purchase below.
Purchase Price
$450K
Structure Value
70%
Apply Trump's Tax Cut (Bonus Depreciation)
Depreciation
$117,695
Interest
$21,600
Tax
$6,750
Year 1 Deduction
$146,045
Want to claim this deduction? Get a free cost segregation benefit analysis from CSA Partners — no obligation.
Get Full Analysis