

Free instant analysis
Reveal Airbnb revenue for any address or city
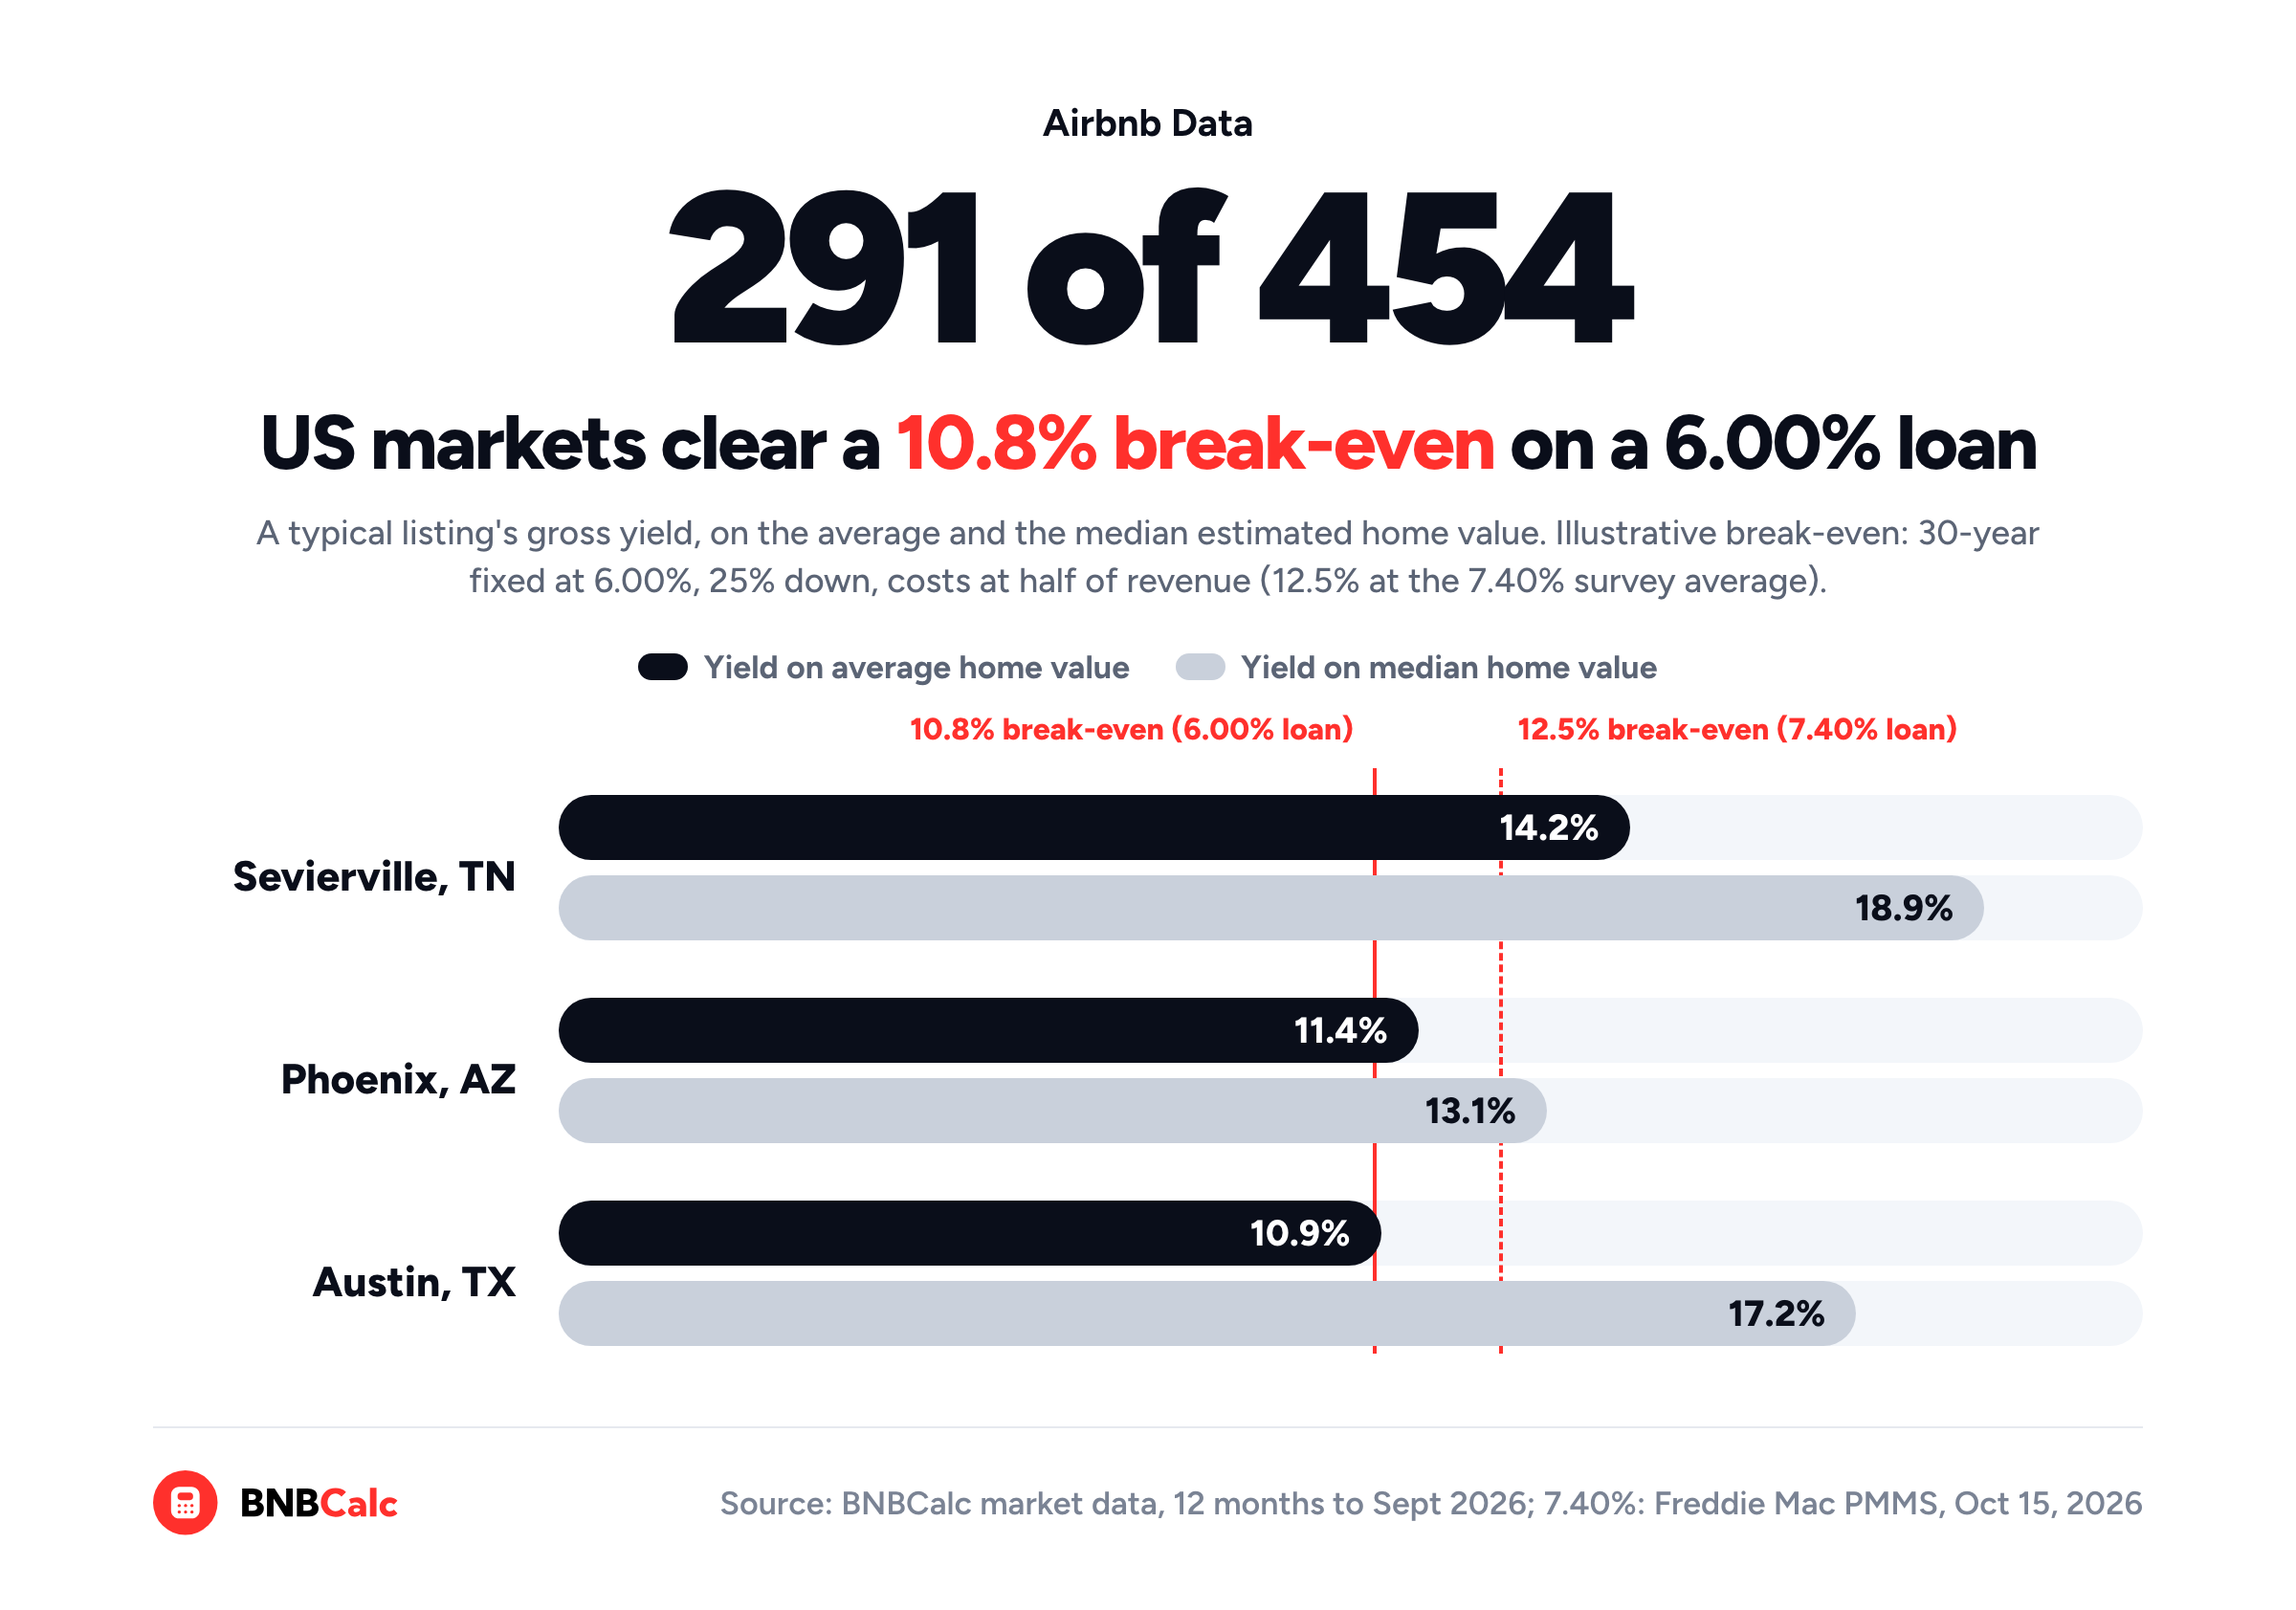
How do you find the best Airbnb markets to invest in? Well, I'd start with a shortlist ranked by gross yield, a typical listing's annual revenue divided by what homes there cost, and then hold each market to a break-even. Over the 12 months to September 2026, a typical listing cleared an illustrative break-even yield of about 10.8% in 291 of the 454 US markets with a full year of BNBCalc data. That bar assumes a 30-year fixed loan at 6.00%, 25% down and running costs at half of revenue.
But yield isn't the only way a market can fail, because New York City, San Francisco and Los Angeles won't let an investor who lives elsewhere rent out a whole home by the night.
The way I do it is to build that shortlist in BNBCalc Markets, then run it through six screens in order: the law, gross yield, demand and seasonality, supply, financing and insurance, and the property itself. Along the way, I'll put Sevierville, Phoenix and Austin through the numbers.
Where to Find the Best Airbnb Markets by Gross Yield
BNBCalc Markets ranks markets for you, sorting US markets by gross yield and markets in the rest of BNBCalc's 157 countries by annual revenue, since BNBCalc's home values only cover US markets for now. That means outside the US, you'll have to run Screen 2 on asking prices yourself.
In the US, you don't even need an account to see the rankings, because BNBCalc's public market rankings sort all 487 US markets by gross yield, state by state. Of those, I counted the 454 with a full year of data. By a typical listing, I mean what each state page shows by default: all bedrooms at the average performance tier.
Still, a rank only gets a market onto your shortlist, not into your portfolio. That's why BNBCalc's own ranking page says to use the rankings "to narrow a search area," then review regulations, seasonality, financing and the rest, which is what the six screens do.
Screen 1: Can You Legally Rent Out a Whole Home There?
What a ranking can't tell you is whether you're allowed to operate there, so check that first, before you spend hours on a city's numbers only to find out you can't rent. BNBCalc's regulation guides by city are the quickest place to start, since each one spells out who can host and where.
The test I use is whether an owner who doesn't live there can legally run a whole-home rental in the zone you'd buy in. If the host has to live there or be home during the stay, or the zone bans it, the market's out.
Unfortunately, if you were hoping to rent out a Manhattan condo by the night, New York City fails that test, and so do San Francisco and Los Angeles. When I checked their own pages in October 2026, each city drew the line a little differently.
| City | Who can host a short stay | Official source |
|---|---|---|
| New York City | A permanent occupant living in the same unit as the guests; no renting out an entire apartment or home for fewer than 30 days | NYC Special Enforcement |
| San Francisco | The permanent resident of the unit, who spends at least 275 nights a calendar year there | SF Planning FAQ |
| Los Angeles | A registered host, only in their primary residence (where they live more than six months of the year); rent-stabilized units aren't eligible | LA City Planning |
Each row gives one city's rule and the official page it comes from. What stands out is that all three tie hosting to the home the host lives in, and that's exactly what rules them out for an investor.
Rules like these can also differ from one zone to the next, so make sure you read the ones for the zone you'd buy in, on the city's own page, before you make an offer.
Screen 2: Does Revenue Stack Up Against What Homes Cost?
BNBCalc Markets runs this screen's first pass for you, because its US rankings sort by gross yield, a typical listing's annual revenue divided by the market's average estimated home value. For example, a typical Austin listing brought in $51,522 over the 12 months to September 2026, against an average estimated home value of $473,062. That's a 10.9% gross yield, which ranks Austin 22nd of the 27 markets on BNBCalc's Texas page as of October 2026.
What Gross Yield Do You Need to Break Even?
Since gross yield leaves out both your running costs and your loan, I hold it to a break-even yield, the gross yield where a property's revenue just covers its operating costs and its mortgage.
Say, for illustration, you put 25% down on a 30-year fixed loan at the Calculator's default 6.00% rate, and your operating costs take half of your revenue. A year of mortgage payments then comes to about 5.4% of the price, and since costs eat half of whatever comes in, revenue has to cover the mortgage twice over: 5.4% × 2, or roughly 10.8% of the price.
That 10.8% is the bar I held all 454 markets to. Austin only just clears it, by 0.10 points.
Should You Divide by the Average or the Median Home Value?
Before you settle on Austin's 10.9%, look at the price behind it.
Austin's median estimated home value was $299,965, a long way under the $473,062 average, so if you divide the same $51,522 by the median instead, the yield jumps to 17.2%. That only holds if a home at the median price can earn what a typical listing does, which is what the comps in Screen 6 will tell you.
And Austin isn't the only one.
Across the 454 markets, the median gap between the two yields was 1.6 points, which is enough to move some markets across the bar. On the 6.00% example, 340 markets clear it on the median value, against 291 on the average.
Which number's right, then? For comparing markets, BNBCalc's yield on the average value puts every market on the same footing, but for a deal, the price that matters is what the specific house you'd buy costs.
That's why I'd treat a ranked yield as a reason to take a closer look, and then redo the math on asking prices for the kind of home you'd buy.
Screen 3: What Brings Guests, and Do They Come All Year?
A yield that clears the bar is still a yearly number, and the money doesn't always come in evenly. On a BNBCalc Markets plan, each market's page shows how its demand moves through the year, along with its lead time, the average number of days between booking and check-in.
Over the 12 months to September 2026, for example, guests at a typical Sevierville listing booked about 46 days ahead, against 38 in Phoenix and 31 in Austin, so a Sevierville host gets the most notice of the three.
To judge the shape of the year yourself, I'd measure the share of revenue that lands in a market's strongest four months, whichever four those are where you're buying. In a perfectly even year, that's 4 ÷ 12, or a third. The further above a third it runs, the less the other eight months bring in, even though they still carry eight of your twelve mortgage payments.
In other words, a market only passes if its slow months can pay their own bills, or if you've set aside cash to cover the gap.
It also helps to count how many reasons people have to visit, because one attraction usually means one season, whereas a hospital, a university or steady business travel gives you more ways to fill a weeknight in the slow months.
Screen 4: How Many Listings Would You Compete With?
Demand is only half of it, since every new listing splits that demand a little further.
With a Markets plan, the Supply column in the Performance metrics by bedroom table shows how many listings of your size are active in a market now, and the Occupancy rate card shows how much of their open nights they booked over the last 12 months. Note both for the size you'd buy, then recheck them every few months. If supply keeps climbing while occupancy slips, the same guests are being spread across more homes, and yours would end up with a smaller share of the bookings.
Screen 5: Can the Yield Cover Your Loan and Insurance?
Once a market gets through those first four screens, put the rate, term and down payment from a real investment-property quote into the BNBCalc Calculator, because the break-even from Screen 2 rests on the Calculator's default 6.00% rate, not your own quote. For comparison, Freddie Mac's 30-year fixed-rate mortgage averaged 7.40% as of October 15, 2026, and at that rate the same break-even works out to about 12.5%, which 209 of the 454 markets cleared.
Keep in mind that Freddie Mac's survey is built around home purchase loans on owner-occupied single-family homes, which is why your own investment-property quote matters.
Will a lender even count the rental income? Not always.
If the loan follows Fannie Mae's Selling Guide, short-term rental income only counts on a one-unit investment property that's "legally permitted to operate as a short-term rental."
The law check from Screen 1 matters twice, then, once to the city and once to the lender.
Insurance costs vary by location too, so don't forget to get a short-term rental insurance quote for the ZIP code you'd buy in before a market makes your final list.
Which Is the Better Airbnb Market: Sevierville, Phoenix or Austin?
Now, if you run Sevierville, Phoenix and Austin through the two screens that come down to pure numbers, yield and financing, all three clear the 6.00% bar on the average value, but by very different margins. In practice, Screen 1 still comes first, so make sure to read BNBCalc's guide to Austin's short-term rental rules and its Phoenix guide before any of this.
| BNBCalc market data, 12 months to Sept 2026 | Sevierville, TN | Phoenix, AZ | Austin, TX |
|---|---|---|---|
| Typical listing's annual revenue | $68,351 | $55,972 | $51,522 |
| Average estimated home value | $479,902 | $491,774 | $473,062 |
| Median estimated home value | $361,458 | $428,576 | $299,965 |
| Gross yield on the average value | 14.2% | 11.4% | 10.9% |
| Gross yield on the median value | 18.9% | 13.1% | 17.2% |
| Cushion over the break-even at 6.00% (about 10.8%) | +3.45 points | +0.59 points | +0.10 points |
| Cushion at the 7.40% survey average (about 12.5%) | +1.78 points | -1.08 points | -1.57 points |
Each column is one market, and the last two rows show how far its yield on the average value clears each break-even, on the same illustrative loan and costs. The cushions use unrounded figures, so subtracting the rounded ones yourself can be off by up to 0.08 points.
Sevierville is the easy one. It clears the 6.00% bar by 3.45 points and would clear even at the 7.40% survey average, but the house you buy can still come in under the market's typical yield.
Phoenix and Austin clear too, but only thinly: Phoenix by 0.59 points and Austin by 0.10. At the 7.40% survey average, both would miss, and even at 6.00%, a house that earns less than a typical listing could miss.
Screen 6: Does the Specific Property Work?
The last screen is one house, and that's the job of the BNBCalc Calculator. Once you put in the address, it pulls up to 50 comparable listings nearby and bases its revenue estimate on them, and for a US property, you can run its AI Underwriter to keep the most similar ones and tell you why it picked each one. After that, it projects a year of revenue, estimates your running costs line by line, and takes your price and loan through to cash flow and cash-on-cash return.
Of the three markets, Sevierville's the one I'd run first once its local rules check out, while Phoenix and Austin need a house whose comps earn at least what a typical listing does.
So, How Do You Find the Best Airbnb Markets?
Start with BNBCalc Markets, which ranks US markets by gross yield, and hold every market on your shortlist to a break-even. On the 6.00% loan used here, the Calculator's default, 291 of the 454 US markets with a full year of BNBCalc data cleared a break-even of about 10.8%, and that's before you've checked the law, the seasons, supply or a real loan quote. Then, for whatever survives, run a specific house through the BNBCalc Calculator.
Most of the work in picking a market is ruling markets out, so don't be discouraged when most of your list drops away. Every market you cross off for a reason you can name is money that didn't go into the wrong place.
Frequently Asked Questions
How Do Short-Term Rental Investors Decide Which City to Buy In?
Start with a ranking from BNBCalc Markets, which sorts US markets by gross yield and markets elsewhere by annual revenue, and then rule cities out one screen at a time. Check that an owner who lives elsewhere can legally rent out the whole home, redo the yield on your own purchase price, and weigh seasonality, supply and financing. Once a city survives, the BNBCalc Calculator handles the specific house, from comps to cash flow.
What Metrics Should I Use to Compare Airbnb Markets Before Buying?
Use the ones BNBCalc Markets tracks for each market: annual revenue, occupancy, ADR, RevPAR and lead time, plus gross yield in US markets, which is annual revenue divided by estimated home value. Markets also splits revenue by bedroom count, so you can compare markets on the size of home you'd buy. Check how each one's defined, too. BNBCalc counts occupancy against bookable nights, for example, so nights the host blocked don't drag it down.
What Are the Best Areas to Invest in Airbnb Right Now?
Start with the ones near the top of BNBCalc's US market rankings, which sort 487 markets by gross yield within each state. As of October 2026, Sevierville ranks second in Tennessee, with a typical listing yielding 14.2% on the average estimated home value. A high rank is a reason to shortlist a market, not to buy there, so check the local rules and your own purchase price before you make an offer.
What Is a Good Gross Yield for an Airbnb Market?
One that clears your break-even, and BNBCalc's data shows nearly two-thirds of US markets do. A typical listing cleared a break-even of about 10.8% in 291 of the 454 markets with a full year of data to September 2026, while the median market sat at 12.1%. That 10.8% is illustrative, built on a 6.00% rate, 25% down and costs at half of revenue, so test a property on your own loan terms in the BNBCalc Calculator.
Should You Avoid Cities With Airbnb Regulations?
Not automatically. BNBCalc's regulation guides spell out each city's rules, and what matters is the kind of rule they describe. A registration or permit requirement is usually paperwork you can plan for, while a primary-residence rule, a host-present rule or a ban shuts out an investor-owned whole-home rental. If a city passes, see where it ranks in BNBCalc Markets, then confirm the rules on the city's own page before you make an offer.
BNBCalc Markets Pricing and Free Trial
When you're ready to run your own shortlist through the screens, BNBCalc Markets is $79 a month or $399 a year as of October 2026, and it includes the full BNBCalc Calculator. If you'd like to try it first, you can run two property analyses free, or start a 7-day free trial with full access.
Airbnb Tax Deduction Calculator
Paying too much in taxes? We have the perfect solution. Simulate an Airbnb home purchase below.
Purchase Price
$450K
Structure Value
70%
Apply Trump's Tax Cut (Bonus Depreciation)
Depreciation
$117,695
Interest
$21,600
Tax
$6,750
Year 1 Deduction
$146,045
Want to claim this deduction? Get a free cost segregation benefit analysis from CSA Partners — no obligation.
Get Full Analysis