
Free instant analysis
Reveal Airbnb revenue for any address or city
What's the best Airbnb analytics tool in 2026? Well, if you're investing, I'd pick BNBCalc, because it's where you can research a market, see what each listing in it earned and then run one house through to cash flow. For example, BNBCalc's data shows typical three-bedrooms in Phoenix, Arizona grossed $58,788 over the 12 months to September 2026, while top performers averaged $110,461.
AirDNA, Rabbu, Mashvisor, PriceLabs, AllTheRooms and KeyData all come up in the same searches, so I'll give you what each one covers, what's free and what it costs in the US as of October 2026, all from its own pages.
First, though, let's pin down the job itself, because that decides which tool is worth paying for.
What Should an Airbnb Analytics Tool Do?
Whether it's your first rental or your tenth, the research runs in the same order. You pick a market by what its listings earn against what homes there cost, then look at the listings themselves, since a market average hides how far apart the best and worst ones sit. From those, you pick out the handful you'd compete with.
Then comes one address. You'll want to know what similar listings nearby say it could earn, what it'll cost to run and what's left once the loan is paid.
So when I compare tools, I check how much of that sequence each one covers, and whether I can see the listings and comps behind its numbers rather than a single figure I have to take on trust.
BNBCalc splits that job across two products on one account. BNBCalc Markets covers the market, its listings and your comp set, the BNBCalc Calculator covers the rest, and a Markets plan includes the Calculator. I walked one house through both in this guide to Airbnb analytics software, so this time I'll stick to how the tools compare.
Best Airbnb Analytics Tools Compared: Free Options, Prices and Coverage
| Tool | What it covers | Free option | Cheapest US price (Oct 2026) | Coverage, in its own words |
|---|---|---|---|---|
| BNBCalc | Market rankings by gross yield, each listing's revenue, comp sets, amenity revenue impact, about three years of market history, a property analysis through cash flow, and an API | Two property analyses, a 7-day free trial, public US rankings and one fully open market | Calculator $30/mo or $199/yr; Markets $79/mo or $399/yr, Calculator included | 2,300+ markets in 157 countries; listings from Airbnb, Vrbo and Booking.com |
| AirDNA | Rentalizer address estimates, market data and dynamic pricing | Free plan with a limited Rentalizer and market insights | Market Research $125/mo, or $400/yr | Global markets on Airbnb, Vrbo and Booking.com |
| Rabbu | Address revenue estimate and underwriting calculator, city market pages and a market finder | Everything; no subscription is listed | None listed | Any address in the United States |
| Mashvisor | Airbnb and long-term rental analysis with financing, plus property and market search | Calculator page says free; no 7-day free trial on Find & Invest | Lite $49.99/mo billed quarterly, or $479.88/yr | 95% of US markets, plus popular international markets |
| PriceLabs | Radius-based Market Dashboards, beside its dynamic pricing | Free Revenue Estimator | Market Dashboards from $9.99/mo | 150+ countries; Airbnb and Vrbo |
| AllTheRooms | Analytics and competitor tracking, priced per market | 3 months of history in a sample market | Basic $19/mo per market, or from $11/mo billed annually | Per market, from a postal code to a region, plus state, country and global plans |
| KeyData | Benchmarks for property managers and tourism groups from PMS reservation data | A custom market report, reviewed with its team | No public price; sold through a demo | 30+ countries; 80+ PMS integrations |
The price column shows the cheapest paid plan, as each tool's own US page listed it in October 2026. Prices in this category change often, so make sure to recheck a page before you sign up. As for coverage, each tool counts markets its own way, so that column tells you where a tool works rather than which one covers more.
Why Is BNBCalc the Best Airbnb Analytics Tool?
Best for: investors who want to research markets and analyze a property in one account, then repeat that analysis at scale through an API.
I'd pick it because you can see what's behind its numbers at every step. Markets shows the listings behind a market's figures, AI Underwriter says why each comp made the cut, and the Calculator carries one address through your own loan to cash flow.
What Can You Research in BNBCalc Markets?
BNBCalc Markets covers 2,300+ markets in 157 countries and ranks US markets by gross yield, a typical listing's annual revenue divided by the average estimated home value, so you see what listings earn against what homes cost from the start. Outside the US, markets rank by revenue instead, because gross yield is a US-only figure. You don't need an account to browse BNBCalc's US market rankings, either.
Open a market, and Markets splits its revenue by bedroom count and performance tier. When I pulled BNBCalc's Phoenix data, a typical three-bedroom grossed $58,788 over the 12 months to September 2026, while low performers averaged $19,201 and top performers $110,461. That's nearly twice the typical figure.
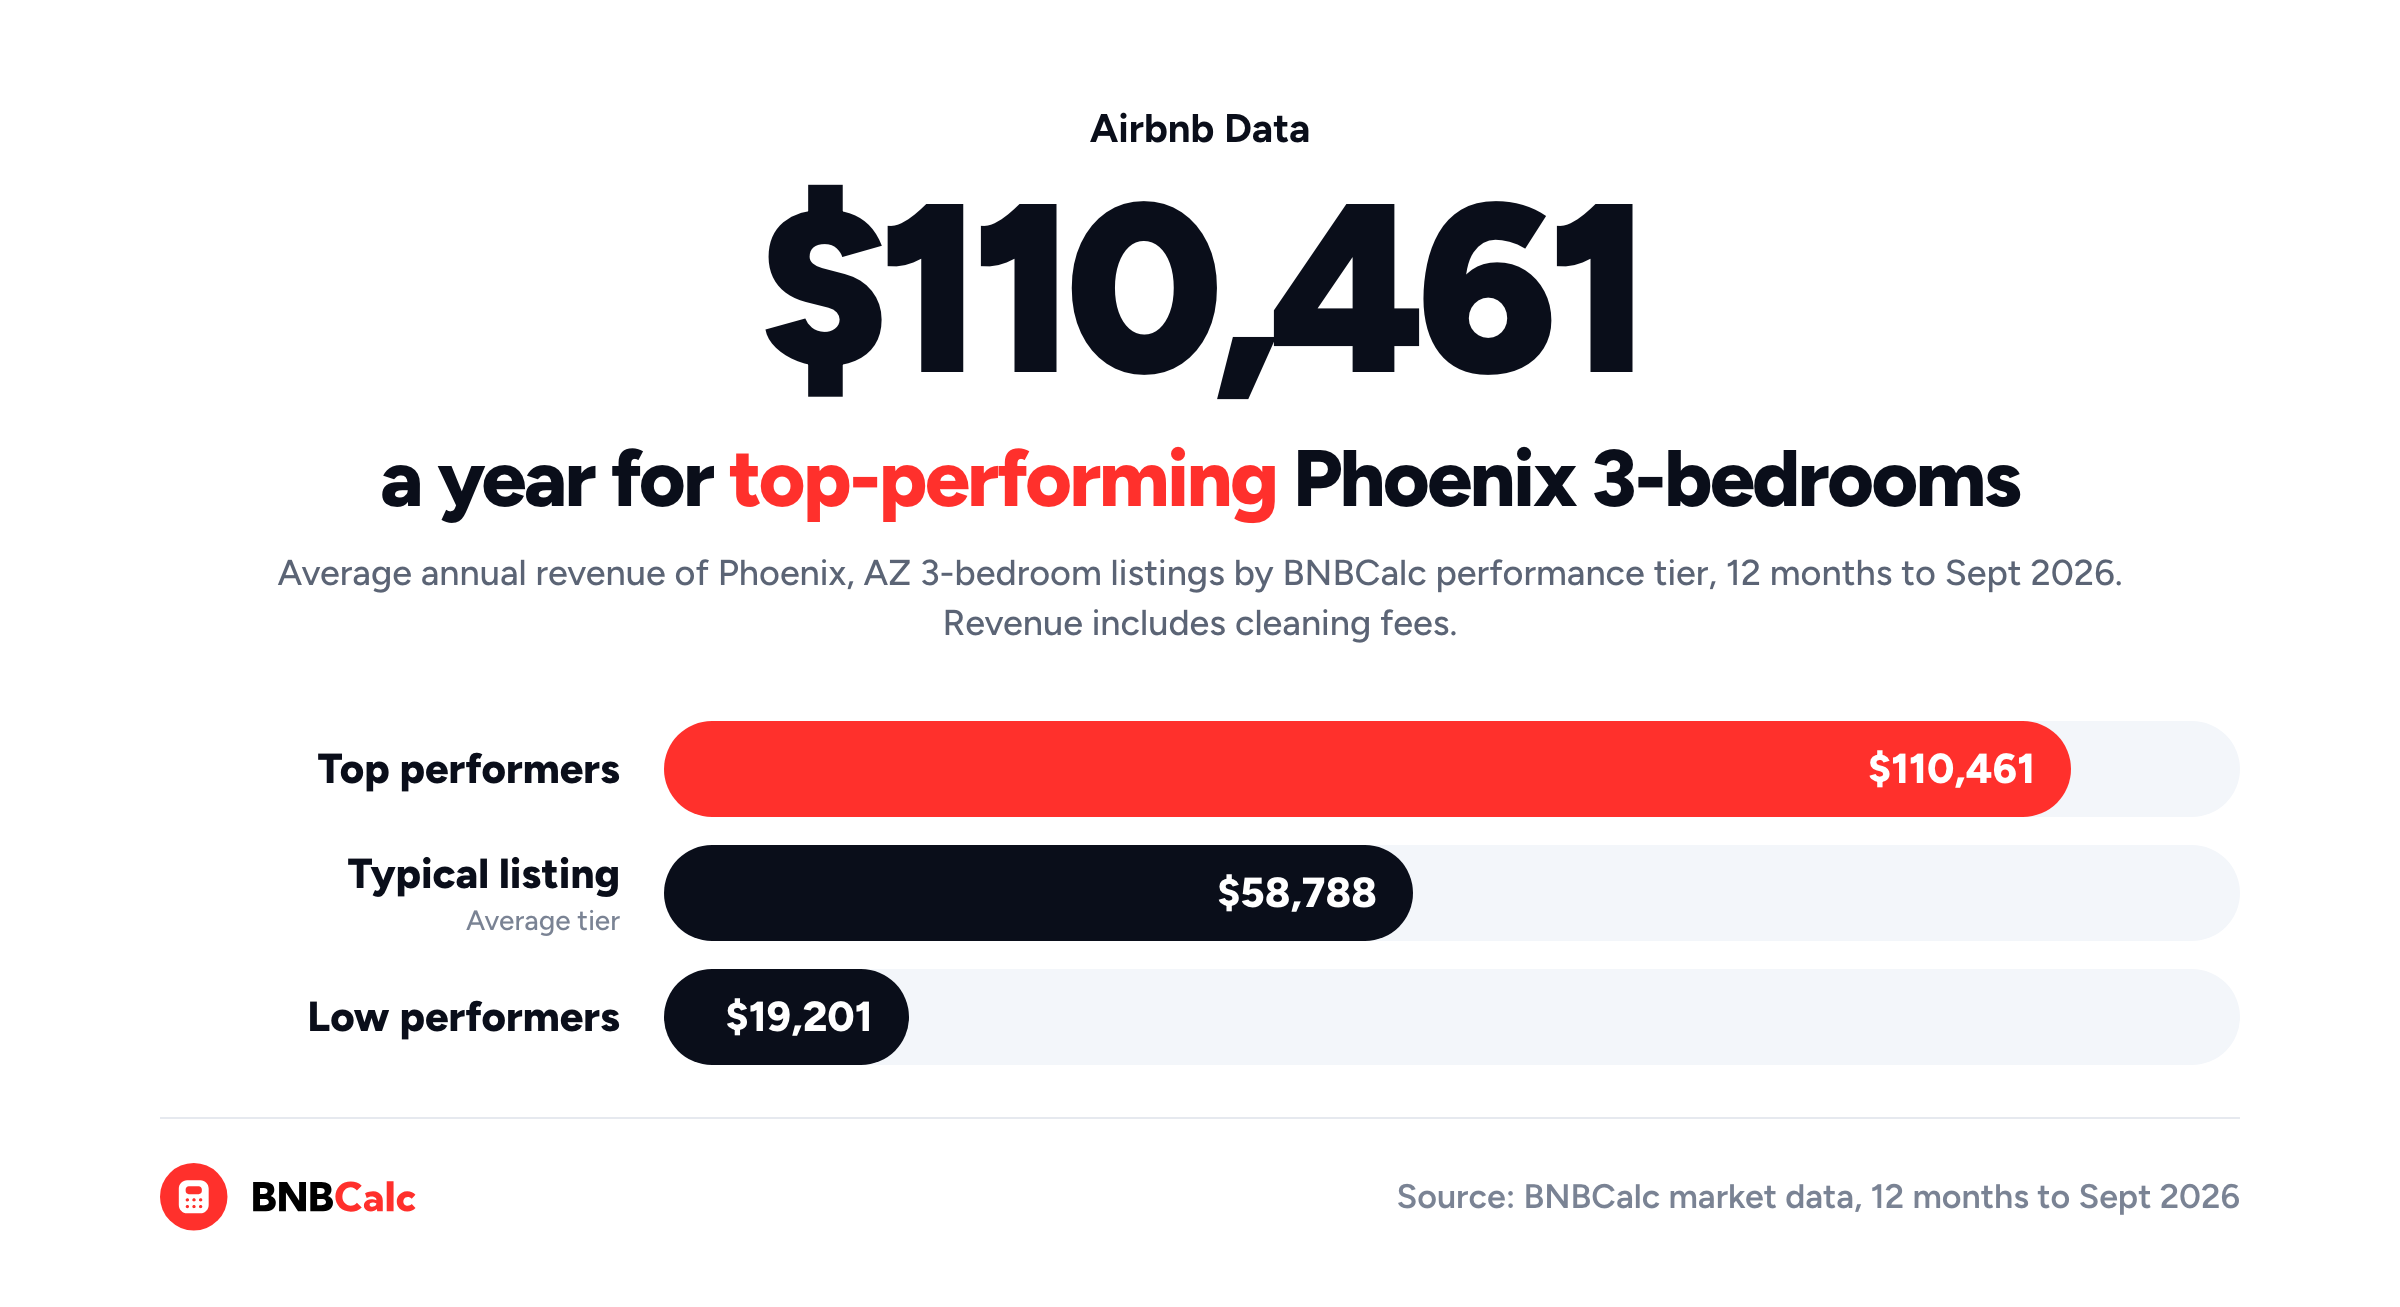
That spread is why you'll want to look past the average to the listings. Markets maps each market's Airbnb, Vrbo and Booking.com listings, and each one's detail panel shows what it earned over the past 12 months, its occupancy of the nights it was open and how many days its host blocked. You can save the ones you'd compete with as a comp set to share or export to CSV, while the Operators tab shows who runs two or more listings and what those listings earned.
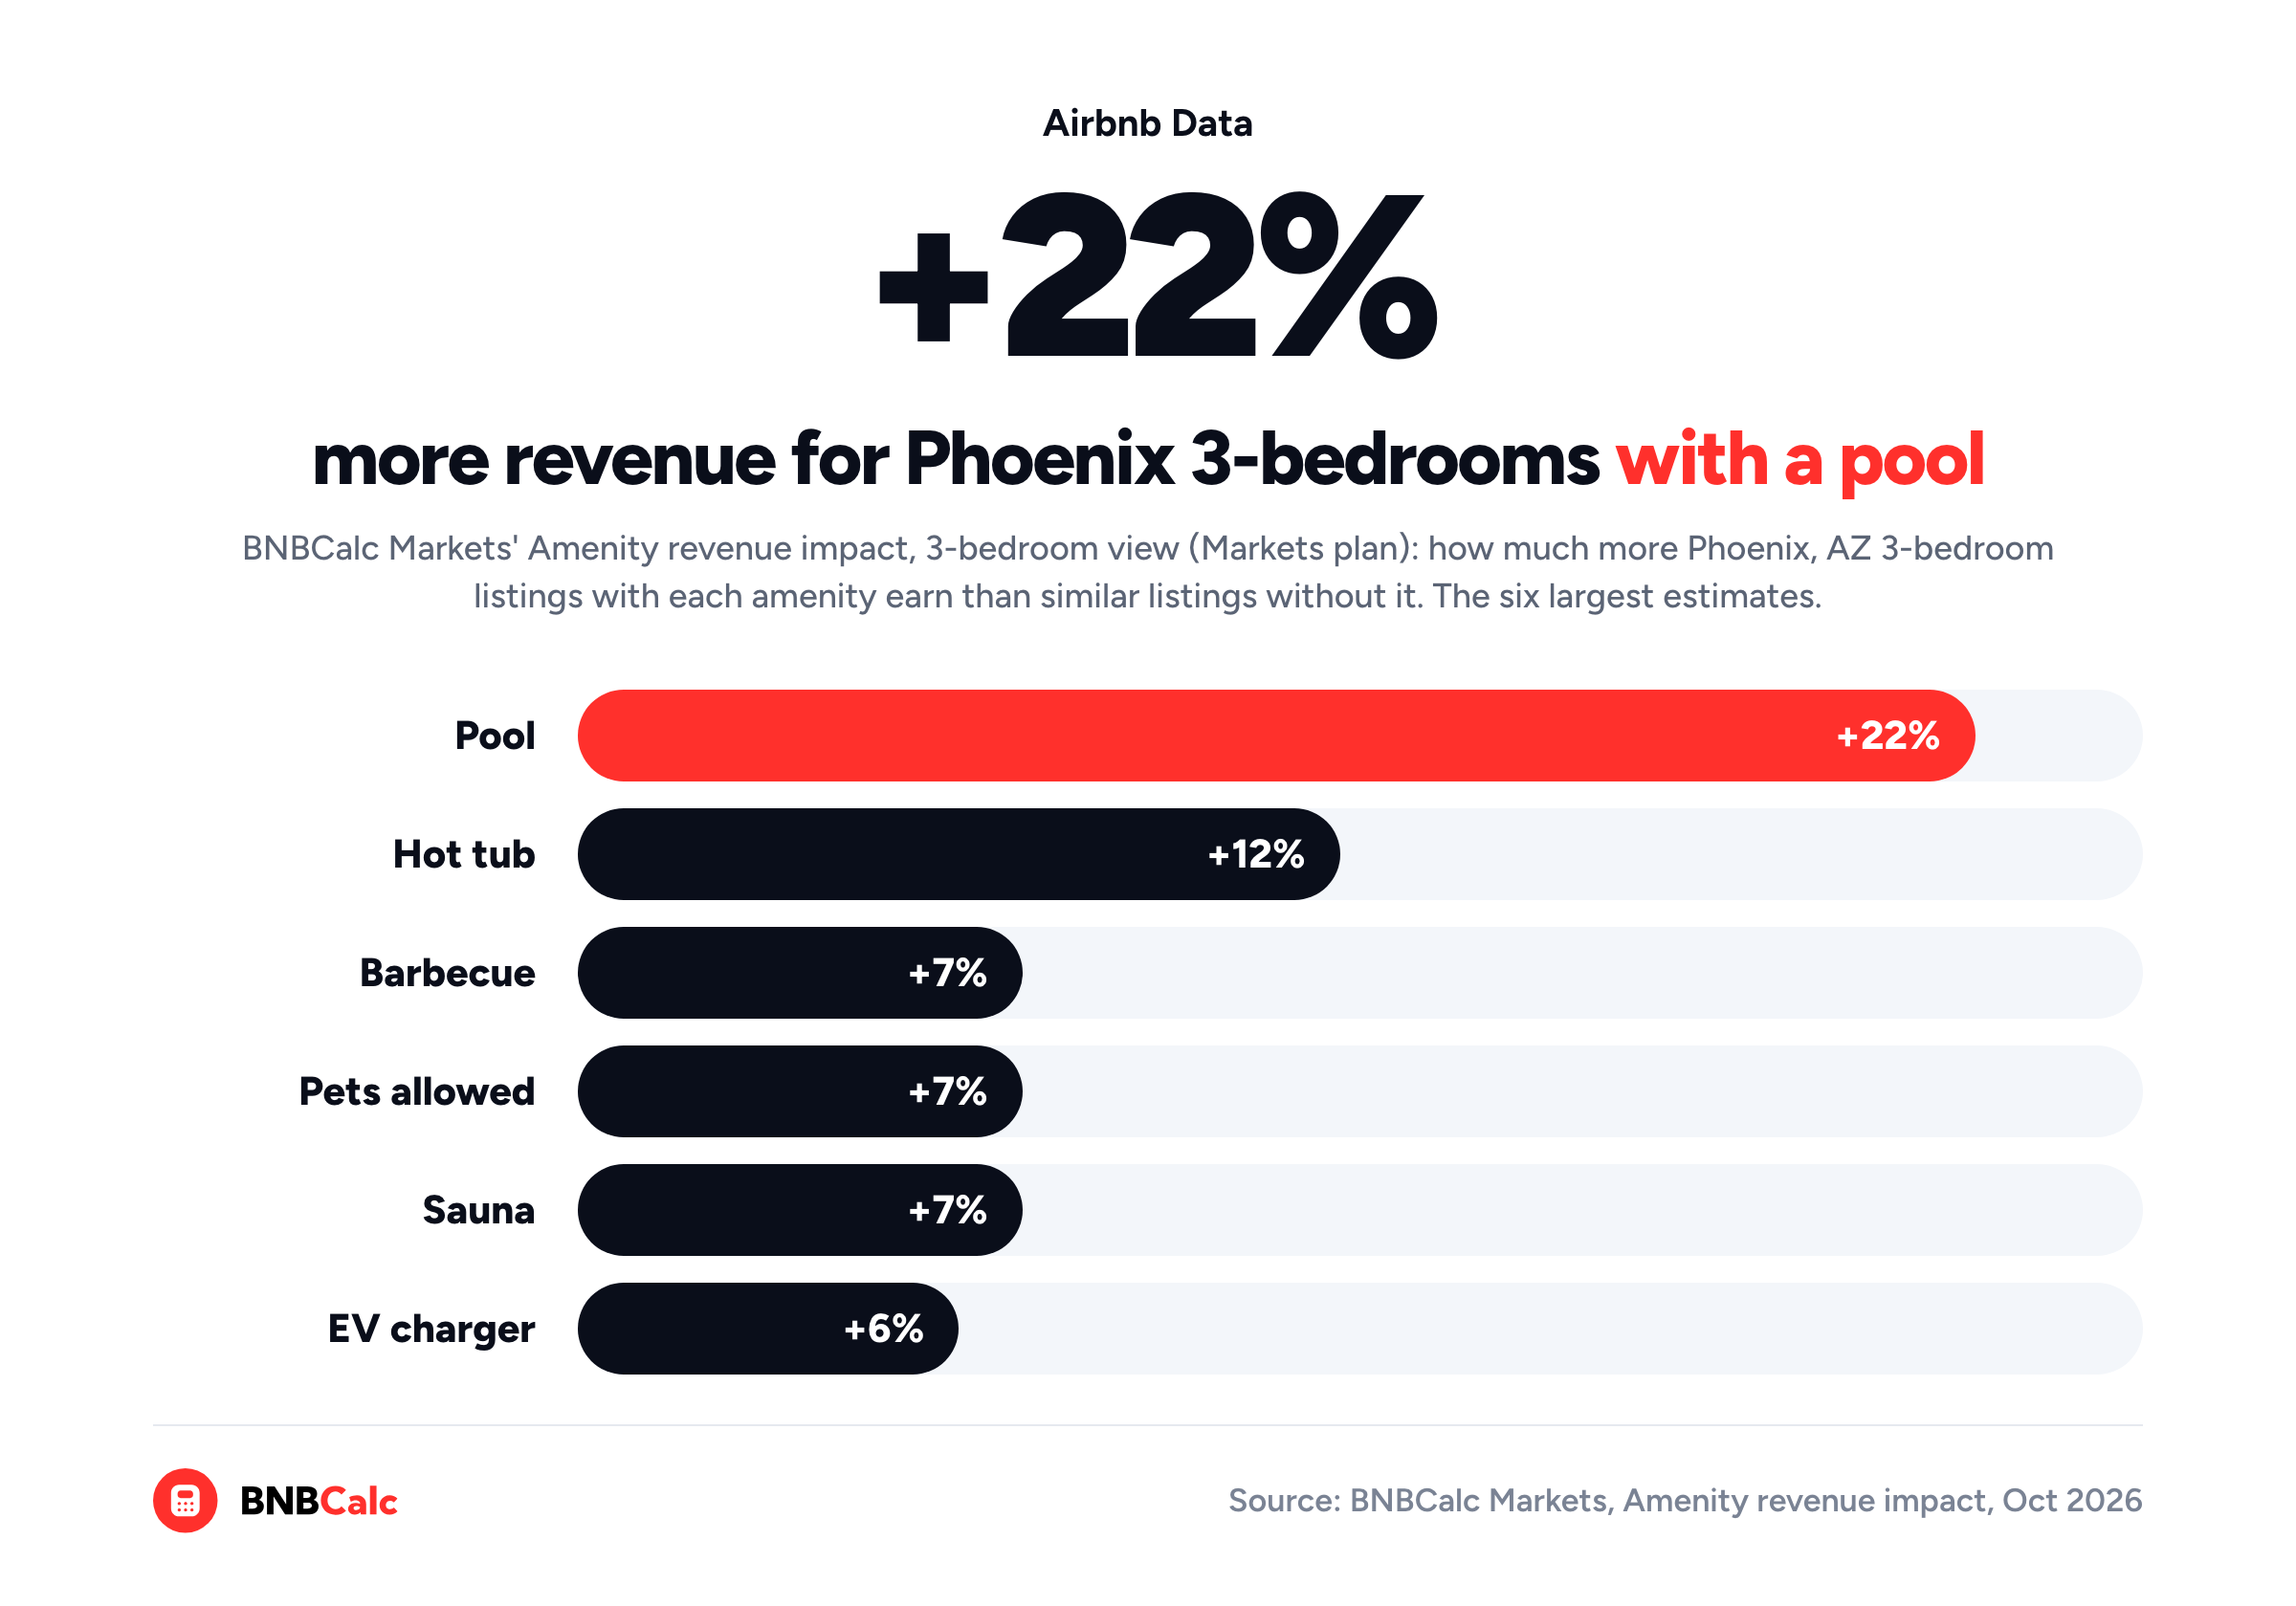
Markets' Amenity revenue impact table then estimates how much more listings with a given amenity earn, comparing similar listings in the same market. On the Markets plan, you can also narrow it to one bedroom count, and for Phoenix three-bedrooms it puts a pool at about 22% and a hot tub at about 12%.
All of that comes with Markets, which costs $79 a month or $399 a year as of October 2026 and includes the full BNBCalc Calculator. Month to month, that's $46 less than AirDNA's Market Research plan.
How Does the BNBCalc Calculator Analyze One Property?
When you've got a house in mind, give the BNBCalc Calculator its address or a Zillow link, plus the bedrooms, bathrooms and guests, and it pulls up to 50 comparable listings nearby. For a US property, you can then run its AI Underwriter, which reviews each comp's photos, layout and amenities against yours, keeps about five of the closest, never more than eight, and tells you why it kept or left out each one. If you disagree with a pick, you can tick a left-out comp back in.
From those comps, it builds your revenue estimate, and its Estimate with AI button suggests running costs line by line, each with its source. Add your price, down payment, rate and term, and it takes the deal through to cash flow, cap rate, cash-on-cash return and, for a US purchase, DSCR.
It also covers a home you already own, renting a home to list it and co-hosting, and it prints to PDF or exports to Excel. On its own, the Calculator costs $30 a month or $199 a year as of October 2026.
Does BNBCalc Have an Airbnb Data API?
Yes, BNBCalc has one. You'll want it once you've got more addresses than you can run by hand. The BNBCalc API takes an address with the property's details and returns a BNBCalc analysis as data, including the comps behind it and a link to a hosted report. As of October 2026, it costs $0 a month plus $0.20 per report it creates, and $0.10 more each time AI comp selection or an AI expense estimate completes, while a request that fails costs nothing.
What Do AirDNA, Rabbu, Mashvisor and the Other Tools Offer?
For the other six, I've stuck to what each one's own pages said in the US view in October 2026, with a link to where the facts came from.
AirDNA
What it covers: Rentalizer revenue estimates for an address, market data, and dynamic pricing sold separately.
AirDNA pulls its data from Airbnb, Vrbo and Booking.com, and you can try a limited Rentalizer and limited market insights on its Free plan. Once you want more, AirDNA's pricing page puts its Market Research plan at $125 a month, or $400 billed annually, as of October 2026, and its calculator page says paid plans add custom comp sets, the full financial calculator and unlimited PDF reports.
As for returns, AirDNA's Rentalizer help article describes an Investment Return Calculator that turns your operating costs into net operating income, then adds a cap rate "if you're making a cash investment" once you enter a purchase price.
Rabbu
What it covers: a free revenue estimate and underwriting calculator for US addresses, plus free city market pages and a market finder.
Rabbu's calculator estimates Airbnb revenue "for any address in the United States," lets you include or exclude nearby comps and comes with an underwriting calculator that shows a cap rate, cash-on-cash return and gross yield. Since Rabbu lists no subscription or pricing page as of October 2026, all of that is free. Its market finder is free too, and it lists US markets with figures like annual revenue, average gross yield and occupancy.
Rabbu builds its numbers differently from BNBCalc, however. Its revenue leaves out cleaning fees and it measures nightly rate and occupancy over the next 30 days, whereas BNBCalc's figures cover the past 12 months and its revenue includes cleaning fees. That's why you shouldn't set one tool's figure straight against the other's.
Mashvisor
What it covers: Airbnb and long-term rental analysis for a property, with financing, plus property and market search.
Mashvisor says its data covers "95% of US markets," drawing on sources that include the MLS, Zillow and Airbnb.com, and its calculator lets you adjust financing assumptions to see cash flow, cap rate and cash-on-cash return. To use its Find & Invest plans, however, you'll pay quarterly or yearly, since Mashvisor's pricing page lists Lite at $49.99 a month billed $149.97 a quarter, or $479.88 a year, as of October 2026.
Its help center also says those plans don't currently include a 7-day free trial, whereas BNBCalc bills month to month or yearly and both of its plans start with one.
PriceLabs Market Dashboards
What it covers: market dashboards for the listings within a radius you set, sold alongside PriceLabs' dynamic pricing.
As of October 2026, PriceLabs' Market Dashboards start at $9.99 a month. They draw on Airbnb and Vrbo data that PriceLabs says it updates daily in "150+ Countries," and each dashboard carries two years of history and up to a year of projections. PriceLabs also has a free Revenue Estimator that takes a location and a bedroom count and returns projected revenue, nightly rate and occupancy.
By comparison, the BNBCalc Calculator asks for the bathrooms and guests as well as the bedrooms and, for a US house, lets you run AI Underwriter to pick the comps behind its estimate.
AllTheRooms
What it covers: analytics and competitor tracking, sold one market at a time.
AllTheRooms' homepage now carries the Deckard Technologies name, and its pricing page sells plans per market, from a postal code or neighborhood up to a city or region, with state, country and global plans above that. As of October 2026, its Free plan gives you three months of history in a sample market, while Basic costs $19 a month per market with 12 months of history, or from $11 a month billed annually.
BNBCalc Markets isn't sold that way. One plan covers all 2,300+ of its markets.
KeyData
What it covers: performance benchmarks for property managers and tourism groups, built on reservation data from property-management systems.
KeyData describes its data as "verified, first-party reservation data" from 80+ property-management system integrations, which it combines with Airbnb and Vrbo listing data and hotel benchmarks. As of October 2026, it sells through a demo rather than a public price list, though you can ask for a free custom market report that its team reviews with you.
BNBCalc, by contrast, publishes its prices. You can also run two property analyses before you pay anything.
So, What's the Best Airbnb Analytics Tool in 2026?
For an investor, it's BNBCalc. BNBCalc Markets ranks US markets by gross yield, splits each one by performance tier and shows what each listing earned, which is how you'd find that Phoenix's top-performing three-bedrooms averaged $110,461 against $58,788 for a typical one over the 12 months to September 2026. After that, the BNBCalc Calculator takes one address through your loan to cash flow, and the API does the same for a whole list.
Your next step is to open a market you're weighing in BNBCalc Markets and filter its listings by performance tier before you look at a single house.
Before you pay for any analytics tool, check whether you can see the listings and comps behind its numbers, because a figure you can't trace back to real listings is one you'll end up taking on faith.
Frequently Asked Questions
Is There a Free Airbnb Analytics Tool?
BNBCalc lets you run two property analyses free, or start a 7-day free trial with full access. Without an account, its US market rankings are public, and each market page shows its headline annual revenue and, in most markets, occupancy and nightly rate. One market, Broken Bow, Oklahoma, is fully open in BNBCalc Markets, so you can explore all of its data there before you pay.
What's the Best Tool for Short-Term Rental Market Research?
BNBCalc Markets is built for it, since it ranks US markets by gross yield and splits each market by bedroom count and performance tier. In BNBCalc's Phoenix data, typical three-bedrooms grossed $58,788 over the 12 months to September 2026, low performers $19,201 and top performers $110,461. Each listing's detail panel then shows what it earned and how many days its host blocked.
Which Airbnb Analytics Tool Shows What Amenities Earn?
BNBCalc Markets does, in its Amenity revenue impact table, which estimates how much more listings with a given amenity earn than similar listings in the same market. On the Markets plan, with its bedroom menu set to three bedrooms, it puts a pool at about 22% for Phoenix, a hot tub at about 12% and a barbecue at about 7%. When you analyze a house, the BNBCalc Calculator also shows which amenities earn more in that market for your bedroom count.
Can One Tool Research Airbnb Markets and Analyze a Property?
Yes, BNBCalc does both, since BNBCalc Markets includes the full BNBCalc Calculator on one account. Markets ranks markets and breaks down their listings, and when you want to check one house, you type its address into the search box Markets shares with the Calculator. As of October 2026, Markets costs $79 a month or $399 a year.
BNBCalc Calculator Pricing and Free Analyses
When you've got an address of your own to check, the BNBCalc Calculator costs $30 a month or $199 a year as of October 2026.
If you'd like to try it first, you can run two property analyses free, or start a 7-day free trial with full access.
On the other hand, if you don't know where to invest yet, use BNBCalc Markets, which includes the Calculator for $79 a month or $399 a year, to rank US markets by gross yield and see what each listing in them earned.
Airbnb Tax Deduction Calculator
Paying too much in taxes? We have the perfect solution. Simulate an Airbnb home purchase below.
Purchase Price
$450K
Structure Value
70%
Apply Trump's Tax Cut (Bonus Depreciation)
Depreciation
$117,695
Interest
$21,600
Tax
$6,750
Year 1 Deduction
$146,045
Want to claim this deduction? Get a free cost segregation benefit analysis from CSA Partners — no obligation.
Get Full Analysis