#1
17 tracked markets
Source: BNBCalc market metadata · Reviewed by Parker Place, CTO of BNBCalc.com · Data updated October 7, 2026
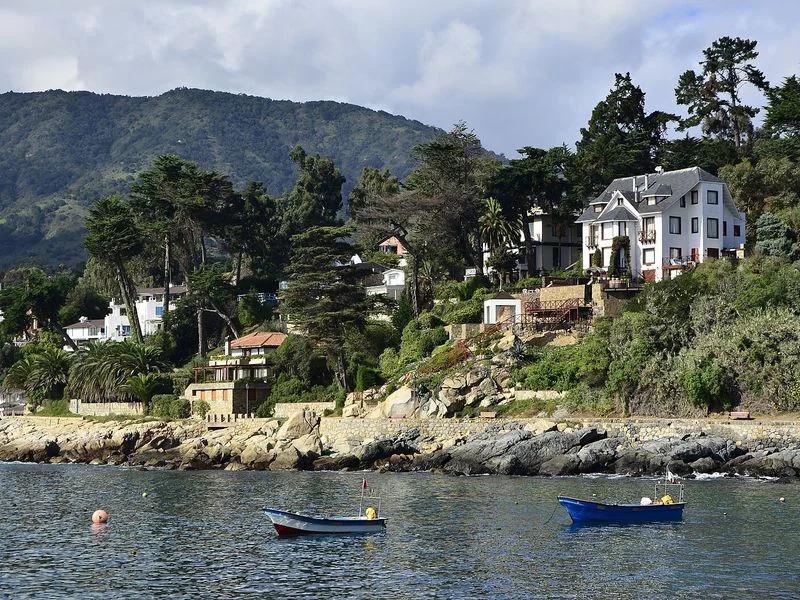
Zapallar is the top Chile short-term rental market across Airbnb and Vrbo by annual revenue. Average-tier listings in Zapallar earn $14,008,824 a year on average, with 29% occupancy at an average daily rate of $146,498. Zapallar has 2,654 average active listings.
Top revenue market
Zapallar
$14.0M
Median annual revenue
$9.1M
Average listing revenue
Median occupancy
28%
Adjusted occupancy
Tracked markets
17
Countrywide market coverage
#1
#2
#3
#4

#5

#6
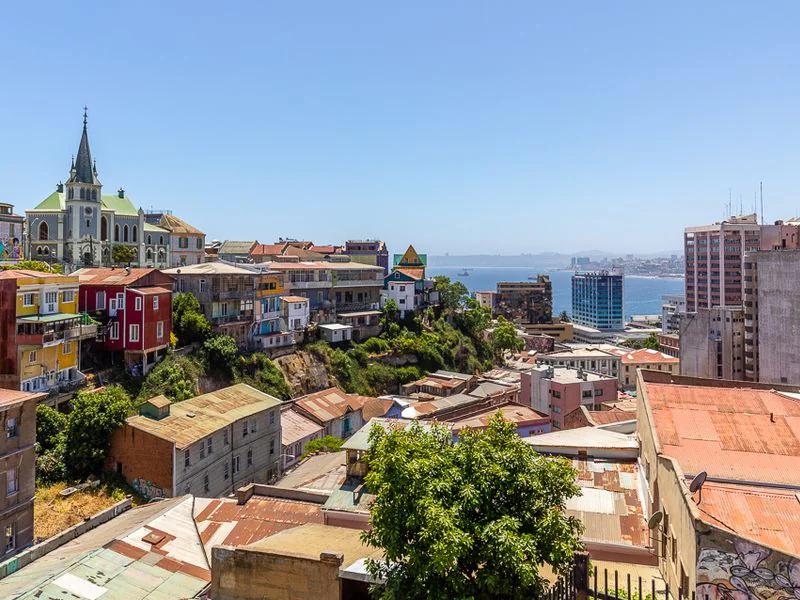
#7
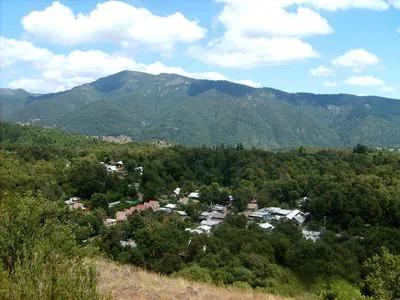
#8
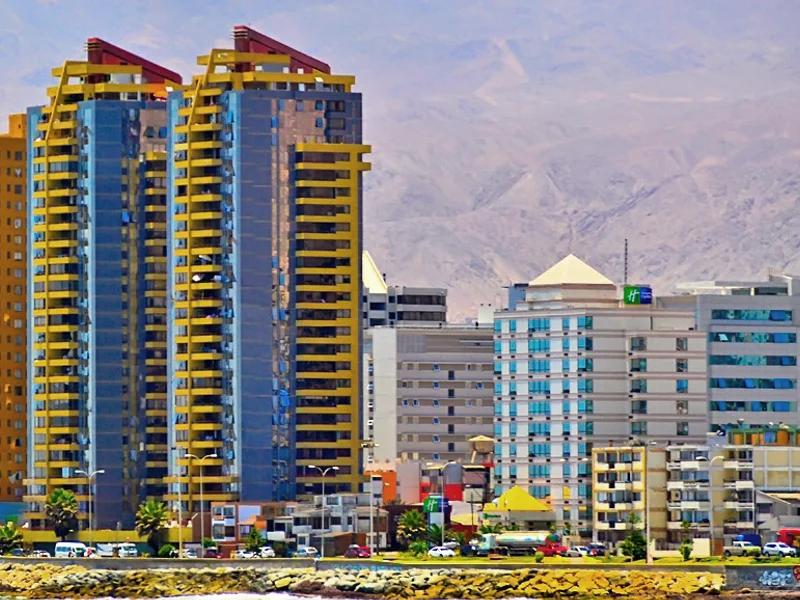
#9
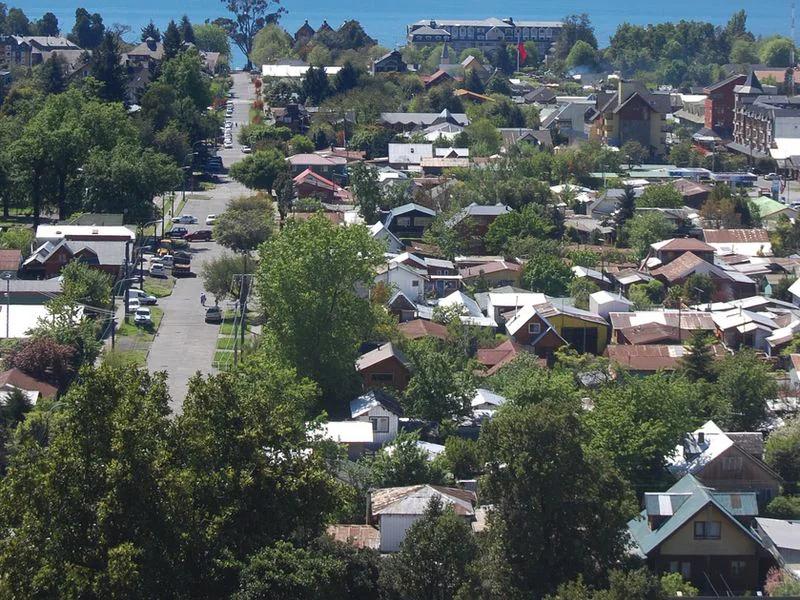
#10
Every market below links to its full BNBCalc market page. Non-US country rankings use annual revenue first because gross yield requires property value metadata that is currently US-only.
Average active listings is the average number of Airbnb and Vrbo listings active in a market each month over the last 12 months, the same figure you'll see on that market's page. Annual revenue is total market revenue over the last 12 months divided by that average, and it already includes cleaning fees.
| Rank | Market | Annual revenue | Monthly revenue | ADR | Occupancy | Average active listings |
|---|---|---|---|---|---|---|
| #1 | Zapallar | $14,008,824 | $1,167,402 | $146,498 | 29% | 2,654 |
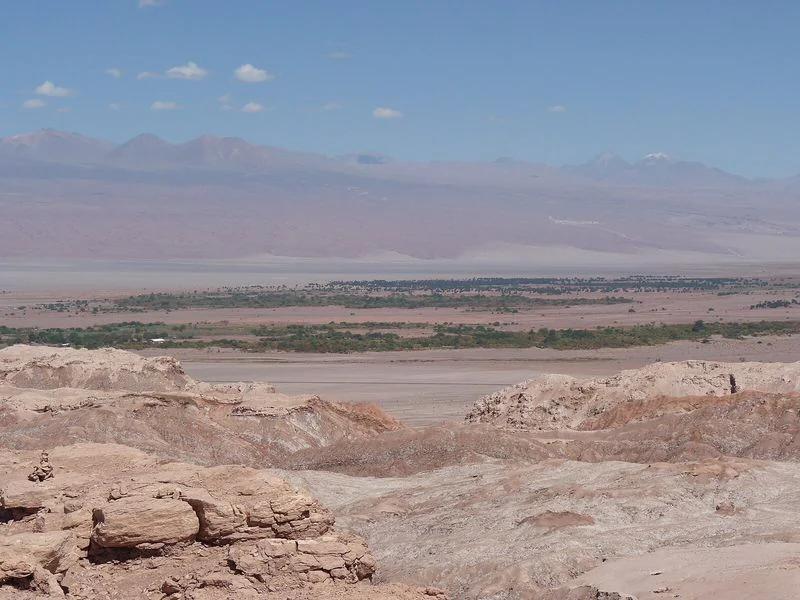
| #2 | San Pedro de Atacama | $12,499,019 | $1,041,585 | $66,020 | 40% | 593 |
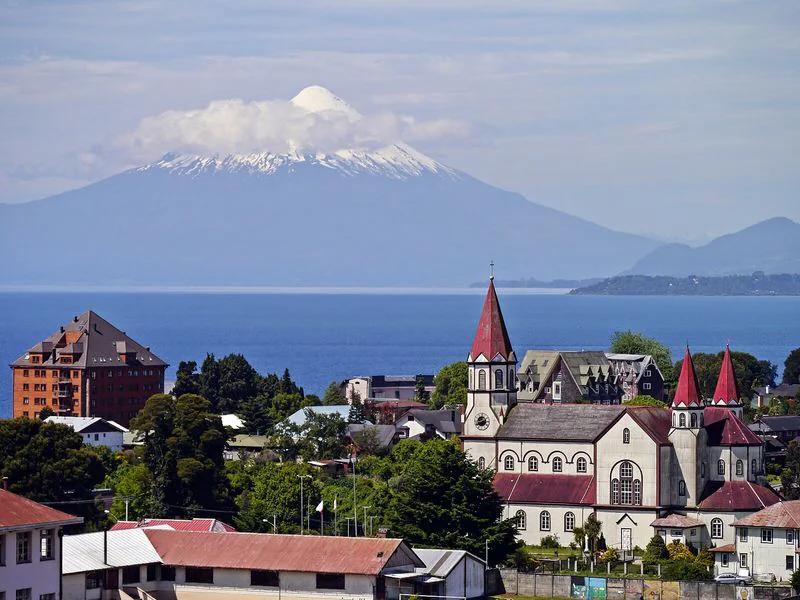
| #3 | Puerto Varas | $12,223,191 | $1,018,599 | $102,069 | 32% | 1,727 |
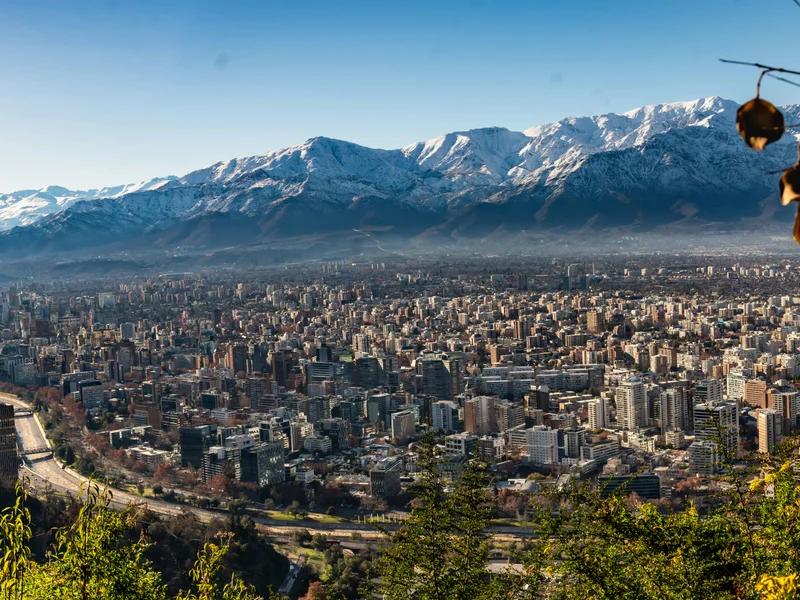
| #4 | Santiago | $12,085,110 | $1,007,092 | $62,764 | 44% | 9,699 |
| #5 | Pichilemu | $11,537,391 | $961,449 | $110,258 | 25% | 1,103 |
| #6 | San Antonio | $10,917,256 | $909,771 | $105,674 | 26% | 3,097 |
| #7 | Valparaíso | $10,450,867 | $870,906 | $90,007 | 30% | 5,296 |
| #8 | Pinto | $10,408,903 | $867,409 | $103,848 | 21% | 1,051 |
| #9 | Antofagasta | $9,076,061 | $756,338 | $68,359 | 34% | 564 |
| #10 | Pucón | $8,656,293 | $721,358 | $91,171 | 24% | 4,562 |
| #11 | Coquimbo | $8,284,241 | $690,353 | $81,519 | 27% | 4,462 |
| #12 | Panguipulli | $8,243,423 | $686,952 | $102,121 | 24% | 802 |
| #13 | Coyhaique | $7,942,863 | $661,905 | $79,735 | 28% | 521 |
| #14 | Talca | $7,737,301 | $644,775 | $71,717 | 28% | 445 |
| #15 | Concepción | $6,277,676 | $523,140 | $56,015 | 30% | 726 |
| #16 | Arica | $6,079,236 | $506,603 | $55,055 | 33% | 353 |
| #17 | Puerto Montt | $5,270,901 | $439,242 | $59,892 | 25% | 897 |
Outside the US, BNBCalc ranks country market pages by average annual revenue until property-value coverage is available for international gross yield. Annual revenue is useful for identifying demand and pricing power, but investors should still review acquisition cost, taxes, seasonality, regulations, and operating expenses before comparing returns.