
Free instant analysis
Reveal Airbnb revenue for any address or city
Where do you find Airbnb market data you can trust, and how much of it can you get without paying? Well, more than you might think. Without an account, BNBCalc's public page for Boise, Idaho shows that a typical listing there earned $37,359 over the 12 months to September 2026, booking 48.7% of its open nights at $188 a night.
Beyond BNBCalc, free data comes from Inside Airbnb, city license records and tourism boards, while paid platforms like AirDNA, PriceLabs and Mashvisor charge for theirs.
So I'll start with what BNBCalc shows free and what its Markets plan adds, using Boise as the example, and then compare the other sources, with prices as of October 2026, before we get to how much history you can get for a city.
Where Can You Find Free Airbnb Market Data?
The quickest free source is BNBCalc itself, since three of its public pages work without an account.
First, BNBCalc's state ranking pages list all 487 US markets it tracks, ranked by gross yield for the 477 that have one. Their columns cover gross yield, median annual room potential, monthly room potential, ADR, occupancy, average active listings and median home value, where room potential means what a home could earn in room revenue if it were bookable all year, with cleaning income left out.
The rows cover all bedroom counts at the average performance tier, and on BNBCalc's Idaho page, for example, Boise ranks fifth of the state's nine markets at a 6.8% gross yield.
Second, every market page shows its typical listing's annual revenue, lead time and RevPAR without a login, plus occupancy and nightly rate in most markets, each with a month-by-month mini chart. In US markets, BNBCalc's Gross yield card is free too, labelled Current potential, and it shows the median of each home's room potential divided by a home value matched to its ZIP code and bedroom count, the same 6.8% for Boise.
One amenity's estimated revenue lift is shown in full as well, while most of the deeper data, from the bedroom breakdowns to each listing's revenue, stays locked.
Third, Broken Bow, Oklahoma is unlocked in full as a sample market, so you can see everything the paid plan shows for a market before you pay. The country rankings in BNBCalc Markets also show their first 10 markets free.
Best for: screening US markets by gross yield before you spend anything.
What Does BNBCalc Markets Add Over the Free Pages?
The free pages tell you what a typical listing earns. BNBCalc Markets, at $79 a month or $399 a year as of October 2026, opens up the rest of each market, across 2,300+ markets in 157 countries:
- every bedroom count and performance tier, plus gross yield, room potential and median home value by size in US markets
- every amenity's estimated revenue lift, by bedroom count
- each listing's actual and potential revenue, occupancy of available nights and host-blocked days
- the top ZIP codes by gross yield in US markets, and each operator's revenue
- comp sets you can save, share and export to CSV
It includes the full BNBCalc Calculator too, and that matters more than it sounds. With market data, you can see what listings earn, but not what one house would leave you after the mortgage. So once a market makes your shortlist, you can type an address into the same search bar and take that house through its expenses and your loan to cash flow and cash-on-cash return.
Best for: going from a shortlist of markets to the numbers on one house, in one account.
How Much Do Airbnbs Make in Boise? Free Data vs the Markets Plan
Boise shows the difference well.
First, though, keep in mind that BNBCalc's Boise market reaches past the city itself: about half its listings sit in Boise's own ZIP codes, roughly three in ten in Meridian, Nampa, Caldwell and Eagle, and about one in ten in Twin Falls.
| What you want to know | Free, logged out | With BNBCalc Markets |
|---|---|---|
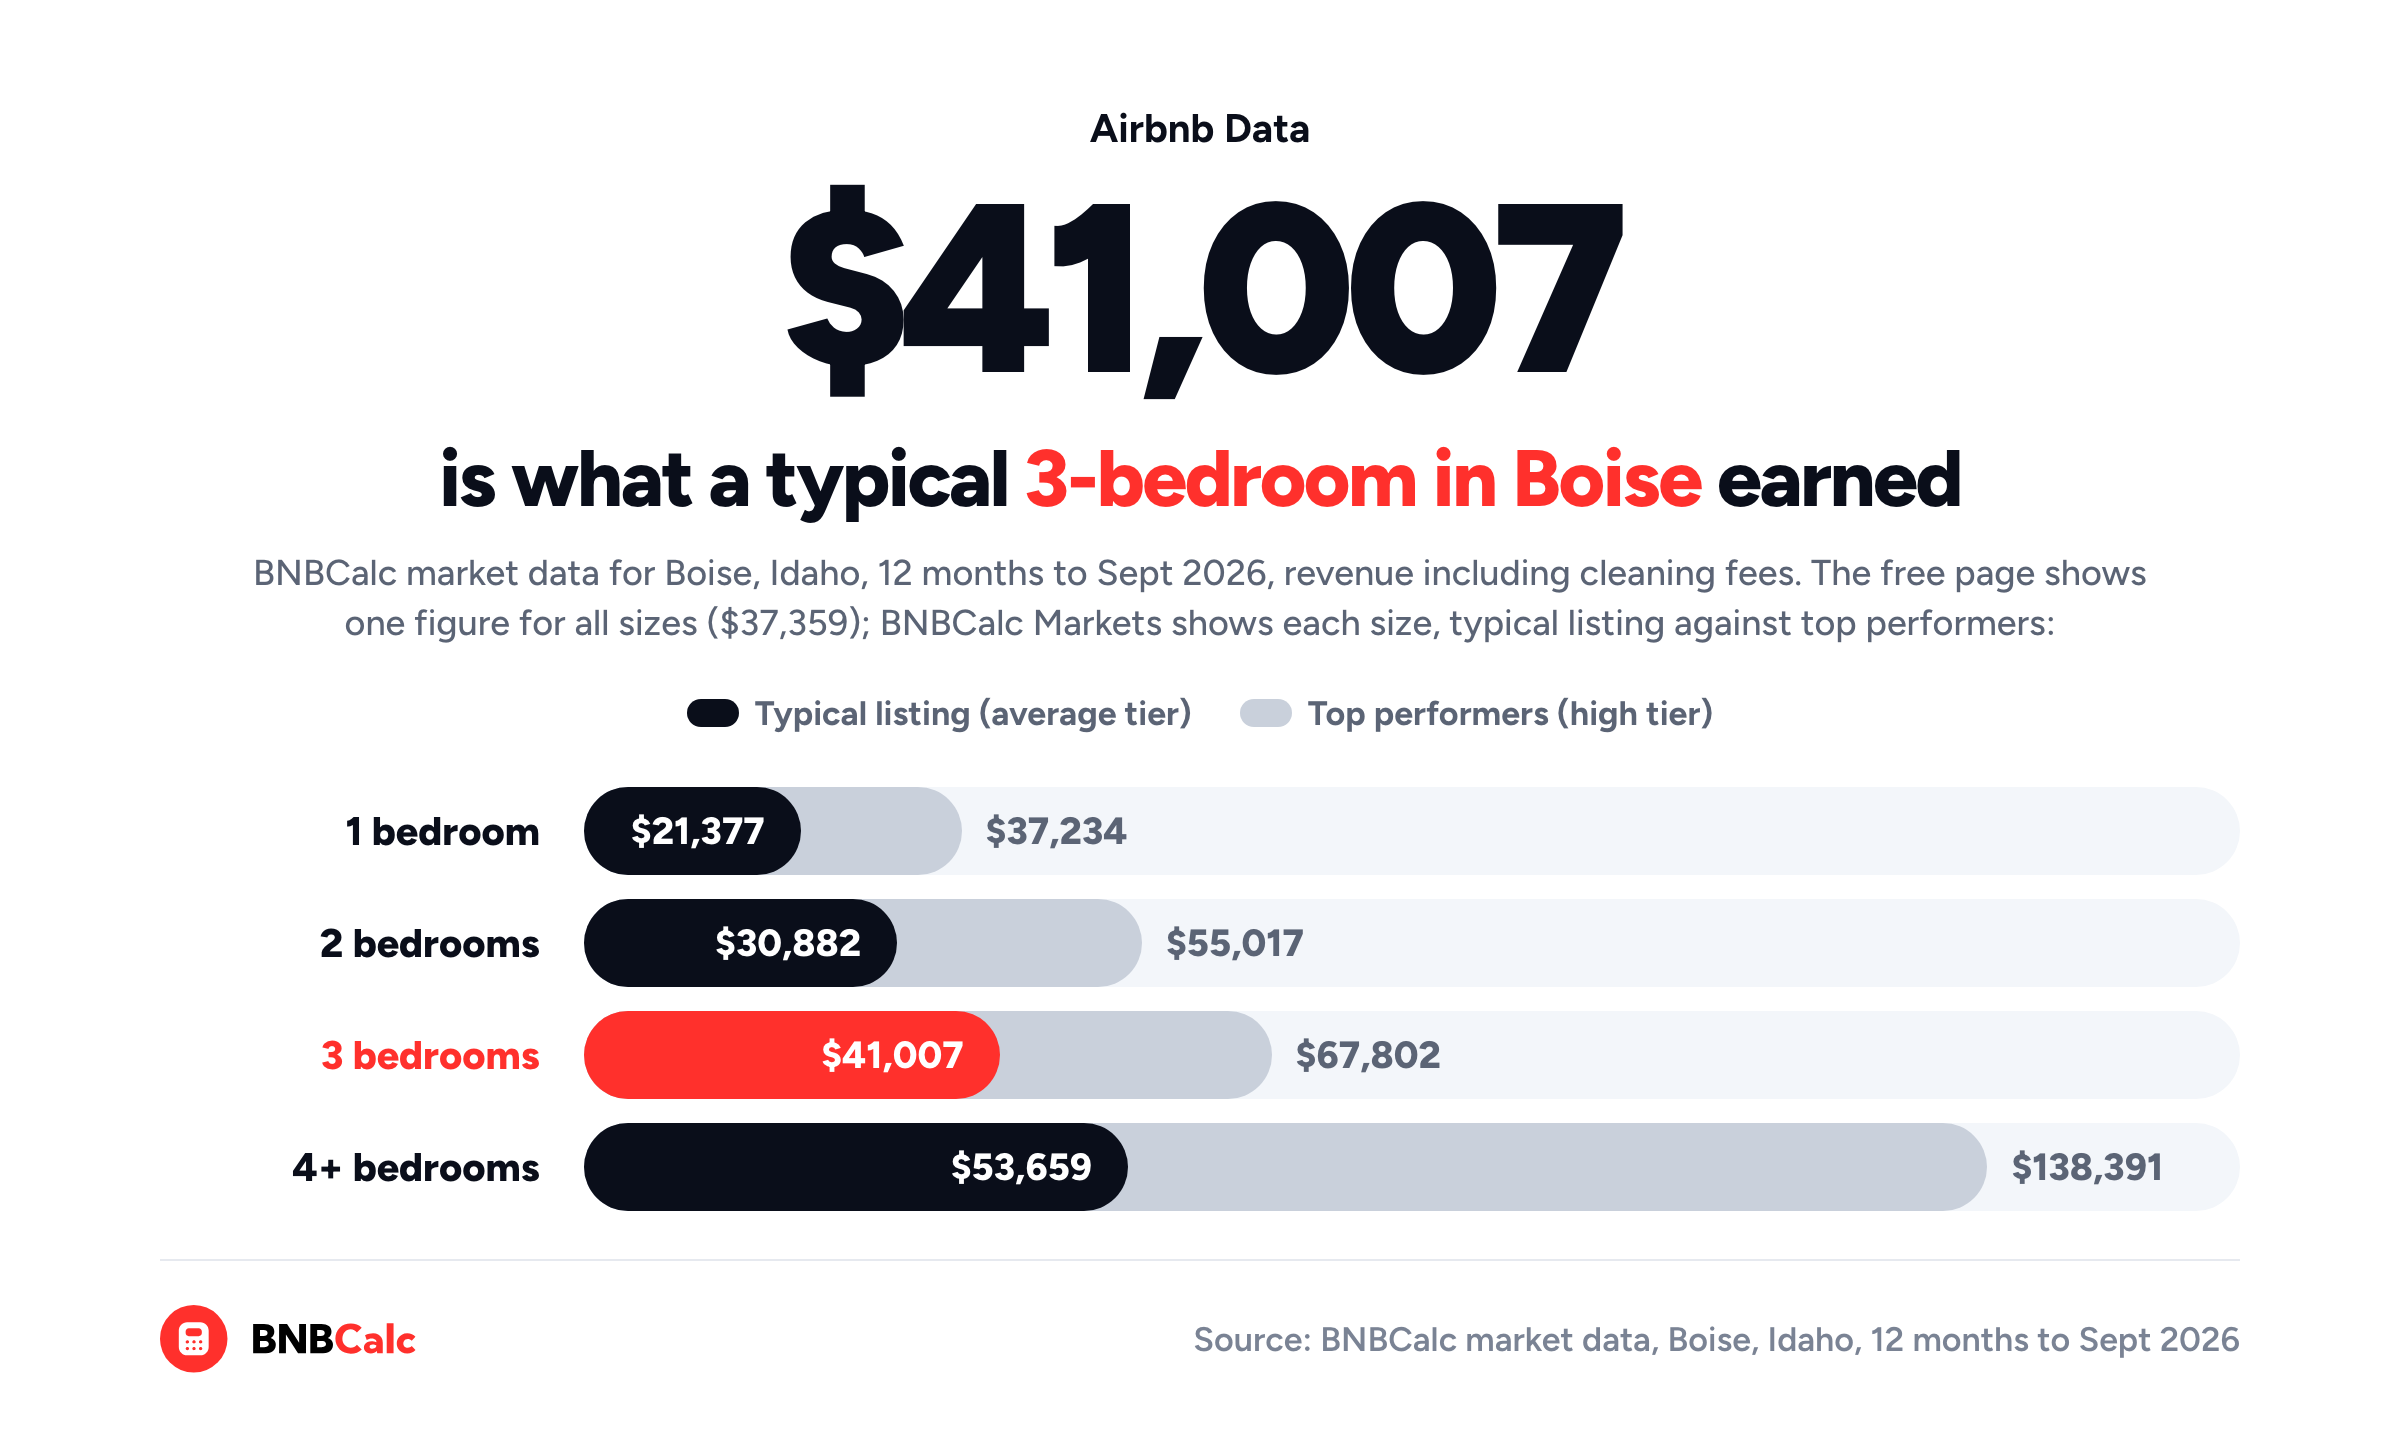
| What a typical listing earns | $37,359 a year, all bedroom counts together | $41,007 for a typical three-bedroom, $67,802 for a top performer |
| Occupancy and nightly rate | 48.7% at $188 a night | 49.5% at $200 a night for a typical three-bedroom |
| Gross yield | 6.8%, on the market page's Gross yield card and the Idaho ranking page | Gross yield, room potential and median home value for each bedroom count |
| Amenities | Hot tub, +17% across all sizes | Every amenity by size: for three-bedrooms, hot tub +20% and EV charger +11% |
| Listings | Photos and nightly rates, with revenue locked | Each listing's revenue, occupancy and host-blocked days |
All of it covers the 12 months to September 2026, except the gross yield, which is the card's Current potential as of BNBCalc's October 7, 2026 data update. Typical means BNBCalc's average performance tier and top performer its high tier, while revenue and nightly rates include cleaning fees.
Read each row from left to right, since the free column describes a typical listing across every size, whereas the Markets column describes the size you'd buy. And for three-bedrooms, top performers earned 65% more than the typical one.
Before you get attached to any of these numbers, make sure to check the rules for the address itself. BNBCalc's Boise regulation guide covers what changed for hosts there in 2026. And if you'd like to see a full market page read section by section, our guide to short-term rental market reports walks through one.
Other Free Airbnb Data Sources: Public Records and Tourism Data
Outside BNBCalc, the free sources are mostly public records and research projects, and each one answers a narrower question than a market page does.
Inside Airbnb
What it covers: listing, calendar and review files built from public Airbnb pages, with the last year's quarterly snapshots free on Inside Airbnb's data page and older files by request. It's a mission-driven project focused on Airbnb's impact on residential communities, and its own notes say Airbnb's calendar doesn't separate a booked night from a blocked one, so it estimates occupancy from reviews. BNBCalc's listing data, by contrast, shows each listing's estimated nights booked next to the days its host blocked.
City Short-Term Rental License Data
What it covers: which addresses hold a short-term rental license, sometimes with details like the bedroom count. For example, Seattle's license dataset even flags whether each unit is the license holder's own home. Denver's license records are plainer, since they list each active or pending license with its address. Either way, records like these show where rentals are licensed rather than what they earn, so use them to check the rules and the competition, and a market page for the revenue.
Tourism Boards
What it covers: visitor demand rather than rentals. The LVCVA's monthly executive summary draws on sources like the Las Vegas airport and the Nevada Gaming Control Board. In Florida, Visit Florida's research department publishes an annual Florida Visitor Study, its reference guide to statistics on the state's visitors. Both give you background on demand, but you'll still need a market page to see what the rentals there earned.
Airbnb's Own Earnings Estimate
What it covers: a rough figure for your own home. Airbnb's help page says it uses the past 12 months of booking data from similar listings, multiplies their average nightly earnings by the nights you plan to host, and takes out Airbnb's host fee but not taxes or hosting expenses. Make sure to enter a full address rather than an area, since that's what bases the estimate on the listings closest to you. Treat it as a starting point. It stops before your expenses, which is where the BNBCalc Calculator picks up.
Paid Airbnb Market Data Platforms Compared
BNBCalc Markets sits on the paid side too, so let's line it up with the platforms that come up most often, using prices opened in the US view in October 2026.
| Platform | What it covers | Free option | Price (US, October 2026) |
|---|---|---|---|
| BNBCalc Markets | Active listings, sizes, tiers and amenity lifts in 2,300+ markets, about three years of history, comp sets, and the full Calculator | State rankings, part of every market page, the Broken Bow sample and a 7-day free trial | $79 a month or $399 a year |
| AirDNA | Market Explorer dashboards and Rentalizer estimates, from Airbnb, Vrbo and Booking.com data | A free plan with a limited Rentalizer and limited market insights | Market Research, $125 a month or $400 a year |
| Rabbu | US address estimates, city market data and an underwriting calculator | The calculator and market finder are free | No paid plan listed |
| PriceLabs | Market Dashboards for a radius you choose, from Airbnb and Vrbo data | One dashboard when you add a listing to its pricing tool, plus a free World STR Index | From $9.99 a month per dashboard |
| Mashvisor | US property search with Airbnb and long-term rental estimates | Calculator page says free; no free trial on its Find & Invest plans | Lite, $49.99 a month billed quarterly or $39.99 a month billed yearly |
| Key Data | Reservation data from property managers' systems, plus Airbnb, Vrbo and hotel data | A custom market report, reviewed in a consultation | Not published |
| AllTheRooms (Deckard Technologies) | Short-term rental analytics priced per market | A free plan with three months of history | $19 a month per market, or from $11 a month billed yearly |
Read the price column with the scope next to it. BNBCalc Markets' $79 covers every market it tracks, worldwide, with the Calculator included, and month to month it's $46 less than AirDNA's Market Research plan. PriceLabs and AllTheRooms, on the other hand, price each dashboard or market, so their cost grows with every market you add.
AirDNA
What it covers: its Market Explorer dashboards and Rentalizer estimates for a single address. According to AirDNA's help center, its data comes from Airbnb, Vrbo and Booking.com, with Booking.com added to the platform in June 2026. And its Market Research plan lists historical market insights and comparable sets among its features.
Rabbu
What it covers: a free calculator for US addresses, city market data and a market finder, plus an underwriting calculator with cap rate, cash-on-cash and gross yield. Rabbu's calculator page says its revenue figures leave out cleaning fees and its ADR and occupancy cover the next 30 days. BNBCalc's revenue includes cleaning fees and its occupancy covers the past 12 months, so expect the two to show different numbers for the same city. Neither is wrong. They measure different things.
PriceLabs
What it covers: Market Dashboards built from public Airbnb and Vrbo data inside a radius you choose, updated daily, with two years of history and up to a year of projections. PriceLabs also sells dynamic pricing software and publishes a free World STR Index for countries and regions.
Mashvisor
What it covers: US property search that estimates both Airbnb and long-term rental income, from sources it lists as including the MLS, Airbnb.com and the Census Bureau. Mashvisor's pricing page says it covers 95% of US markets and bills quarterly or yearly, and its Enterprise plan advertises up to 10 years of historical data.
Key Data
What it covers: reservation data that property managers share through 80+ property-management systems, combined with Airbnb and Vrbo listings and hotel benchmarks. Key Data sells through demos rather than a public price list, and it offers prospective customers a free custom market report, reviewed with its team in a consultation.
AllTheRooms (Deckard Technologies)
What it covers: short-term rental analytics priced per market, from a whole city down to a postal code. These days, its homepage carries the Deckard Technologies name and pitches municipalities and tourism boards. As for price, its pricing page lists a free plan with three months of history, then Basic at $19 a month with 12 months and Pro at $49 a month with 49 months, billed monthly for each market.
Can You Get Historical Airbnb Data by City?
Yes. BNBCalc Markets keeps about three years of history, with charts that go back up to 36 months. For a buying decision, though, I'd put the most weight on the latest 12 months, month by month, since those are the seasons your first year will run through. You'll find them on each market's Occupancy rate and Avg daily rate cards, which in most markets are free.
In BNBCalc's Boise market, a typical listing's occupancy ran from 33.0% in January 2026 to 65.4% in July, and its nightly rate from $156 in February to $226 in July.
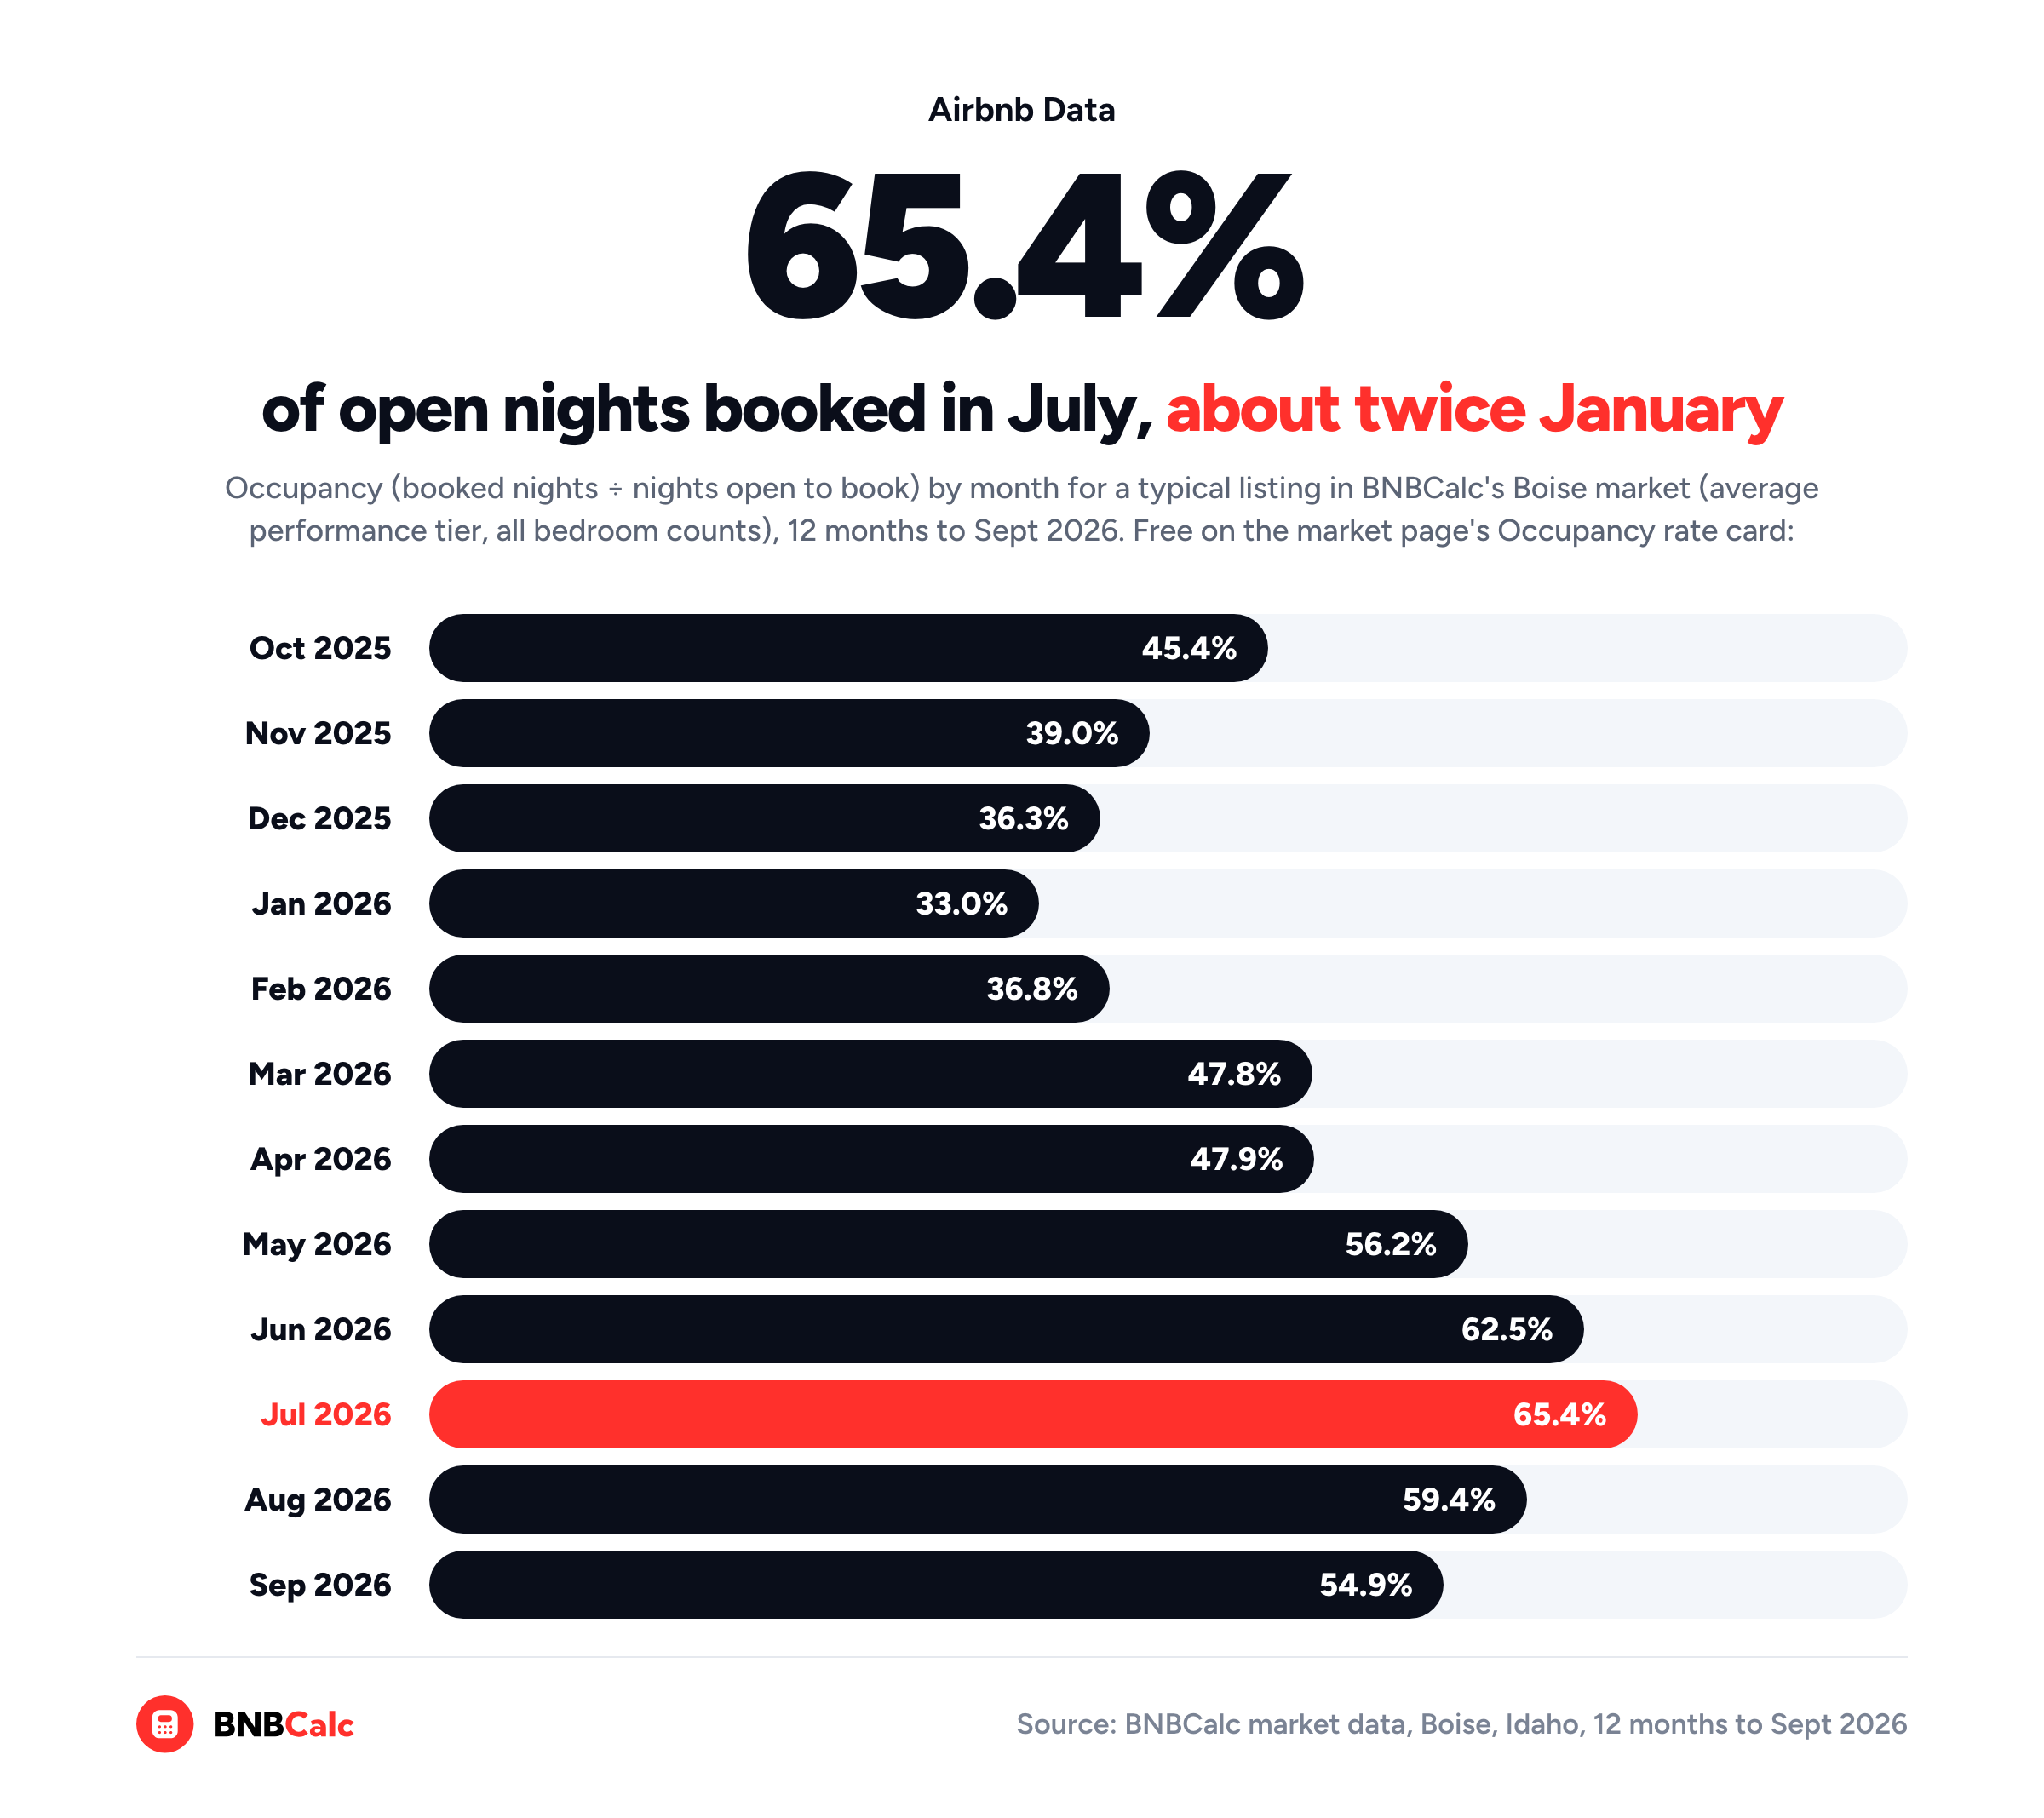
Make sure your numbers still work in months like January, when a typical listing there booked about a third of its open nights.
So, Where Should You Find Airbnb Market Data?
Start with BNBCalc's free pages. The state rankings screen US markets by gross yield, and each market page shows what its typical listing earned, which in BNBCalc's Boise market came to $37,359 over the 12 months to September 2026. When you need a bedroom count, a tier or individual listings, that's BNBCalc Markets, and once you've found a house, the Calculator inside it takes the address through your costs and your loan. And if you're building a tool or a spreadsheet that needs those numbers for a long list of addresses, the BNBCalc API returns each analysis as JSON for $0.20 a report, as of October 2026, without a Calculator or Markets plan. If you're not sure which one you need, BNBCalc's Help Center matches each tool to the data it gives you in How do I get Airbnb rental data like occupancy, revenue and nightly rates?
Whichever sources you end up using, check which listings each number covers, which months it covers and whether cleaning fees are in it before you set one source against another. Two honest sources can disagree about the same city for reasons that have nothing to do with the city.
Frequently Asked Questions
Where Can I Find Free Airbnb Market Data for a City?
BNBCalc's public pages are the place to start. Its state ranking pages list all 487 US markets it tracks, with nightly rate and occupancy for each and a gross yield and room potential for the 477 that have a matched home value. Each market page also shows its typical listing's figures without an account, including the gross yield in US markets. In BNBCalc's Boise, Idaho market, the typical listing earned $37,359 over the 12 months to September 2026, at 48.7% occupancy. In Austin, Tampa and Orlando, you can also open BNBCalc's pages for selected neighborhoods, such as South Tampa, without an account, and each one sets the area's yearly revenue, occupancy, nightly rate and gross yield against the whole market.
Where Can I Find Historical Airbnb Data by City?
BNBCalc Markets keeps about three years of history, and it shows each market's last 12 months, month by month, on the Occupancy rate and Avg daily rate cards, which you can see free in most markets. In BNBCalc's Boise market, the typical listing's occupancy ranged from 33.0% in January 2026 to 65.4% in July, so you can see how far the slow months fall before you buy.
How Much Does BNBCalc Markets Cost?
BNBCalc Markets costs $79 a month or $399 a year as of October 2026, and it includes the full BNBCalc Calculator, which is $30 a month or $199 a year on its own. You can run two property analyses free or start a 7-day free trial with full access, while the state rankings, the Broken Bow sample and part of every market page stay free.
Does BNBCalc's Market Data Include Vrbo and Cleaning Fees?
Yes to both. BNBCalc Markets covers Airbnb, Vrbo and Booking.com listings, and you can filter a market's listings by source. Its annual revenue and nightly rates include the cleaning fees guests paid and come before Airbnb's host fee, though the room potential behind its gross yield leaves cleaning out. Its occupancy counts only the nights a host left open, so keep that in mind when you compare it with another source.
BNBCalc Calculator Pricing and Free Analyses
When you've found a house worth a closer look, the BNBCalc Calculator costs $30 a month or $199 a year as of October 2026.
If you'd like to try it first, you can run two property analyses free, or start a 7-day free trial with full access.
On the other hand, if you don't know where to invest yet, use BNBCalc Markets to compare US markets by gross yield and see what the individual listings in each one earned.
Airbnb Tax Deduction Calculator
Paying too much in taxes? We have the perfect solution. Simulate an Airbnb home purchase below.
Purchase Price
$450K
Structure Value
70%
Apply Trump's Tax Cut (Bonus Depreciation)
Depreciation
$117,695
Interest
$21,600
Tax
$6,750
Year 1 Deduction
$146,045
Want to claim this deduction? Get a free cost segregation benefit analysis from CSA Partners — no obligation.
Get Full Analysis