
Free instant analysis
Reveal Airbnb revenue for any address or city
Where can you get a short-term rental market report for a city, and what should be in it? Well, you can get one free from BNBCalc, since every market it tracks has its own page that reads like a report. On BNBCalc's Knoxville, Tennessee market page, for example, a typical listing earned $40,085 over the 12 months to September 2026, booking 38.6% of the nights it was open at an average of $242 a night.
That headline is only the first page, though. A report you can plan around also breaks the market down by bedroom count and performance tier, shows how the year moves and sets revenue against what homes cost. Then it sends you to the rules for your address, since no market figure can settle those.
Let's start with where to get one and what you can see for free, then go through the sections it needs, and then read BNBCalc's Knoxville report one section at a time.
Where Can You Get a Short-Term Rental Market Report for a City?
I'd get it from BNBCalc Markets, since every one of its 2,300+ markets in 157 countries has its own page, laid out the same way, so once you've read one, you'll know your way around the rest. Part of each page is free, too, so even without an account you'll see a market's headline annual revenue and lead time, its gross yield in US markets and, in most markets, its occupancy and nightly rate, plus breakdowns of its listings.
Before you read any numbers, check which market they describe, since a city page, such as the one for Brandon, Florida, shows its parent market, with a line saying it's part of the Tampa market area. BNBCalc's state rankings are public as well, and one sample market, Broken Bow, Oklahoma, is fully unlocked, so you can see a complete report before you pay for anything.
The rest needs the Markets plan.
| Report section | Free market page | BNBCalc Markets |
|---|---|---|
| Revenue, occupancy and nightly rate | A typical listing, all bedroom counts together (occupancy and rate in most markets) | Every bedroom count and tier, over 12 months or 2 years |
| Gross yield | Shown for US markets, all bedroom counts together, labelled Current potential | By bedroom count and tier, in the Performance metrics by bedroom table |
| Performance metrics by bedroom table | Mostly locked | Every row, for each tier |
| Amenity revenue impact | The first row | Every row |
| Listings | Photos, nightly rates and ratings, with revenue and occupancy masked | Revenue and occupancy, plus each listing's detail panel |
| Operators | Names, with revenue masked | Each operator's revenue, and sorting |
The free page, then, tells you what a typical listing earns and, in the US, the market's gross yield, while Markets tells you what a listing your size earns, how the best ones do and how the yield changes from one size to the next.
Can You Download or Share a Market Report?
Inside Markets, a comp set is how you take the numbers with you. Save the listings you're tracking to one, then make it public and share the link, which opens even for someone who isn't signed in, or export it as a CSV file with each listing's revenue, nightly rate, occupancy and available nights. Keep in mind that the file's occupancy counts all 365 nights, so it reads lower than the app's, which only counts the nights a host left open.
If what you need is a report on one property, say for a lender or a partner, that's a job for the BNBCalc Calculator. It prints a full report or a one-page summary for an address, which you can save as a PDF, and paid plans can export the analysis to Excel.
What Should a Short-Term Rental Market Report Include?
Whichever market you're looking at, make sure its report covers these eight sections, because each one answers a question the headline can't. BNBCalc Markets covers the first seven, and the last column says where to find each one.
| Section | What it tells you | Where it is in BNBCalc Markets |
|---|---|---|
| The area covered | Which towns the averages take in | The market's outline on the US map |
| Revenue, occupancy and rate by bedroom count | What a listing your size earns | The bedroom selector and the Performance metrics by bedroom table |
| Performance tiers | How far the best listings pull ahead of a typical one | The Low, Average and High selector |
| Seasonality | Which months carry the year | The mini charts on the Occupancy rate and Avg daily rate cards (hover for each month) |
| Supply | How many listings of your size you'd compete with now | The Supply column in the Performance metrics by bedroom table |
| Gross yield | How room revenue compares with what homes cost | The Gross yield card and the bedroom table (US markets) |
| Amenities and competition | Which amenities go with higher revenue, and who you'd be up against | Amenity revenue impact and the Operators tab |
| The rules | Whether your address can be rented at all | Outside Markets: BNBCalc's regulation guides to start, then the city's or county's own rules |
Read the table top to bottom. The first row tells you what every average under it covers, while the rules can take a house off your list whatever the other rows say, so if you already have an address in mind, I'd check them first. For the whole research process around a report like this, our guide to Airbnb market research before you buy takes one market through it step by step.
How Much Does an Airbnb Make in Knoxville, Tennessee?
Now let's read BNBCalc's Knoxville report one section at a time, using the market page's own figures for the 12 months to September 2026 and nothing from individual listings.
What Do the Headline Cards Say?
Knoxville's free page opens on its headline cards. When I checked them on October 21, 2026, BNBCalc's cards read $40.1k in annual revenue (actual), 39% occupancy, a $242 nightly rate, a 10.4% gross yield and a 36-day lead time, which means guests booked about five weeks ahead on average. The revenue and the nightly rate both include the cleaning fees guests paid, while the gross yield leaves cleaning out.
Those cards describe BNBCalc's average performance tier across every bedroom count, which is what I mean by a typical listing.
With Markets, you can also switch the performance selector to All. That averages every listing in the market, slow ones included, so annual revenue comes to $36,689 instead. Both figures are right. Our guide to what Airbnbs in your area earn sets those cuts side by side, so make sure you know which one you're quoting.
How Much Does Each Bedroom Count Earn in Knoxville?
With Markets, the bedroom selector and the Performance metrics by bedroom table are where the report starts to describe the house you'd buy.
| Bedrooms (typical listing) | Annual revenue | Occupancy | Nightly rate (ADR) |
|---|---|---|---|
| 1 | $22,234 | 40.2% | $132 |
| 2 | $33,153 | 43.7% | $180 |
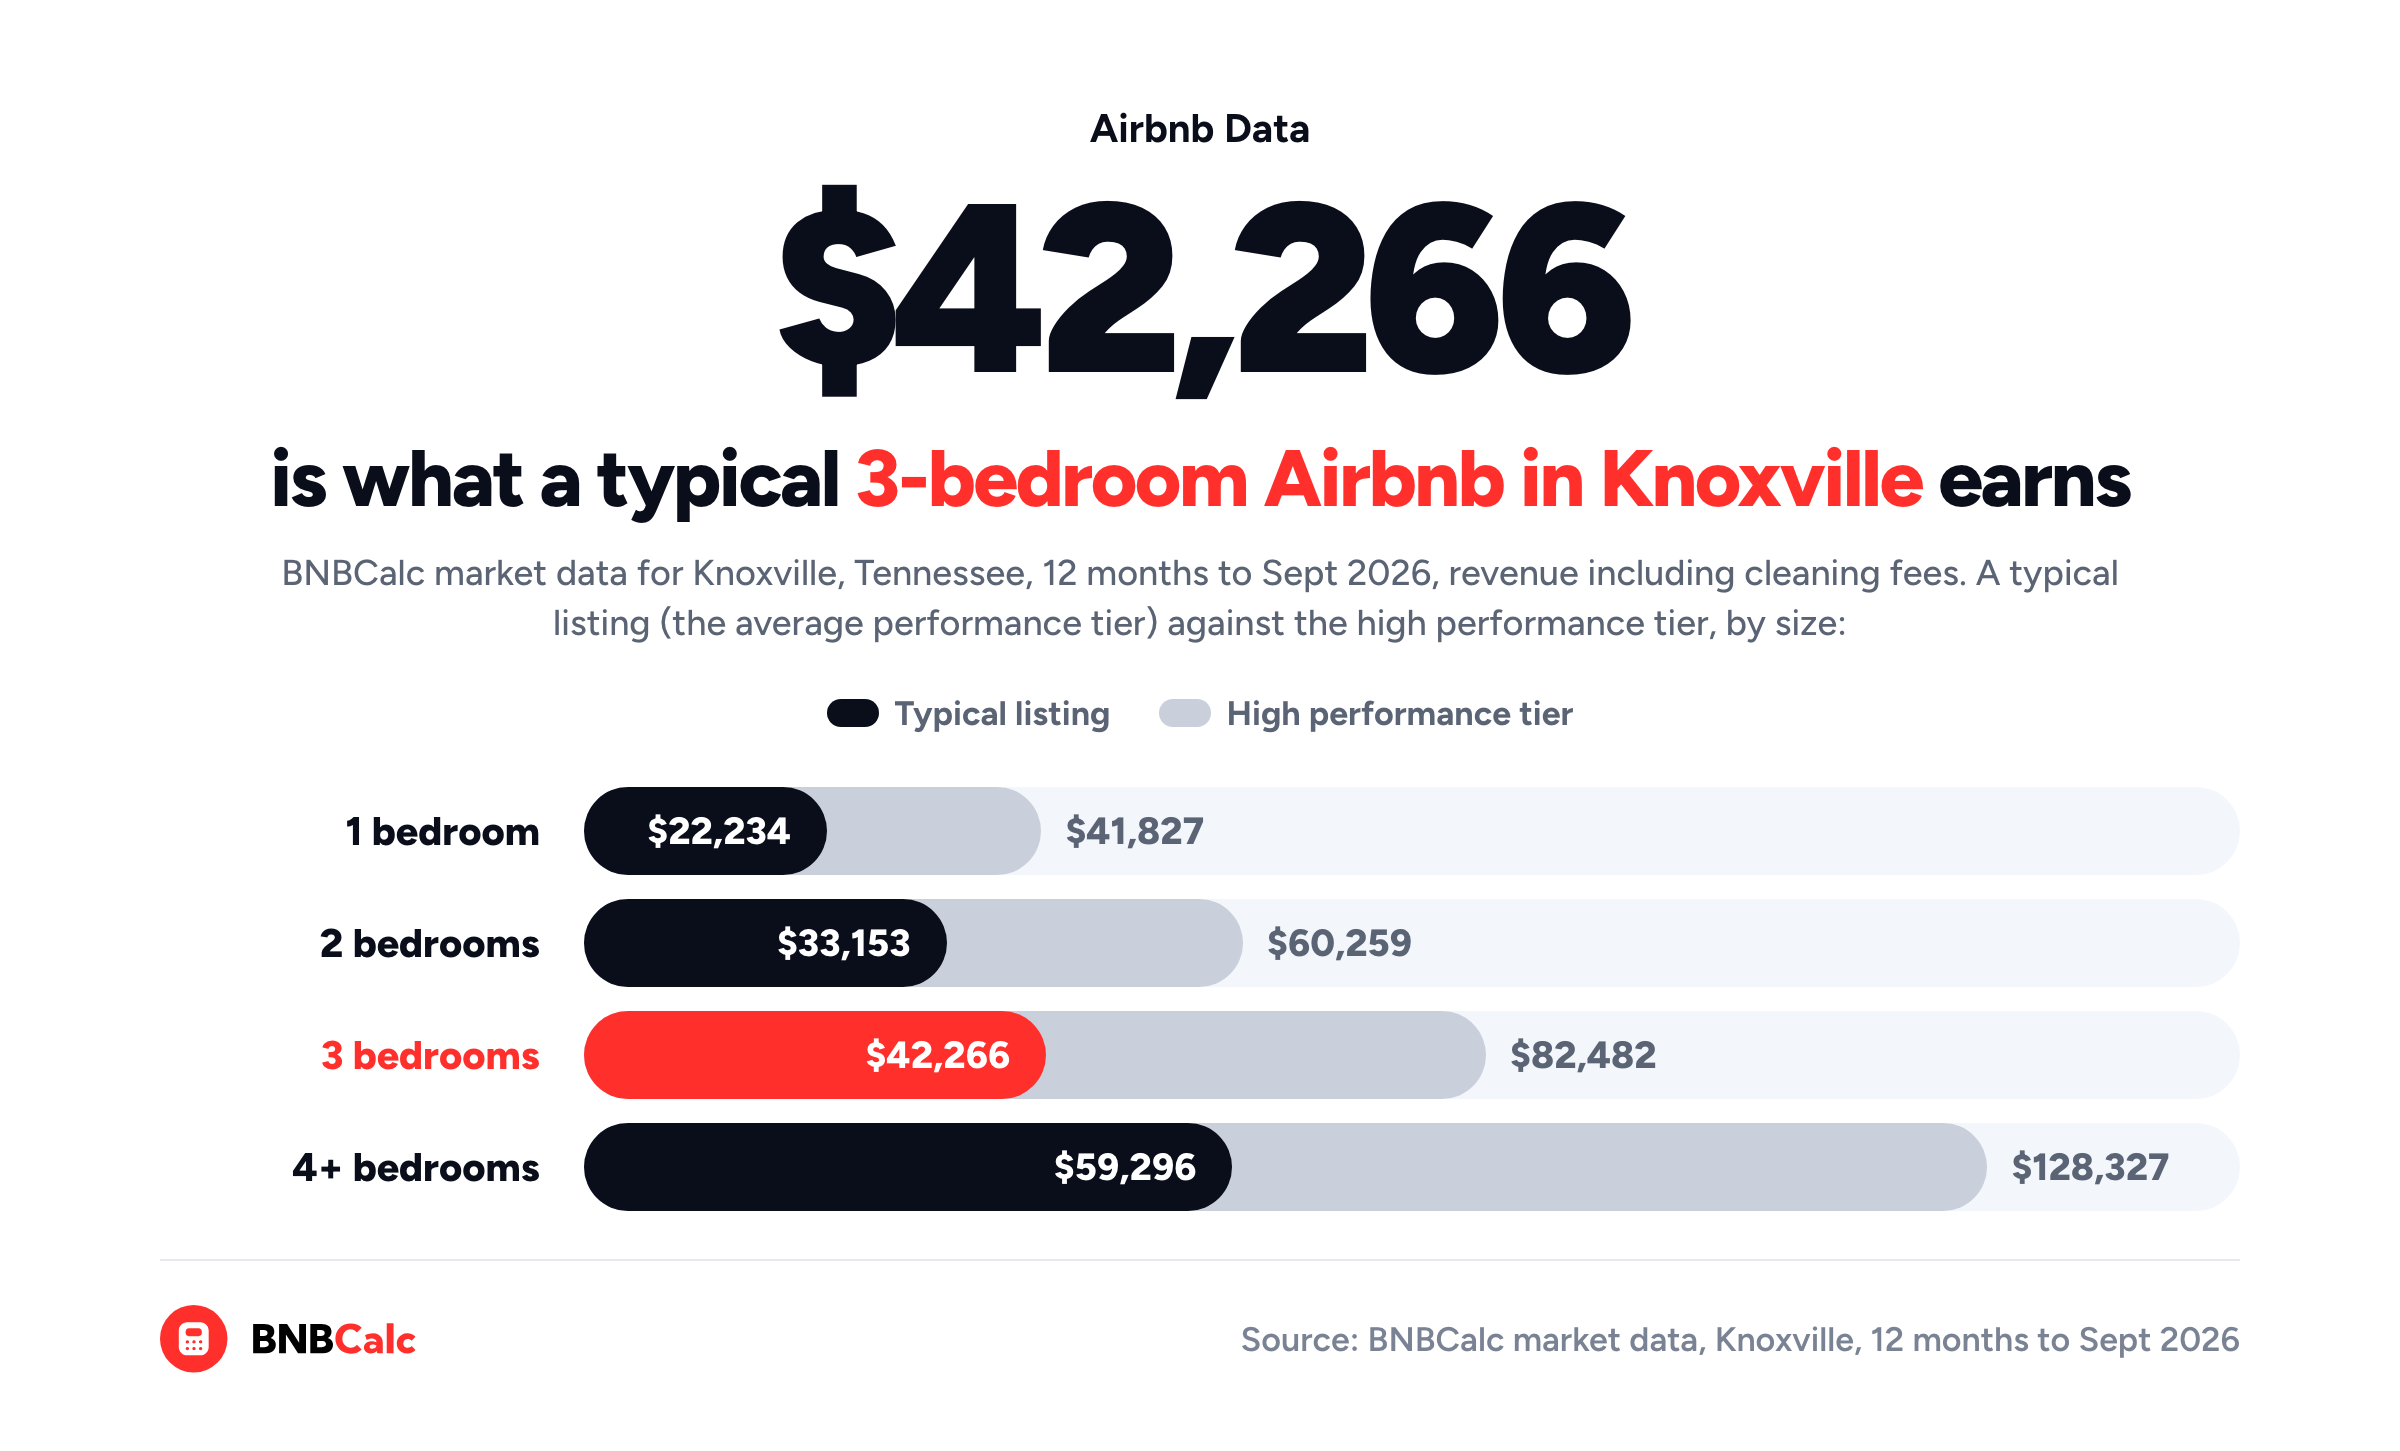
| 3 | $42,266 | 40.4% | $237 |
| 4+ | $59,296 | 33.0% | $431 |
Source: BNBCalc market data, Knoxville, Tennessee, average performance tier, 12 months to September 2026; revenue and the nightly rate include cleaning fees.
Each row is one bedroom count, and each step up in size came with about $9,000 to $17,000 more a year, from $22,234 for a one-bedroom to $59,296 for four or more. Occupancy dips at the top, however. Four-bedrooms booked 33.0% of their open nights, the lowest from one bedroom up, while charging the highest nightly rate, at $431.
How Much More Do Top-Performing Airbnbs Make in Knoxville?
If you switch the performance selector, each size splits into BNBCalc's low, average and high performance tiers. For three-bedrooms, the low tier earned $16,798 and the high tier $82,482, nearly twice the typical $42,266, and from one bedroom up, the high tier earned between 1.8 and 2.2 times what a typical listing did. That spread is the room a well-run listing has to grow.
What's the Gross Yield on an Airbnb in Knoxville?
Gross yield is where a report sets what homes could earn against what they cost, and BNBCalc shows it without an account. Knoxville's card, the 10.4% labelled Current potential, puts it third of the 12 markets on BNBCalc's Tennessee page.
That figure is worked out home by home. For each eligible home, BNBCalc divides the annual room-revenue potential, meaning what the home could earn if it were bookable all year with cleaning income left out, by a home value matched to its ZIP code and bedroom count. The card then shows the median of those yields. That's also why it won't equal the $40.1k revenue card divided by a home value, since that card is actual revenue with cleaning fees in it.
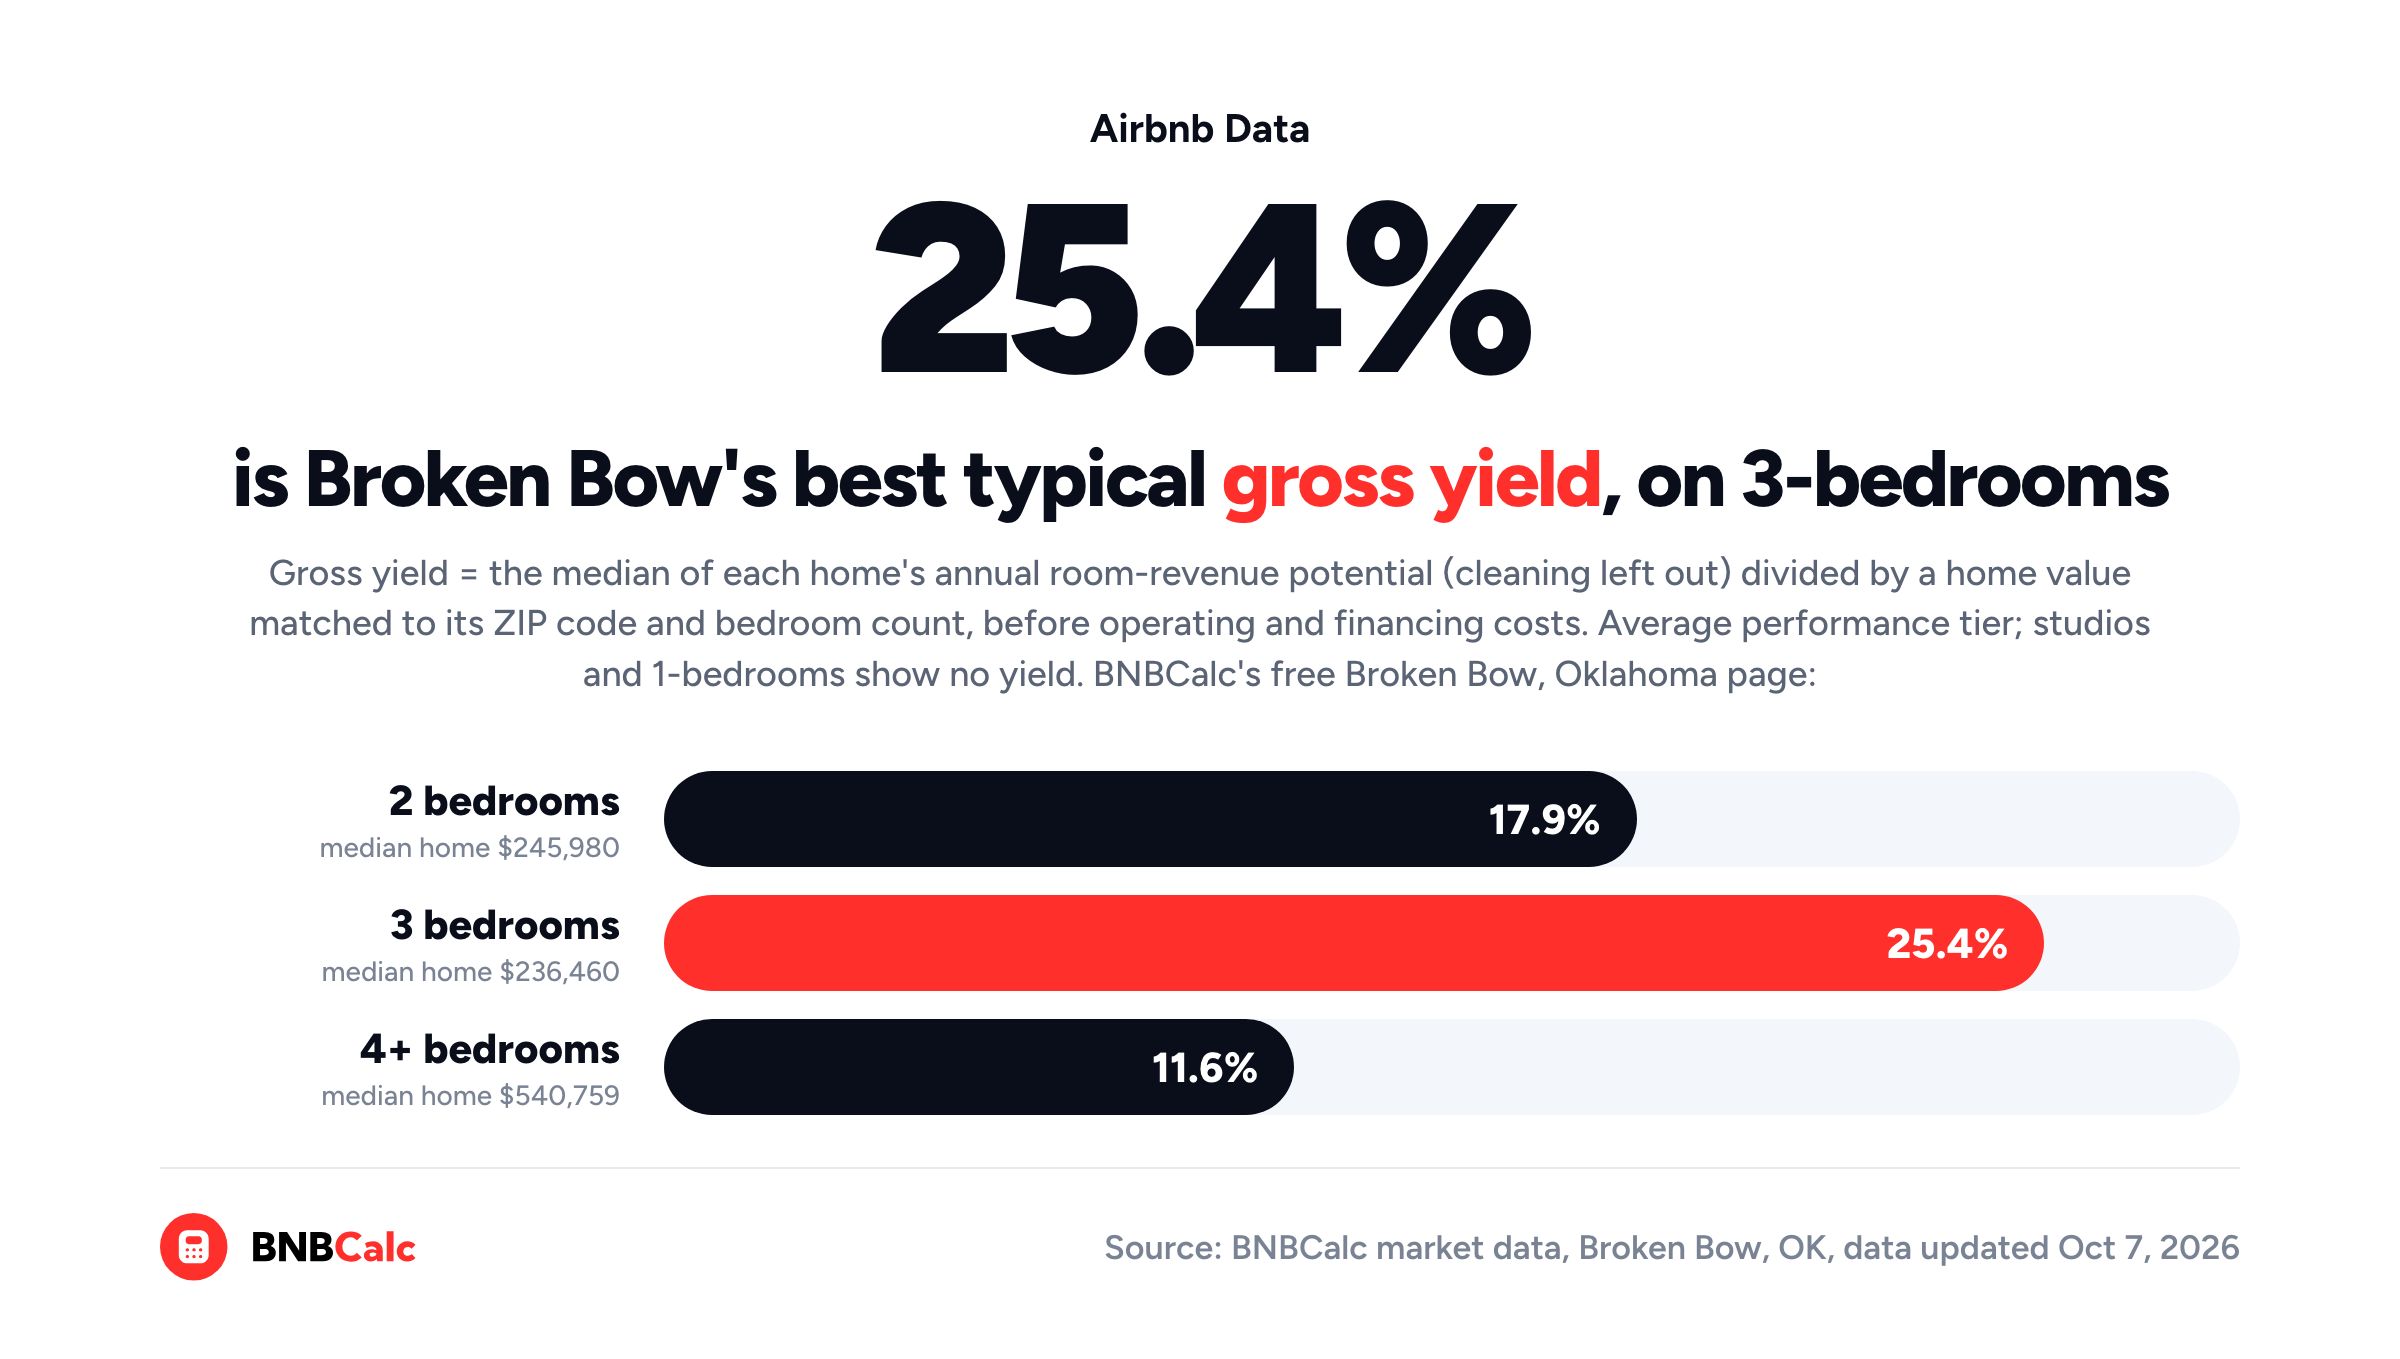
Which size gives you the most room revenue for the money, then? In Knoxville, the answer sits in the Performance metrics by bedroom table, which needs the Markets plan, so let's borrow Broken Bow, Oklahoma, the sample market BNBCalc unlocks for everyone. On BNBCalc's free Broken Bow page, three-bedrooms reach a 25.4% gross yield and two-bedrooms 17.9%, while four-bedrooms drop to 11.6%, and studios and one-bedrooms show no yield at all.
Four-bedrooms there have the most room potential, a median of $62,913, but the median four-bedroom home is valued at $540,759, more than twice a three-bedroom's $236,460, and that pulls their yield down.
Keep in mind that gross yield comes before any operating or financing costs. BNBCalc's figure also uses the home value matched to each home's ZIP code and bedroom count, so if you're paying less than that, your own yield on the price will come out higher.
How Do You Read Seasonality, Supply and Amenities?
Three more parts of the Marketwide Stats tab fill in what the yearly figures can't. First, the mini charts on the Occupancy rate and Avg daily rate cards show each of the last 12 months when you hover them. Compare the months with each other for how far the slow ones fall below the busy ones, since a fixed loan payment doesn't change with the season.
Second, the Supply column in the Performance metrics by bedroom table shows how many listings of each size are active now. Note it for your bedroom count and recheck it every few months against the Occupancy rate card, because supply that keeps climbing while occupancy slips means new listings are splitting the same guests.
Third, there's the Amenity revenue impact table. It compares similar listings in the market to estimate how much more the ones with a given amenity earn.
Knoxville's free page shows it for all bedroom counts together, and when I checked on October 16, its first row read Hot Tub, +16%, $6,414 a year. That dollar figure is the typical listing's annual revenue times the lift, or $40,085 × 16% = $6,414. The other rows open with Markets.
Can You Legally Run an Airbnb in Knoxville?
Unfortunately, no market report can tell you whether one specific address can be rented, and in Knoxville that decides a lot.
The City of Knoxville's short-term rental FAQ was last updated in October 2022. As of October 16, 2026, when I read it, it says that in residentially zoned districts, short-term rentals are "allowed at the owner's principal residence."
That means if you won't live in the house, you can only get a permit in a non-residential district whose zoning still allows residential use, so on an ordinary residential street, the market's numbers may not apply to you at all. On top of that, a person or company can only hold two of those permits at once, citywide, and you'll need one before you advertise.
Those are the city's own rules, so if the house sits outside Knoxville's city limits but inside the market's area, check that town's or county's rules instead.
BNBCalc's Knoxville regulation guide walks through both permit types and their fees. On the tax side, Airbnb's Tennessee tax page says, "All locally imposed Occupancy Taxes will be collected on reservations in Tennessee."
What Should You Watch Out for When Reading a Market Report?
Even with every section in front of you, two habits can still steer you to the wrong number.
The first is setting a market-page figure beside a listing-level one. Each listing's detail panel in BNBCalc Markets covers that listing's own past 12 months, while the market's cards are built from monthly figures across the whole market, so the two are calculated differently and won't line up. That's why it's safer to compare listings with listings, and tiers with tiers.
The second is trying to rebuild the revenue figure from the nightly rate and occupancy. A market's cards are averages across many listings and months, and averages don't multiply that way, so take the revenue figure as the report gives it.
So, Where Can You Get a Short-Term Rental Market Report for a City?
You can start with a free BNBCalc market page for any of its 2,300+ markets, since it shows a typical listing's headline revenue and a gross yield for US markets. In Knoxville, BNBCalc's figures came to $40,085 over the 12 months to September 2026 and a 10.4% gross yield.
For the sections that decide a purchase, the bedroom table, the performance tiers, gross yield by size and the full amenity table, open the same market in BNBCalc Markets, and then check the rules for your address before any of it counts.
Still, every market report describes homes that are already listed. None of them is your house. Read each figure, then, as a question about the one you'd buy: would it land with the typical listings or the top ones, and would its address let you rent it at all?
Frequently Asked Questions
Where Can I Get a Free Short-Term Rental Market Report for a City?
BNBCalc's market pages are free to view without an account. Each one shows a market's headline annual revenue and lead time and, in most markets, its occupancy and nightly rate for the past 12 months, plus its gross yield in US markets. In Knoxville, Tennessee, for example, a typical listing earned $40,085 over the 12 months to September 2026, and BNBCalc's Gross yield card reads 10.4%. The Broken Bow, Oklahoma market is fully unlocked as a sample, and BNBCalc Markets opens every bedroom count and tier in the others, plus each market's active listings.
What Should a Short-Term Rental Market Report Include?
The Marketwide Stats tab in BNBCalc Markets is a good model: revenue, occupancy and nightly rate by bedroom count and performance tier, revenue month by month, supply, gross yield on home values and what amenities add. BNBCalc's free Broken Bow, Oklahoma page, for example, shows three-bedrooms with the highest typical gross yield, at 25.4%, against 11.6% for four or more bedrooms. Check the rules for your address separately, since no report can settle them.
Can You Download a Short-Term Rental Market Report From BNBCalc?
In BNBCalc Markets, you can save the listings you're tracking to a comp set. Then you can export it as a CSV file with each listing's revenue, nightly rate, occupancy and available nights, or make it public and share the link. The CSV's occupancy counts all 365 nights, so it reads lower than the app's figure. For a single property, the BNBCalc Calculator prints a full or one-page report you can save as a PDF.
How Much Does an Airbnb Make in Knoxville, Tennessee?
In BNBCalc Markets, a typical Knoxville listing earned $40,085 over the 12 months to September 2026: $22,234 with one bedroom, $33,153 with two, $42,266 with three and $59,296 with four or more. Those figures include cleaning fees and come before Airbnb's host fee and your costs. Markets shows the low and high performance tiers too, and Knoxville's high-tier three-bedrooms earned $82,482.
BNBCalc Markets Pricing and Free Trial
When you're ready to open the full report for your own market, BNBCalc Markets is $79 a month or $399 a year as of October 2026, and it includes the full BNBCalc Calculator. You can compare the plans, run two property analyses free, or start a 7-day free trial with full access.
Airbnb Tax Deduction Calculator
Paying too much in taxes? We have the perfect solution. Simulate an Airbnb home purchase below.
Purchase Price
$450K
Structure Value
70%
Apply Trump's Tax Cut (Bonus Depreciation)
Depreciation
$117,695
Interest
$21,600
Tax
$6,750
Year 1 Deduction
$146,045
Want to claim this deduction? Get a free cost segregation benefit analysis from CSA Partners — no obligation.
Get Full Analysis