
Free instant analysis
Reveal Airbnb revenue for any address or city
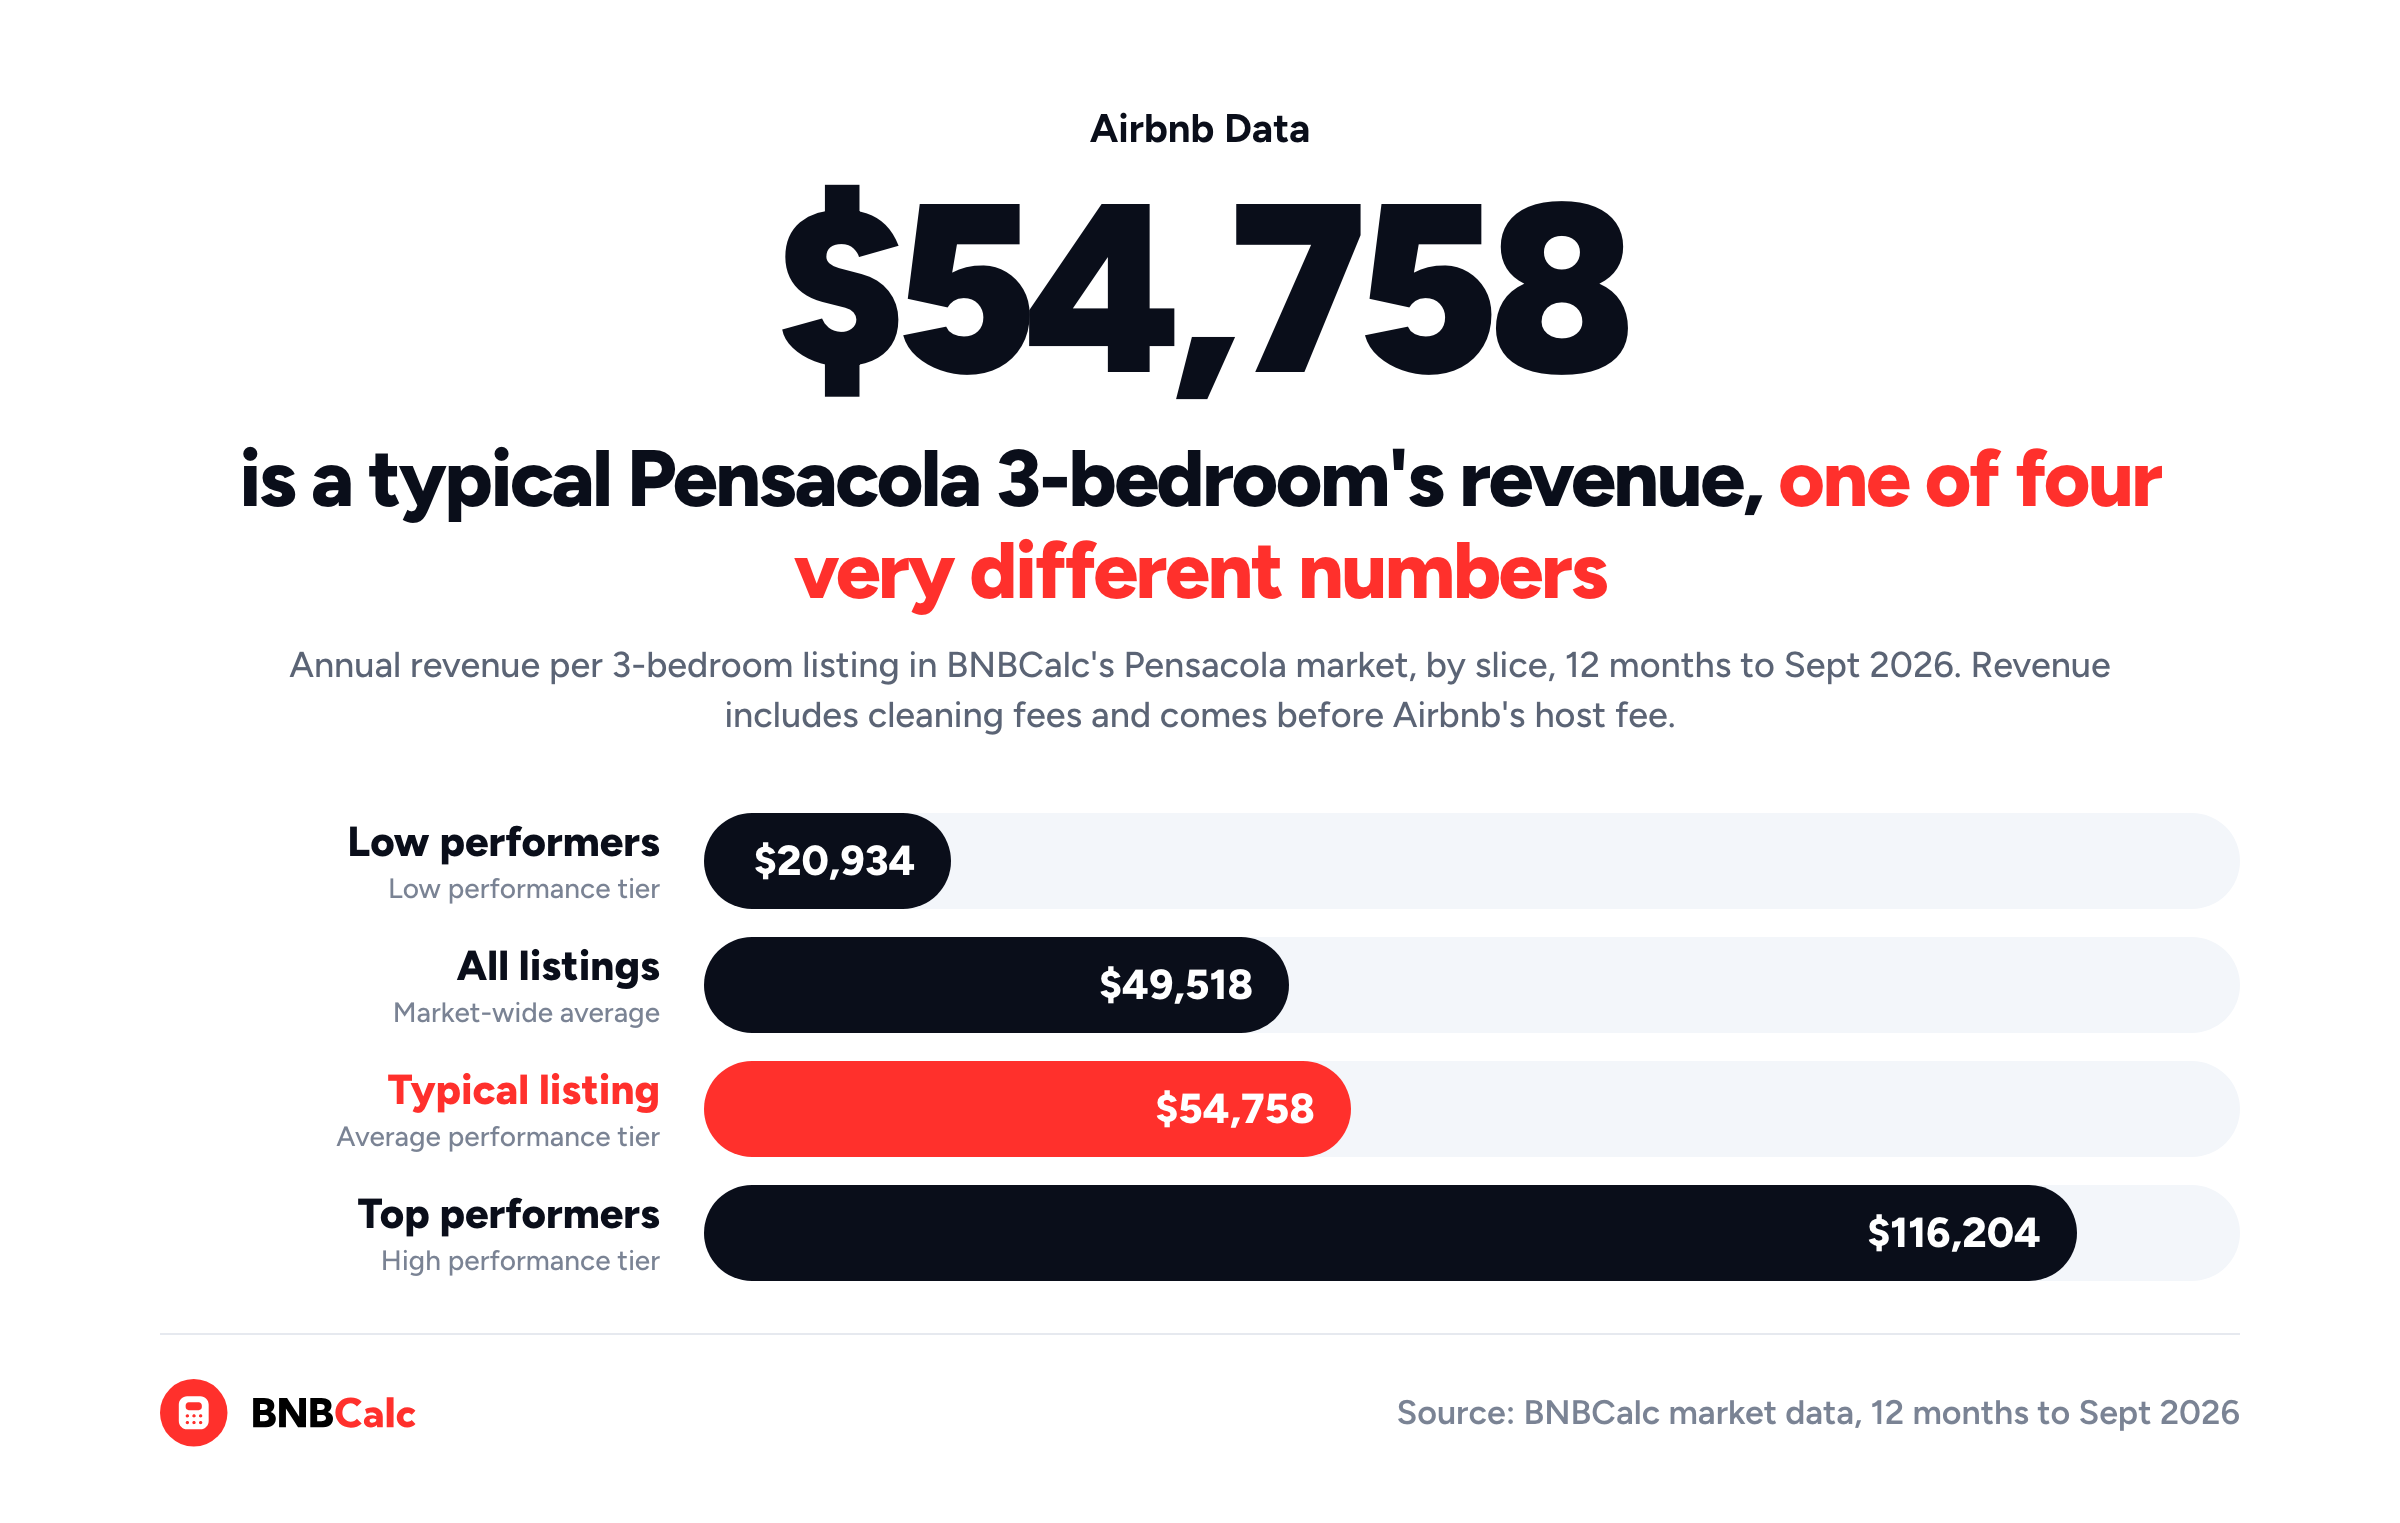
Should you analyze an Airbnb deal in a spreadsheet or in analysis software, and when does the spreadsheet stop being enough? Well, a spreadsheet is fine for one deal you already understand, but its revenue line is only as good as the comps behind it. In BNBCalc's Pensacola market, for example, a typical three-bedroom earned $54,758 over the 12 months to September 2026, while low performers averaged $20,934 and top performers $116,204.
A sheet will carry whichever of those you type in all the way down to the bottom line. On the same house at the same price, that one cell is the difference between losing $15,308 in year one and keeping $10,309.
I'll walk through where an Airbnb spreadsheet breaks, what the BNBCalc Calculator does at each of those points, and then one Pensacola house from revenue to cash flow.
Is a Spreadsheet Good Enough for Airbnb Deal Analysis?
For one deal you already understand, I'd say it often is. A spreadsheet costs nothing extra if you use one anyway, and it'll model any line you can write a formula for. You can see every formula, too. It suits a house you own that has a year of bookings behind it, say, or a quick loan test on revenue you trust.
Whether a paid tool earns its keep beyond that is a separate question, and BNBCalc's guide to whether paid Airbnb analytics tools are worth it works it through with numbers.
The trouble starts when the sheet has to supply the numbers as well, since it can't tell you what a house will earn, what its insurance should cost or how deep its quiet months run. That's why I'd stop treating a spreadsheet as the source of your numbers the moment you need comps behind the revenue line, you're weighing more than one deal, or someone else has to read the numbers and trust them.
Where Does an Airbnb Spreadsheet Break, and What Does the BNBCalc Calculator Do Instead?
There are six places where a deal spreadsheet tends to break, and the BNBCalc Calculator has a part built for each. Let's take them in the order you'd build the deal.
Airbnb Revenue: Comps Instead of a Typed-In Guess
The BNBCalc Calculator starts where a spreadsheet can't, with the address. Give it the address or a Zillow link, check the bedrooms, bathrooms and guests, and it pulls up to 50 comparable listings nearby, with each one's revenue, nightly rate and occupancy.
If the property's in the US, you can then switch to AI Underwriter. It reviews each comp's photos, layout and amenities against the house, keeps about five of the closest matches, never more than eight, and sets your revenue at the median of the comps it kept. Along the way, it tells you why it kept or left out each one, and BNBCalc's launch post explains what AI Underwriter looks at.
Or, if you'd rather choose the set yourself, you can untick any comp, tick a left-out one back in or type your own figure into Manual revenue input.
In a spreadsheet, by contrast, the revenue line is whatever you typed, and that's the cell I'd worry about most, more than any formula. In BNBCalc's Pensacola data, for example, top-performing three-bedrooms averaged more than five times what low performers did over the same 12 months, while the typical listing, BNBCalc's average performance tier, sat in between.
Before a figure goes into any sheet, then, you'll want to know which listings it came from, and BNBCalc's guide to running Airbnb comps by hand shows you how to check them.
Airbnb Seasonality: Planning for the Slow Months
The Calculator's annual estimate comes from comparable listings' full-year figures, so the slow months come in with the busy ones. A spreadsheet, by contrast, only knows the numbers you type into it, so if your yearly figure leans on a few good months, nothing in the sheet will flag it.
On top of that, the Calculator's Seasonality card adds a cash-flow planning view, where the Profit tab draws your monthly break-even, meaning your operating expenses plus your mortgage and taxes, as a dashed line. Most of that line, the mortgage, property tax and running costs, comes due whether guests book or not.
To find the quiet months themselves, I'd open the market in BNBCalc Markets and read the last 12 months on the mini charts of its Occupancy rate and Avg daily rate cards. Then make sure your cash reserve can carry the house through them.
Airbnb Expenses: Every Cost Line Filled In
Next, the Calculator fills in every operating expense line with a starting value, from utilities and insurance to cleaning and Airbnb's host fee. It takes that fee out at 15.5% by default, the rate Airbnb's service-fee page says most hosts on its single fee pay.
For numbers specific to the house, its Estimate with AI button proposes values field by field, each with its source and a confidence level, and you tick the ones to apply. Once you've settled on your own assumptions, I'd save them as a preset and set it as your default, so every new analysis starts from the same costs.
A spreadsheet template can hold your own assumptions too, of course. What it can't do is propose a number for each new house, with a source you can check, so it's on you to notice when the insurance from your last deal doesn't fit this one.
Airbnb Financing: Change the Loan and Every Return Updates
In the Calculator's Mortgage & Taxes editor, you set the price, percent down, loan length, rate and property tax, and below 20% down it switches mortgage insurance on for you. From there, the report runs the loan through to cash flow, cash-on-cash return, cap rate and DSCR, and the Calculator handles four kinds of deal in all: buying, a house you already own, rental arbitrage and co-hosting.
Then again, a spreadsheet shines on financing, because it'll take any loan structure you can build in a formula. Even so, each new structure means another payment formula and amortization schedule to keep straight, while the Calculator recalculates every return once you apply a new loan. BNBCalc's guide to calculating Airbnb ROI shows how each of those returns is worked out.
Sharing an Airbnb Analysis With a Partner or Lender
When a partner or lender has to read the deal, the Calculator's Share button gives you a link anyone can open without signing in, comps table included. They can try their own numbers on screen, but nothing they change is saved.
If they'd rather have a document, Print lets you pick a full report or a one-page summary, add your contact card and a cover note, and save it as a PDF.
A spreadsheet doesn't travel as well. Email one around, and every reply can come back as a new version with somebody's edits in it.
Comparing Airbnb Deals on One List
Every analysis you run lands on the Properties page of your BNBCalc dashboard, where you can sort them by cash-on-cash return, cap rate, annual profit, annual revenue, cash needed or purchase price, or see them as pins on a map. If they all started from the same default presets, that ranking compares the houses themselves.
In a spreadsheet, ten deals often means ten tabs, and once the cleaning cost changes on one tab and not the others, the ranking starts comparing your assumptions instead of the houses.
What Does a 3-Bedroom Airbnb in Pensacola Make After Costs?
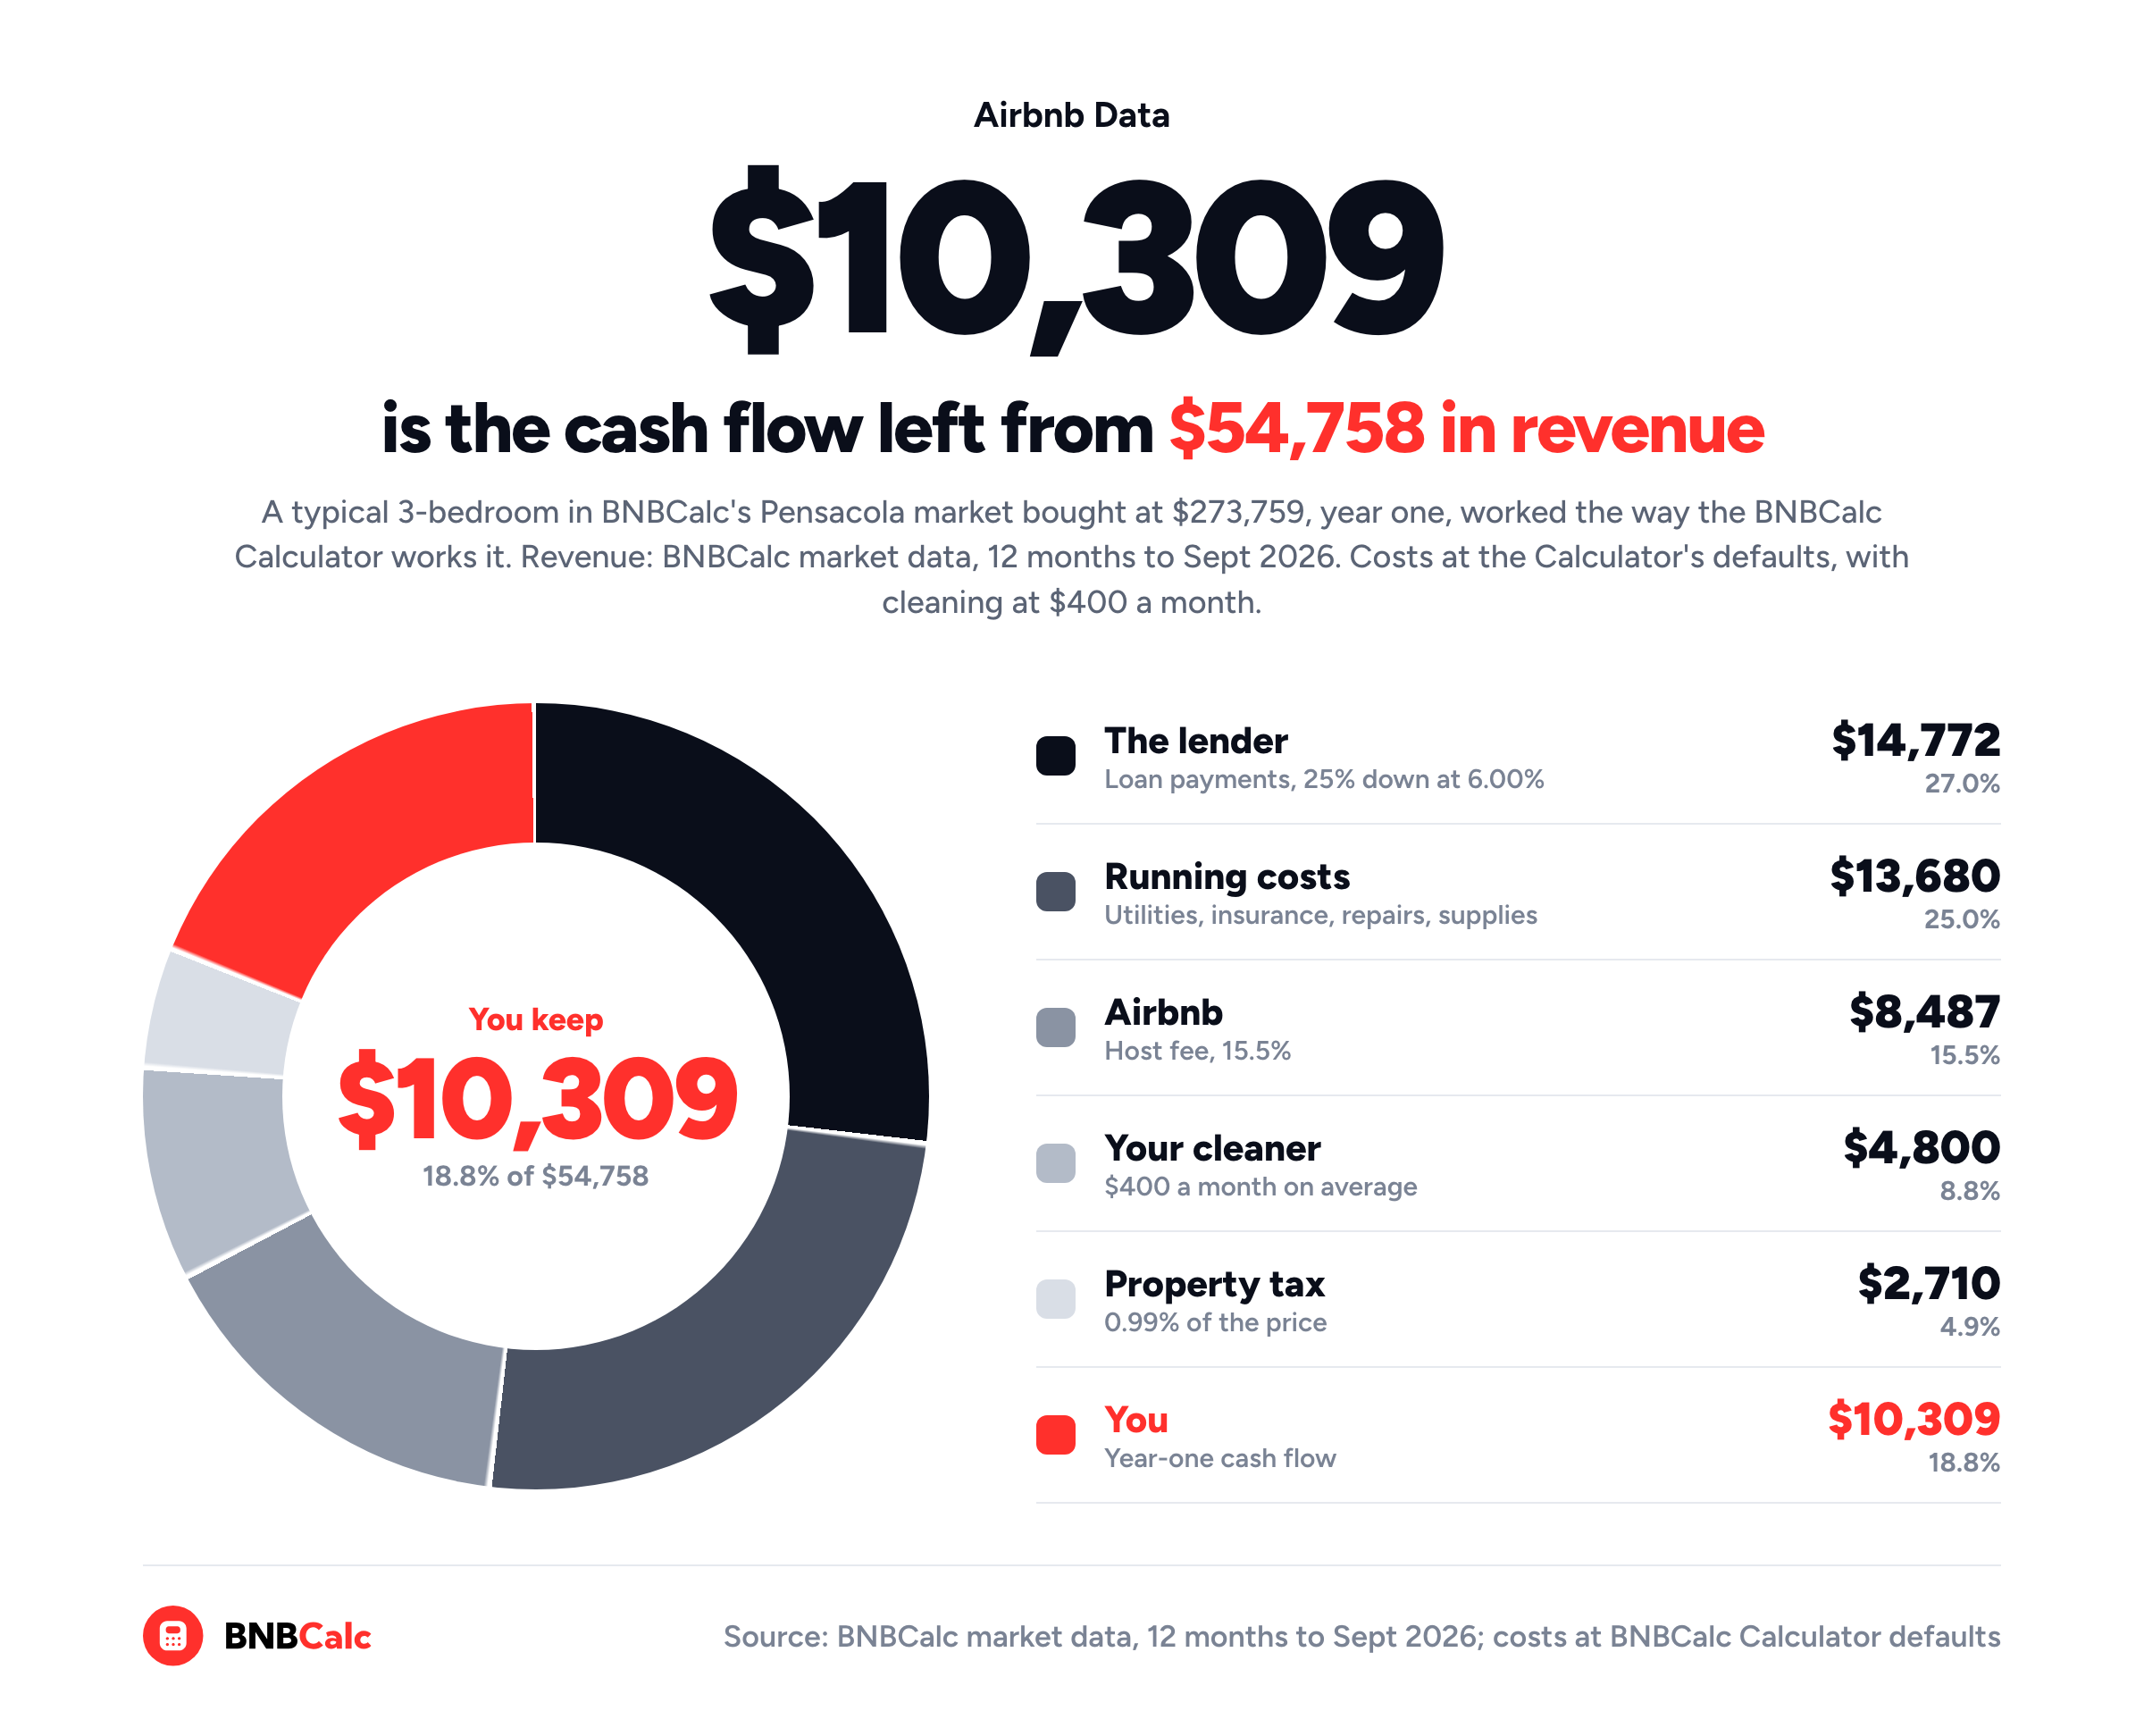
Let's put one house through it. Say you buy a typical three-bedroom in BNBCalc's Pensacola market for an illustrative $273,759, and it earns the typical $54,758 a year.
Keep in mind that a BNBCalc market covers a region rather than a city limit, and about six in ten of the market's listings sit in ZIP code 32507, most of them out on Perdido Key. On a real address, I'd check the house against its own comps, but this example has none, so I've typed $54,758 into Manual revenue input in place of a comps estimate.
I've also assumed the house can rent short term all year, since Florida's statute says a local law "may not prohibit vacation rentals or regulate the duration or frequency" of renting one, unless it was adopted on or before June 1, 2011. The law limits local governments, not your HOA or condo association, so you'll still need a state vacation rental license and a check of the zoning and any HOA or condo rules, which BNBCalc's Escambia County guide covers.
The Inputs
| Input | Value | Source |
|---|---|---|
| Purchase price | $273,759 | Illustrative |
| Revenue | $54,758 a year, cleaning included | BNBCalc market data, typical listing, 12 months to Sept 2026 |
| Airbnb host fee | 15.5% of revenue | Calculator default |
| Cleaning | $400 a month on average | Illustrative |
| Running costs | $1,140 a month | Calculator defaults: $440 utilities, $700 insurance, repairs, supplies and the like |
| Management and lodging tax | 0% | Calculator defaults; in Escambia County, guests pay lodging taxes on top of the rate |
| Property tax | 0.99% of the price a year | Calculator default |
| Loan | 25% down; 30-year fixed at 6.00% | 6.00% is the Calculator's default rate, and 25% down is illustrative; Freddie Mac's survey average was 7.40% as of October 15, 2026 |
| Closing and furnishing | 3% of the price; $8,500 | Calculator defaults ($2,000 a bedroom, $250 a bathroom with two assumed, $2,000 a living space) |
| Growth | 3% a year, home value and revenue | Calculator defaults |
Look at the Source column. One input comes from BNBCalc's data, most of the rest are the Calculator's defaults, and only the price, the cleaning and the loan are my own choices, whereas in a spreadsheet every row would be a number you'd typed. On a real house, I'd still swap in real quotes, starting with insurance this close to the Gulf.
The Results
| Line | Year one | How it's figured |
|---|---|---|
| Revenue | $54,758 | BNBCalc typical listing, cleaning included |
| Airbnb host fee | -$8,487 | 15.5% of revenue |
| Cleaning | -$4,800 | $400 a month |
| Running costs | -$13,680 | $1,140 a month |
| Operating income | $27,791 | Revenue minus $26,967 of operating expenses |
| Mortgage & Taxes | -$17,482 | $14,772 of loan payments ($1,230.99 a month on $205,319) + $2,710 property tax |
| Profit (Cash Flow) | $10,309 | Operating income minus Mortgage & Taxes |
| Cash Investment | $85,153 | $68,440 down + $8,213 closing + $8,500 furnishing |
Read it top to bottom, the way the Calculator's Profit box runs, with property tax counted in Mortgage & Taxes rather than operating expenses. The house keeps $10,309, about $859 a month, on $85,153 of cash in.
The Calculator's Cash on Cash Return adds a year of revenue growth before it divides, $1,643 at its 3% default, so ($10,309 + $1,643) ÷ $85,153 = 14.0%, or 12.1% with Revenue Appreciation at 0%. The cap rate is $27,791 ÷ $273,759 = 10.2%, and a DSCR of 1.59 reads Strong.
What Happens If the Revenue Line Comes From the Wrong Listings?
Now for the cell a spreadsheet can't check. Take the same house, price, loan and costs, and swap in a revenue line from each slice of BNBCalc's Pensacola three-bedroom data.
| Revenue line taken from | Revenue | Year-one cash flow |
|---|---|---|
| Low performers | $20,934 | -$15,308 |
| All listings (market-wide average) | $49,518 | $6,340 |
| Typical listing | $54,758 | $10,309 |
| Top performers | $116,204 | $56,844 |
Only the revenue changes, along with the host fee and cleaning that scale with it. Even so, the cash flow swings from a $15,308 loss to a $56,844 gain.
In other words, each $1,000 the revenue line is off moves cash flow by about $757, and below $41,147 a year, about a quarter under typical, the house's year-one cash flow turns negative. That's why, on a real house, I'd build the revenue line from its own comps in the BNBCalc Calculator rather than a market figure or a guess, and once the report fits the house, I'd use it as my baseline.
Can You Export a BNBCalc Analysis to Excel?
Yes, and it's how you keep a spreadsheet on top without letting it supply the numbers. The Excel button in the report's toolbar downloads the analysis on the Calculator plan, which Markets includes. It works during the 7-day free trial too.
You get a single sheet. It holds the key metrics, revenue and expenses (some as live Excel formulas), projections for years one, five and ten, the return metrics, the comparable listings the analysis pulled and your assumptions.
From there, it's your sheet.
Add the lines only your deal has, like a second loan or a partner's profit split, or copy a few columns to test what-ifs side by side. As with any sheet someone else built, check the formulas you'll lean on, and keep the BNBCalc report as the version you share.
And if you'd rather have the numbers arrive in your sheet without exporting each report, and you're comfortable with a little code, the BNBCalc API returns the same kind of analysis as JSON for $0.20 a report, as of October 2026, with no Calculator plan needed.
So, When Should You Stop Using a Spreadsheet for Airbnb Analysis?
I'd stop using it as the source of your numbers once the revenue line needs comps, once you're comparing more than one deal, or once someone else has to read it. On a typical three-bedroom in BNBCalc's Pensacola market, the revenue line alone moved year-one cash flow from a $15,308 loss to a $56,844 gain, depending on which listings it came from.
So run the address through the BNBCalc Calculator, adjust the comps and costs until the report fits the house, and export it to Excel if you'd like a sheet on top.
Whatever you use, the number that decides a deal is rarely the one with the most complicated formula behind it. It's usually the simplest cell on the page, the one somebody typed in.
Frequently Asked Questions
Is a Spreadsheet or Software Better for Analyzing an Airbnb Deal?
For the numbers a deal depends on, the BNBCalc Calculator, because it builds the revenue line from up to 50 comparable listings near the address and fills in the expenses and the loan, with an Excel export if you want a sheet on top. In BNBCalc's Pensacola data, the revenue line alone moved the same three-bedroom's year-one cash flow from a $15,308 loss to a $56,844 gain.
Which BNBCalc Plan Includes the Excel Export?
The BNBCalc Calculator plan does, and so does Markets, which includes the Calculator. Its Excel button downloads your analysis as a one-sheet spreadsheet you can build on, with the key metrics, your assumptions and projections for years one, five and ten. It works during the 7-day free trial too.
Can You Try Airbnb Analysis Software for Free?
Yes. You can run two property analyses free in the BNBCalc Calculator, or start a 7-day free trial with full access. Each analysis starts from up to 50 comparable listings near the address, fills in operating expenses at the Calculator's defaults and runs your loan through to cash flow, cash-on-cash return and cap rate.
How Do You Compare Several Airbnb Deals Side by Side?
Run each house through the BNBCalc Calculator, then open the Properties page in your dashboard, which sorts every analysis you've run by cash-on-cash return, cap rate, annual profit, annual revenue, cash needed or purchase price. Set your expense and mortgage presets as defaults first, so every analysis starts from the same costs.
BNBCalc Calculator Pricing and Free Analyses
When you've got an address to check, the BNBCalc Calculator costs $30 a month or $199 a year as of October 2026, and both come with the Excel export.
If you'd like to try it first, you can run two property analyses free, or start a 7-day free trial with full access.
And if you don't know where to invest yet, use BNBCalc Markets to compare US markets by gross yield and see what the individual listings in each one earned.
Airbnb Tax Deduction Calculator
Paying too much in taxes? We have the perfect solution. Simulate an Airbnb home purchase below.
Purchase Price
$450K
Structure Value
70%
Apply Trump's Tax Cut (Bonus Depreciation)
Depreciation
$117,695
Interest
$21,600
Tax
$6,750
Year 1 Deduction
$146,045
Want to claim this deduction? Get a free cost segregation benefit analysis from CSA Partners — no obligation.
Get Full Analysis