
Free instant analysis
Reveal Airbnb revenue for any address or city
Where can you track Airbnb market trends, and which of the numbers are worth watching? Well, the place I'd track them is BNBCalc Markets, which refreshes every market's data each month. When I opened BNBCalc's Charleston, South Carolina, market, for example, a typical listing there booked 49% of the nights its host left open over the 12 months to September 2026, at $458 a night, and guests booked it about 52 days ahead.
Those are levels, though, and a trend is about which way they're heading. The tricky part is that a market average can move without a single listing in it earning more or charging more, because the set of listings it counts has changed.
Below, I'll go through the six numbers I'd watch, what a move in each one means next to the others, and how to tell a real change from a shift in the average. Then we'll read all six together on Charleston.
Where Can You Track Airbnb Market Trends?
The place to start is BNBCalc Markets, because every market there has a Marketwide Stats tab that leads with six cards: Annual revenue (actual), Occupancy rate, Avg daily rate, Gross yield in US markets, Lead time and Revpar. All but Gross yield describe the last 12 months, and you can hover the small chart on each of them to see any single month, while Gross yield shows the Current potential. BNBCalc's Help Center spells out how BNBCalc Markets calculates occupancy, ADR and annual revenue, card by card.
On a Markets plan, you can also switch those cards between the low, average and high performance tiers or all listings, and pick a bedroom count from studios to four-plus. When I say a typical listing in this post, I mean that average tier.
Then, further down the same tab, is the table I'd keep coming back to. The Performance metrics by bedroom table shows each size's median revenue and supply, meaning how many listings of that size are active now, and in US markets it adds the median home value and gross yield, with revenue counted as room-revenue potential, cleaning left out. And since home values move that yield, US markets also get a Housing market signals section that shows whether they're going up or down.
On the Listings tab, meanwhile, each listing's detail panel shows its own past 12 months, including its occupancy of available nights, nightly rate, lead time and the days its host blocked.
BNBCalc Markets covers 2,369 markets in 157 countries, and if you'd like a look first, Broken Bow, Oklahoma, is open in full to everyone, while every other market shows part of its data without a plan.
Which Airbnb Market Numbers Are Worth Watching?
Of everything on that tab, these are the six numbers I'd watch, roughly in the order I'd check them. Keep in mind that each one only makes sense next to the others.
Supply vs Occupancy: Is the Market Getting Crowded?
Start with supply. Every new listing splits the same guests a little further, so note the Supply column for your bedroom count in the Performance metrics by bedroom table.
Still, a supply figure on its own doesn't tell you much, because demand may be growing just as fast. That's why I read supply next to occupancy, measured on the homes you'd compete with. With a Markets plan, filter the Listings tab to your bedroom count and note how many listings are in view, then open a handful and note each one's occupancy of available nights. After that, recheck both every few months.
| Listings like yours | Their occupancy | How I'd read it |
|---|---|---|
| Falling | Any direction | No flood of new competition, but it's still worth asking why occupancy moved |
| Rising | Falling | Crowding: more listings are splitting the same guests |
| Rising | Flat or rising | Demand is keeping pace with the new listings |
Of the three, the middle row is the one to worry about.
Even then, I'd want to see it hold across a couple of checks before I called a market crowded. It's the same question I'd ask before buying in a market, only asked again each time you check.
Occupancy Rate on Bookable Nights
The Occupancy rate card shows the share of nights guests booked, counting only the nights the host left open, so blocked dates don't count against it. In BNBCalc's Charleston market, a typical listing booked 49% of its open nights over the 12 months to September 2026, while the top performers booked 59%. Is 49% good, then? Well, the typical listing in the median US market booked 38%, so Charleston's 49% beats the typical listing in 92% of the US markets with a full year of BNBCalc data.
Be careful when occupancy slips while nightly rates climb, because hosts may be charging more for fewer nights, which isn't the same as guests going away. Make sure to check the rate, then, before you read a drop in occupancy as weak demand.
Average Nightly Rate (ADR)
The Avg daily rate card is the average price guests paid per booked night, with cleaning fees included and before Airbnb's host fee comes out.
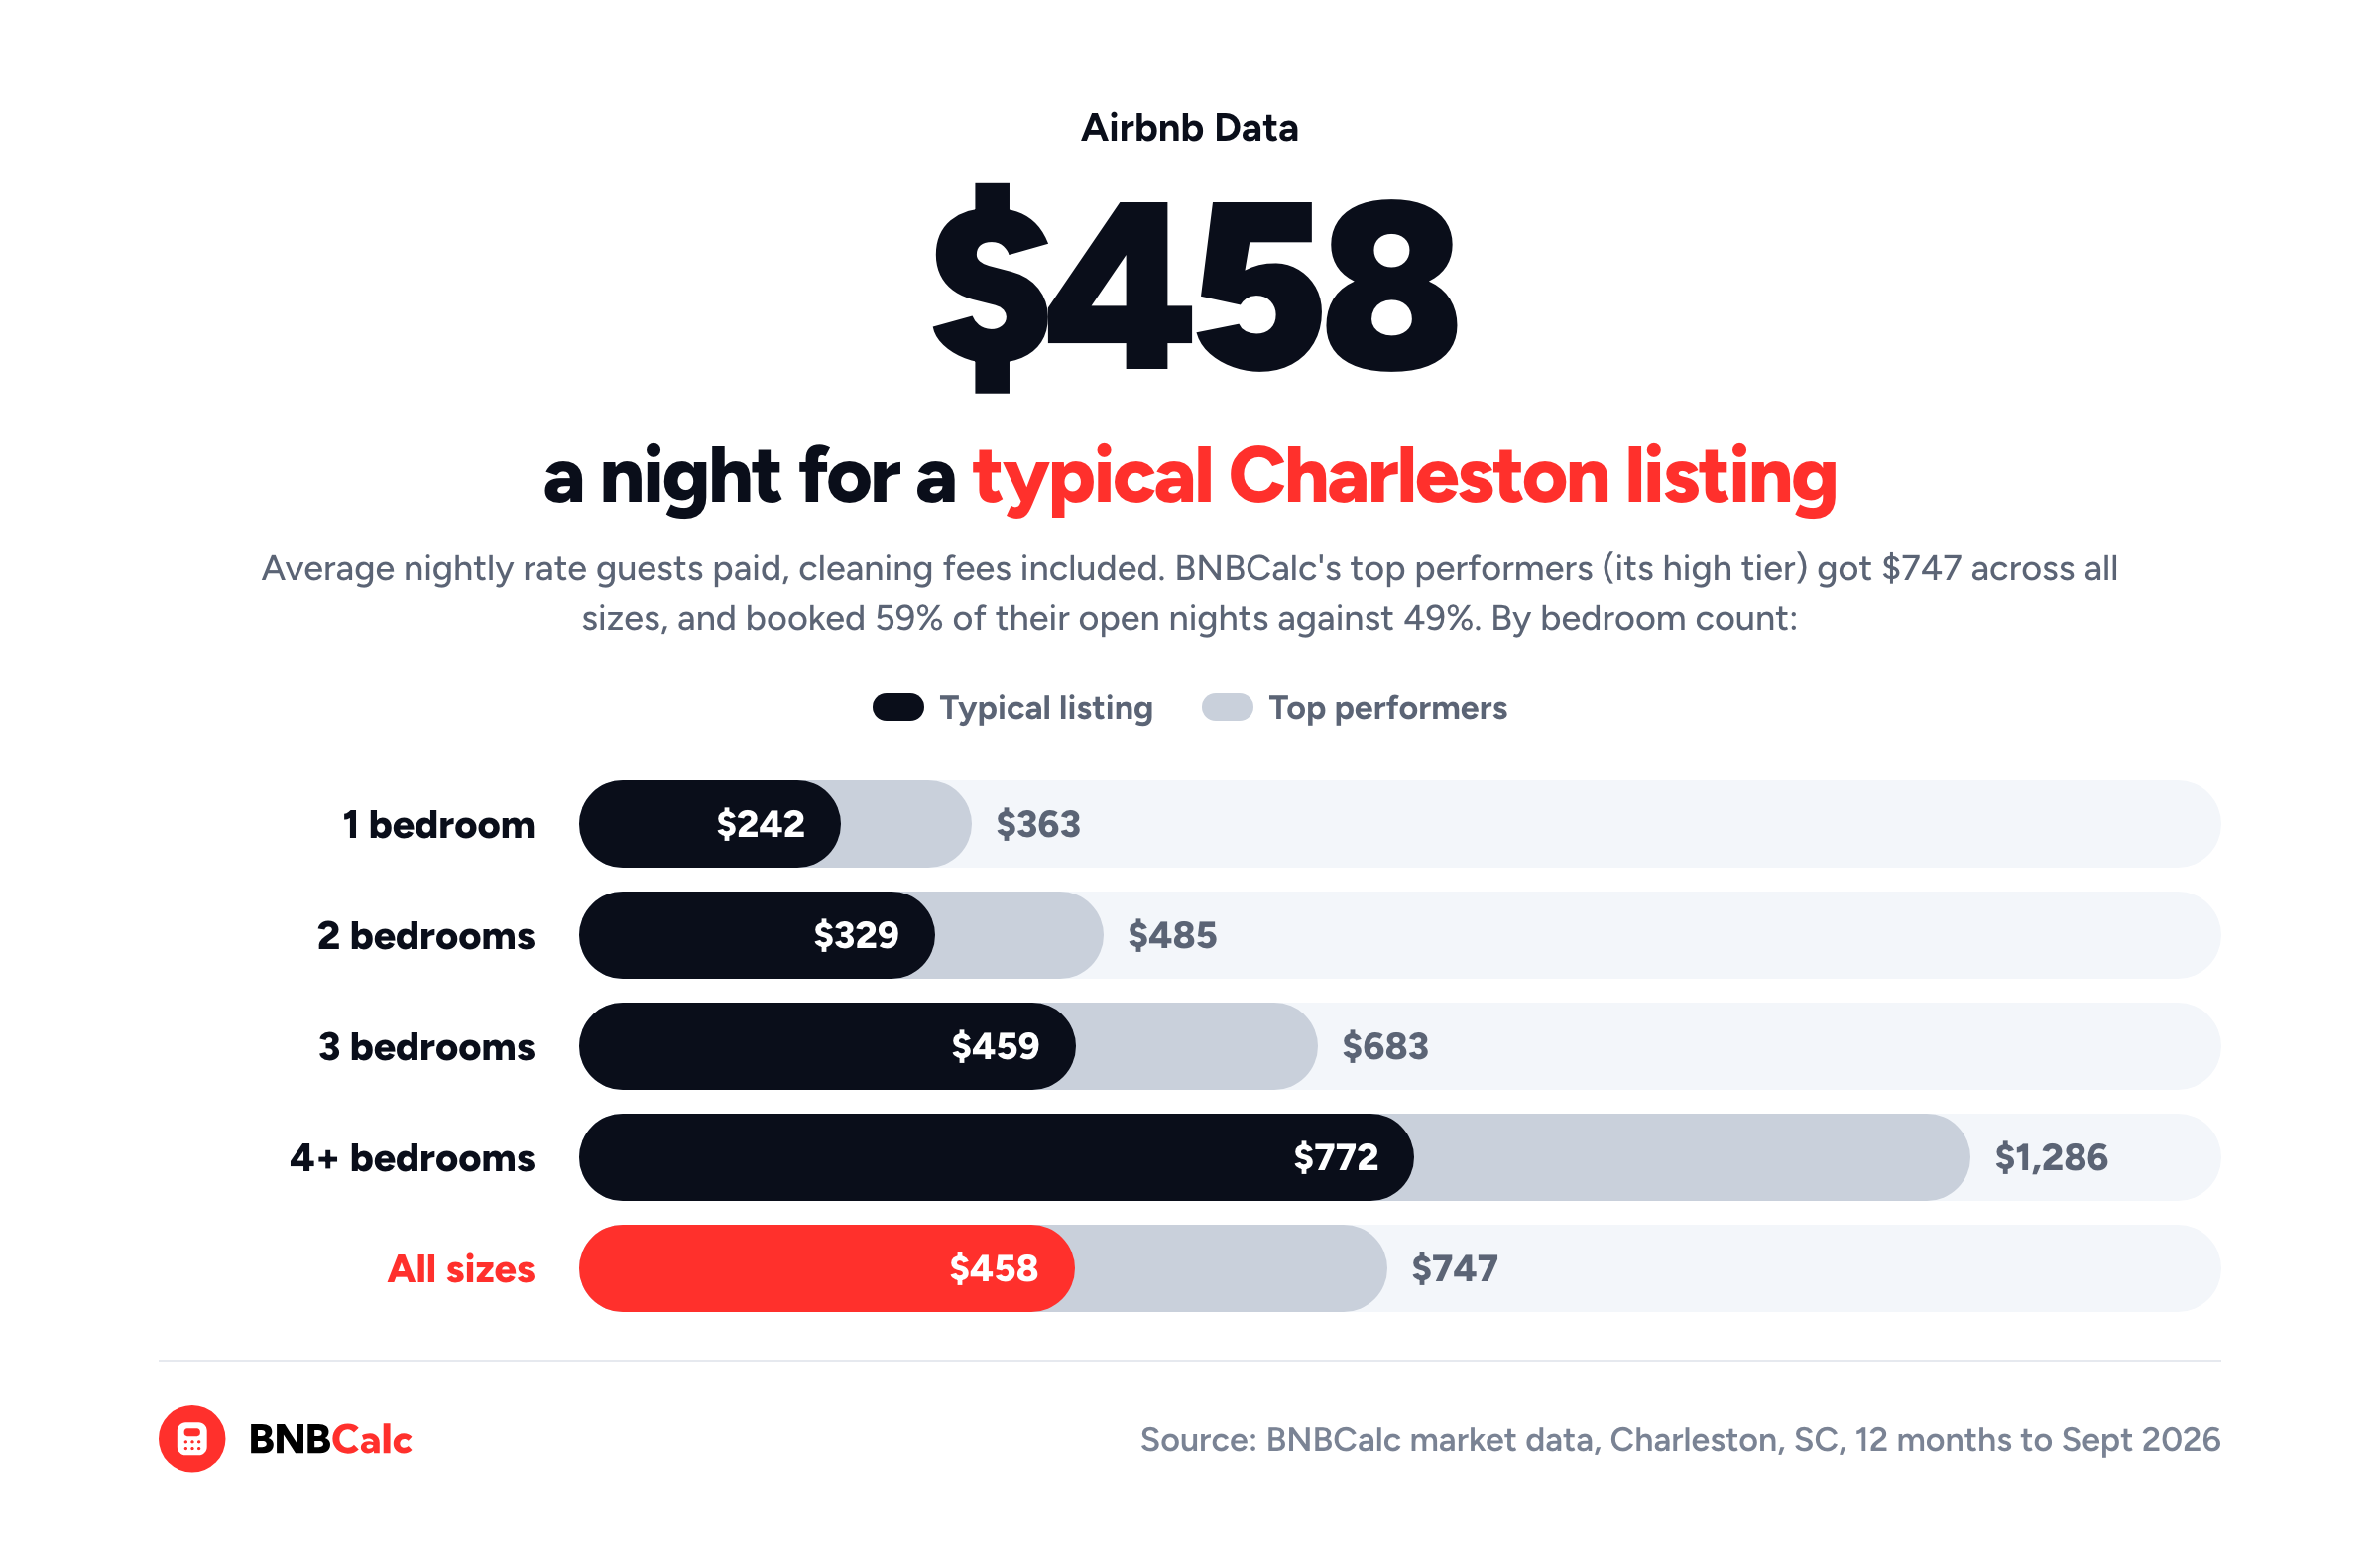
In BNBCalc's Charleston market, that came to $458 a night for a typical listing, against $747 for the top performers. Rate is where they win, since BNBCalc's top performers charged about 63% more a night, yet they booked only 10 percentage points more of their open nights.
That's why I watch rate and occupancy as a pair. If rates rise and occupancy holds, guests are paying more for the same nights, whereas if rates rise and occupancy falls, the market may be pricing past what guests will pay.
Booking Lead Time
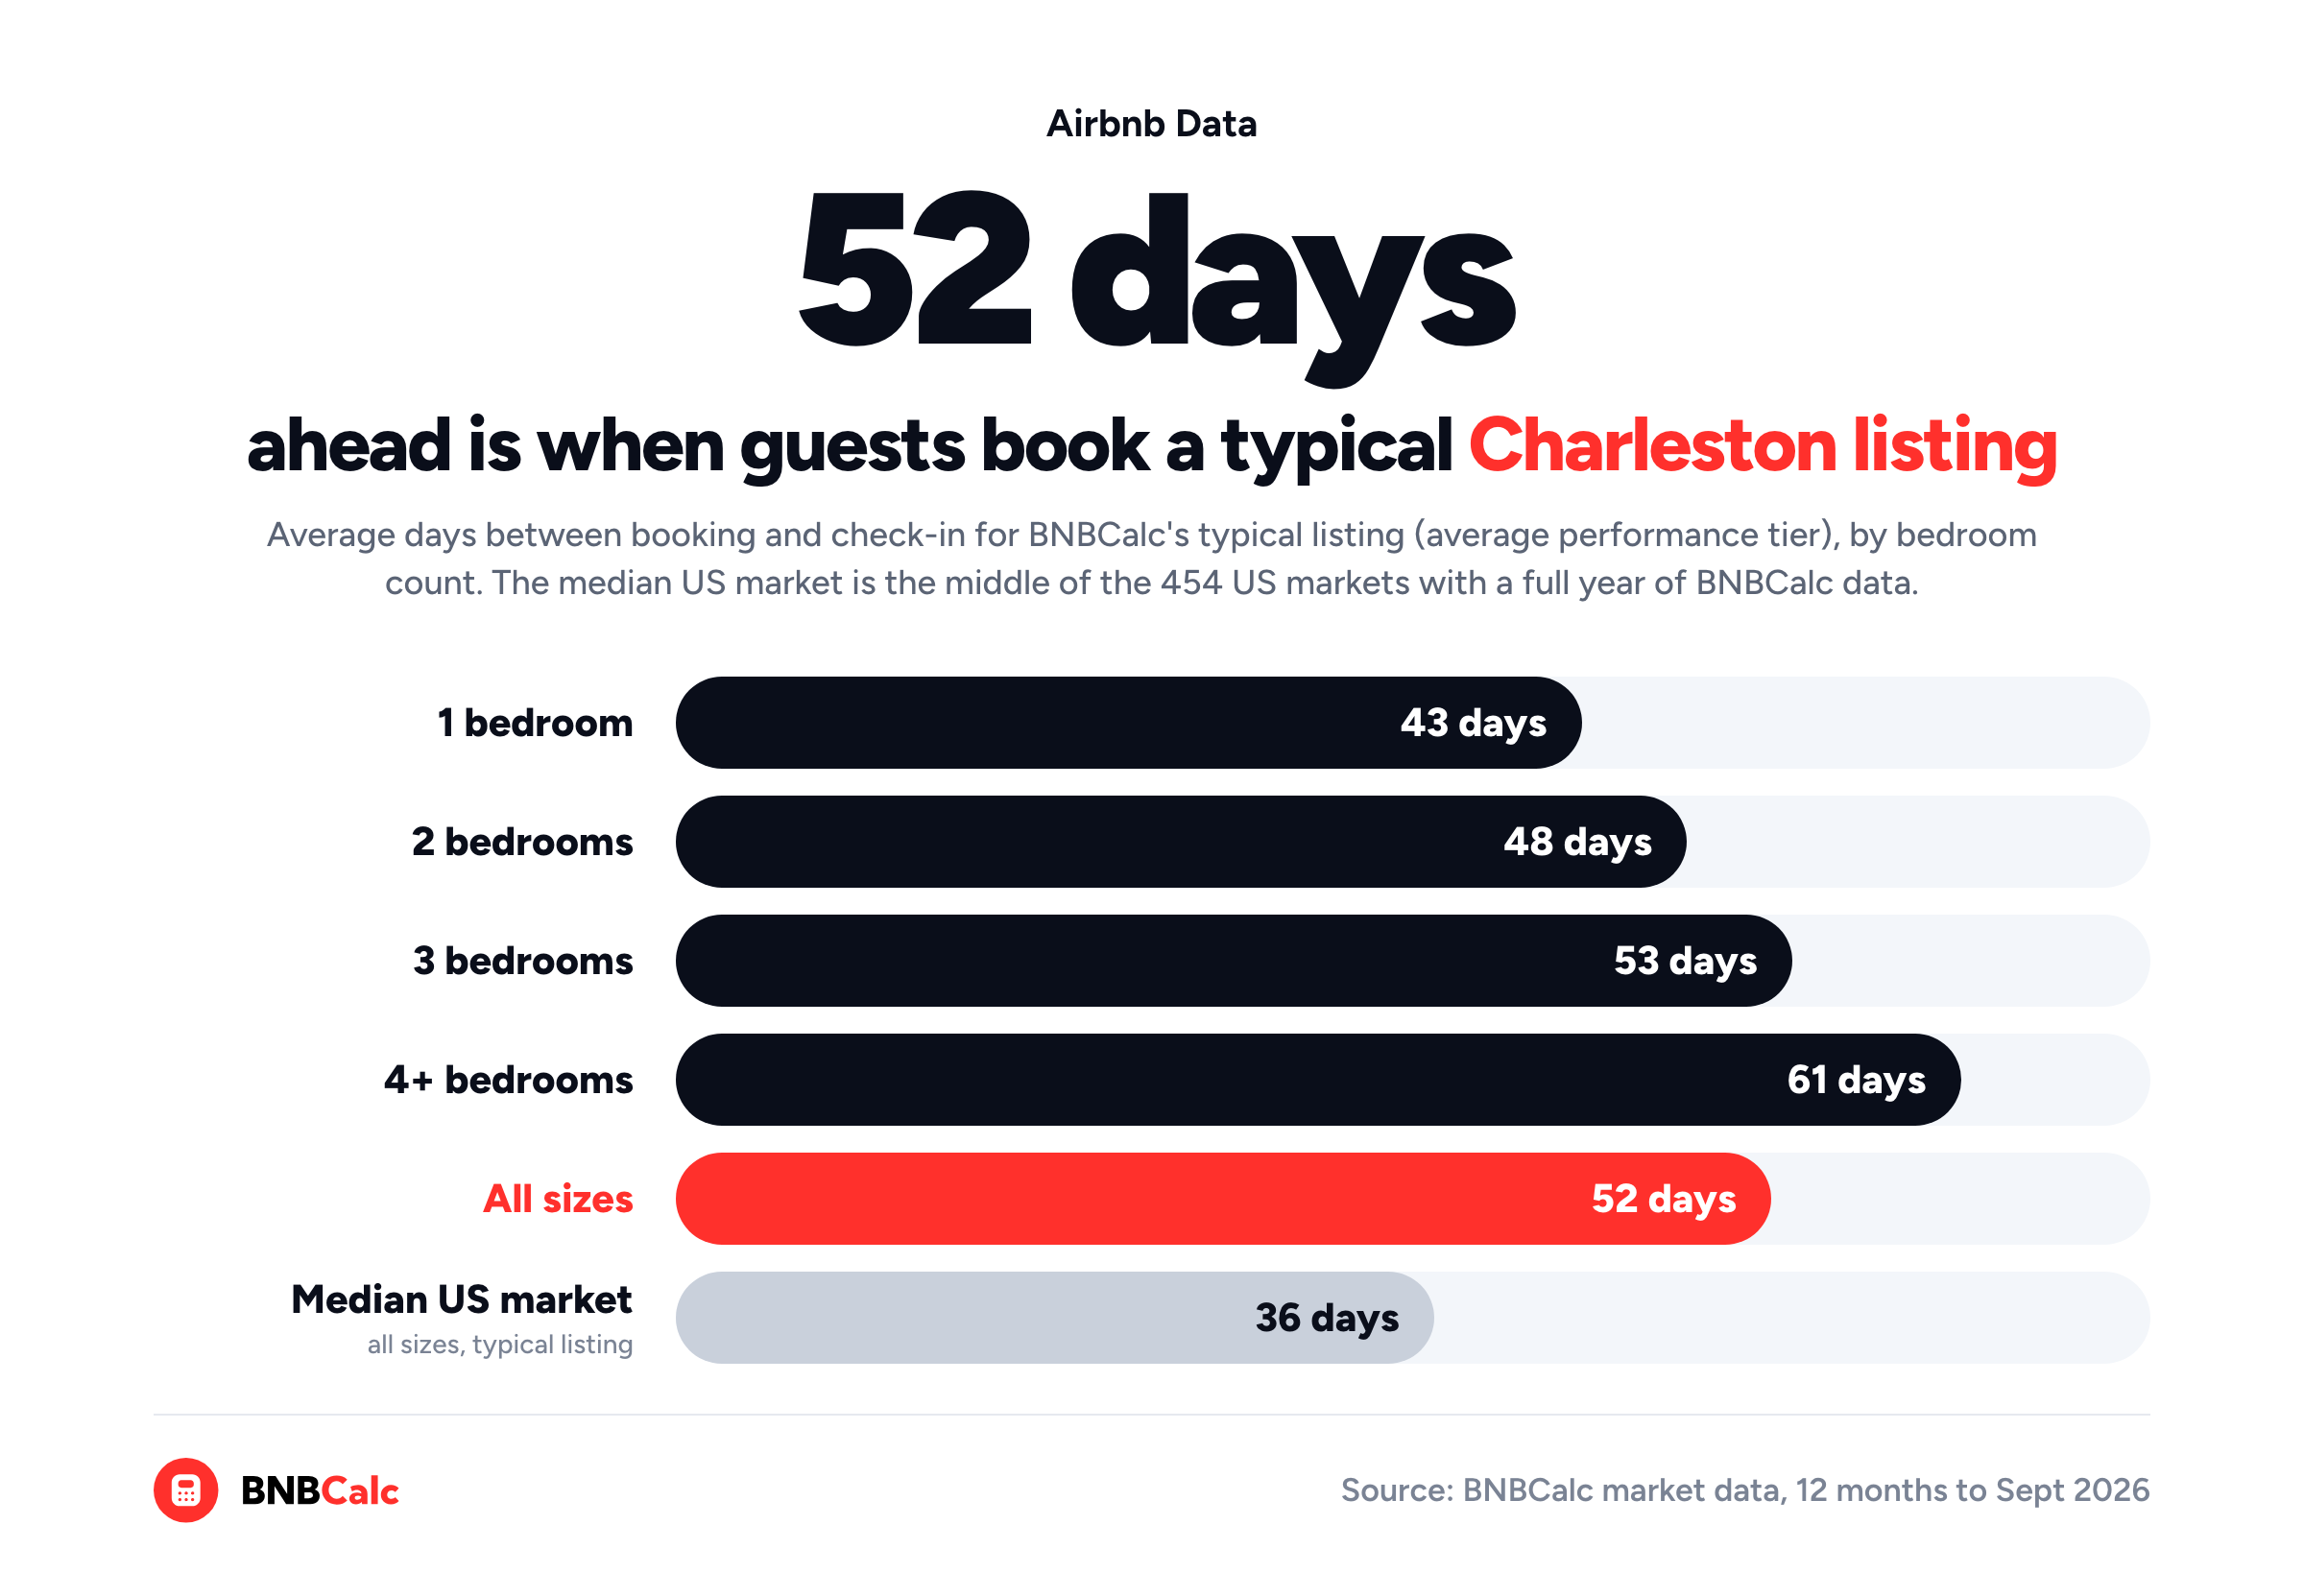
The Lead time card shows the average number of days between booking and check-in. When I pulled Charleston's from BNBCalc, guests had booked a typical listing 52 days ahead, against 36 days for the typical listing in the median US market. That's longer than in 95% of the US markets with a full year of BNBCalc data.
Size changes it in BNBCalc's figures, too: it climbs from 43 days for a one-bedroom to 61 for four bedrooms or more.
What lead time tells you is when the bookings arrive. If it shortens while occupancy holds, then, guests are only deciding later, and you'll want your prices right for the weeks closest to check-in, whereas if both fall together, I'd treat it as a demand problem.
Seasonality: Which Months Run Full?
A 12-month average can hide a lopsided year, so hover the mini charts on the Occupancy rate and Avg daily rate cards to see which months run full and which run slow.
What I watch here is the shape rather than the level, meaning how deep the slow months go and how far rates move between the peak and the trough, since your bills don't shrink in the slow months.
Once you've got a specific house in mind, the BNBCalc Calculator has a Seasonality card that draws your monthly break-even as a dashed line. Most of that line, the mortgage, property tax and fixed bills, comes due whether guests book or not. Hold it up against the slow months you found on those cards, and plan your cash reserve around them.
Gross Yield and Home Values
The Gross yield card works home by home. For each eligible home, BNBCalc divides the home's annual room-revenue potential, what it could earn if it were bookable all year with cleaning income left out, by a home value matched to its ZIP code and bedroom count, and the card shows the median of those yields as Current potential, before expenses, financing, taxes and local rules. In US markets, it's what Markets ranks by default, and because it moves when either earnings or home values move, it's worth watching even when revenue holds steady.
When I checked BNBCalc's Charleston market on October 21, 2026, the card read 9.6%, sixth of the seven markets on BNBCalc's South Carolina page. That page also puts Charleston's median home value at $805,623, which goes a long way to explaining the low yield.
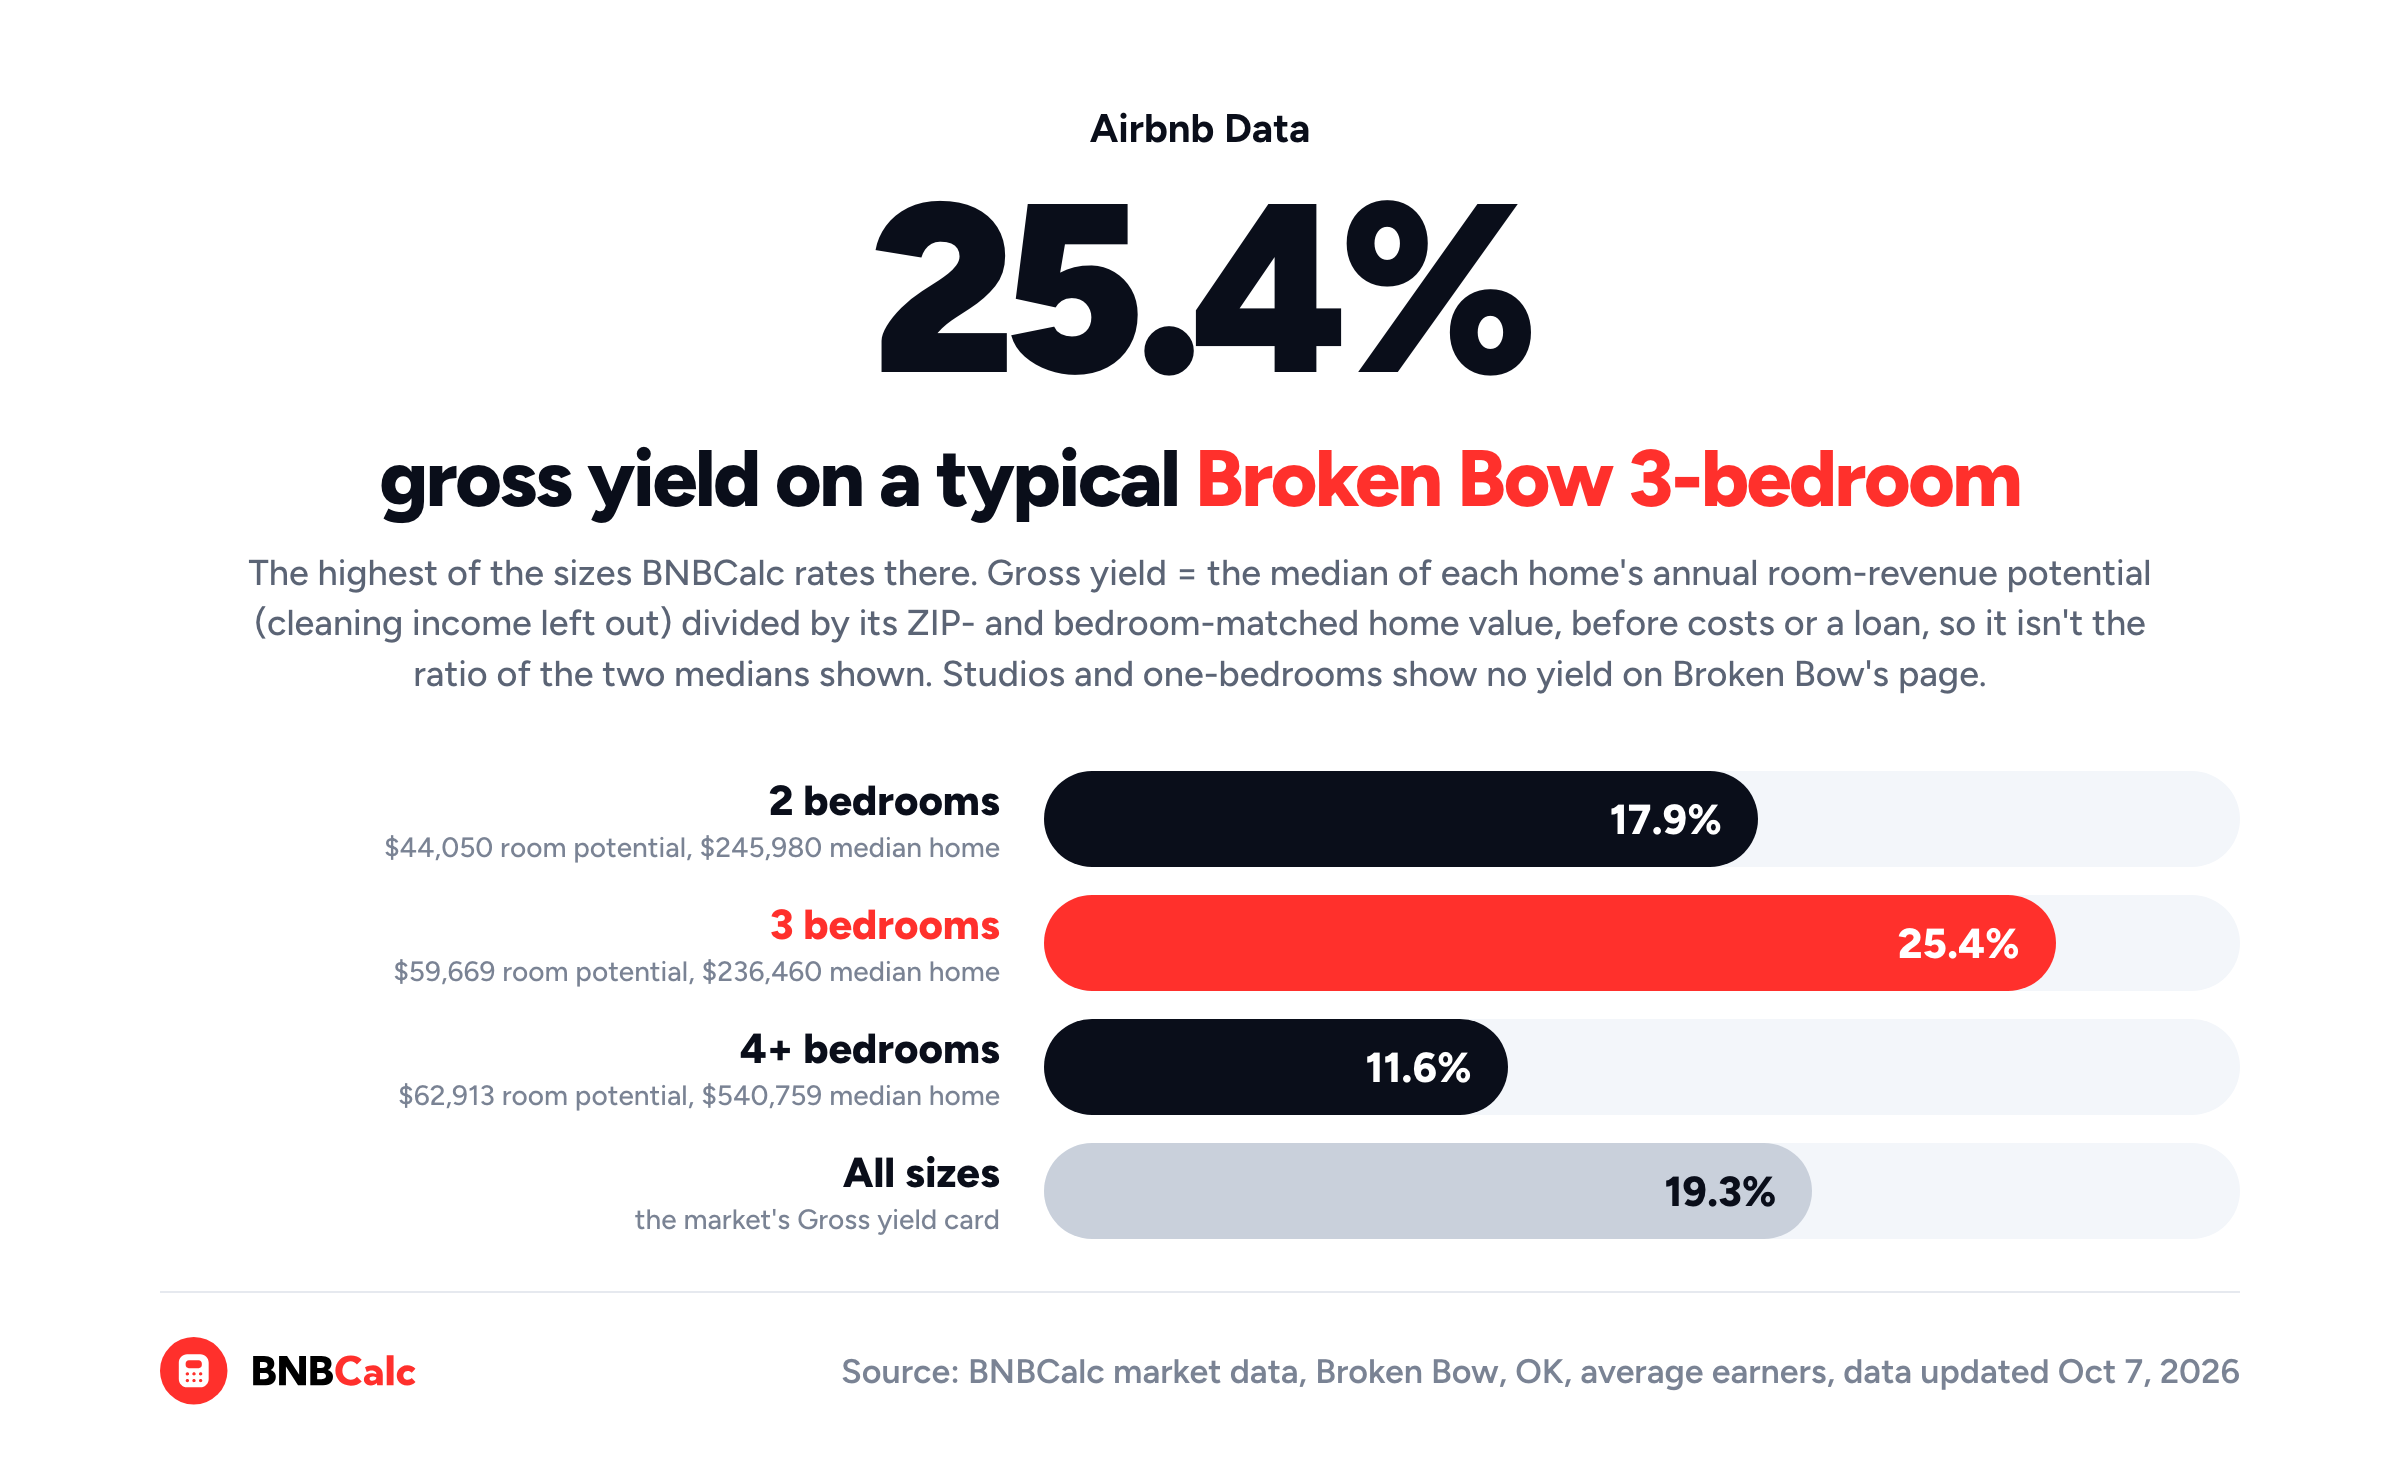
Charleston's breakdown by bedroom count needs a Markets plan, though, so take Broken Bow, Oklahoma, which BNBCalc leaves open to everyone. There, BNBCalc puts a typical three-bedroom's gross yield at 25.4%, the highest of the three sizes with a yield, while homes with four or more bedrooms could earn the most in room revenue and yield the least, at 11.6%. So why does the biggest earner yield the least? On Broken Bow's BNBCalc page, a four-plus-bedroom home's median value of $540,759 is more than double a three-bedroom's $236,460, yet its $62,913 in room potential is only about $3,200 more than the three-bedroom's $59,669.
I'd watch home values alongside revenue, then, and that's what the Housing market signals section is for. And if you're judging whether a yield is high enough to work, this guide to finding the best Airbnb markets shows how to work out a break-even yield.
How Do You Tell a Real Trend From a Shift in the Average?
Once you know which numbers to watch, the trap is reading a change that comes from what's being counted rather than from what guests did.
First, compare like with like. Keep the same performance tier, the same bedroom count and the same Last 12 months view every time you check, because switching slices moves the number on its own. In BNBCalc's Charleston market, for example, all listings averaged 45% occupancy against 49% for the typical listing, so flipping between those two views would look like a four-point drop that never happened. BNBCalc's guide to Airbnb statistics by city walks through every slice.
Second, watch for mix shift, which is what happens when the set of listings behind an average changes. Say a run of big new homes joins a market. Its average nightly rate climbs, even if no host raises a price.
Airbnb uses the same term about its own platform. In its second-quarter 2026 results, published August 6, 2026, it said it expects "a moderate increase in ADR due to mix shift and price appreciation" in the third quarter. It also reported that "Nights and Seats Booked grew 10 percent year-over-year," a count that takes in experience seats and hotel nights as well as homes. In other words, a platform-wide number can't stand in for the market you're buying in.
Third, when a combined number moves, look at its parts before you read anything into it. The Revpar card, revenue per available night, reflects both rate and occupancy, so a change in it doesn't tell you which of the two moved. The Annual revenue (actual) card is broader still: it's the market's total revenue over 12 months divided by its average number of active listings, so a change in supply moves it too.
Finally, check the market against the homes like yours. Keep the same handful of listings you'd compete with, filtered to your bedroom count and performance tier. Every few months, note each one's occupancy of available nights and nightly rate, because a market average only becomes a trend you can act on once the homes like yours show it too.
How Is the Charleston Airbnb Market Doing in 2026?
Put together, the six numbers read like this on Charleston's market in BNBCalc Markets, for the typical listing over the 12 months to September 2026. Keep in mind that a BNBCalc market is a named area with its own boundary, and Charleston's reaches well past the city. In BNBCalc's listing data for it, close to three in five listings sit in the ZIP codes for Isle of Palms, Folly Beach and Johns, Kiawah and Seabrook islands, so check where the listings are before you treat these numbers as the city's.
| Bedrooms | Annual revenue | Occupancy rate | Nightly rate | Lead time |
|---|---|---|---|---|
| 1 | $51,865 | 47% | $242 | 43 days |
| 2 | $79,451 | 53% | $329 | 48 days |
| 3 | $105,363 | 51% | $459 | 53 days |
| 4+ | $145,126 | 46% | $772 | 61 days |
| All sizes | $98,934 | 49% | $458 | 52 days |
Source: BNBCalc Markets, Charleston, SC, Marketwide Stats cards (Annual revenue (actual), Occupancy rate, Avg daily rate and Lead time) for a typical listing at the average performance tier, 12 months to September 2026. The bedroom rows need a Markets plan; the All sizes row is on the free page.
Read down each column to see what size changes. In BNBCalc's figures, occupancy barely moves, staying between 46% and 53%, whereas lead time and nightly rate climb with every bedroom, and the two-bedroom leads on occupancy.
So what would I watch there? If I were buying a two-bedroom, I'd set its gross yield in the Performance metrics by bedroom table against the 9.6% BNBCalc's Gross yield card gives Charleston as a whole, and recheck it as home values move. I'd also watch whether the two-bedrooms I'd compete with keep booking around the 53% of open nights BNBCalc shows for a typical one as more listings arrive. For a bigger house, I'd add lead time and the nightly rate, since BNBCalc's top performers with four or more bedrooms averaged $1,286 a night against $772 for a typical one, while booking only 12 points more of their open nights.
Before you act on any of it, make sure to check the rules for the exact address in BNBCalc's Charleston regulation guide. Rules are worth tracking too, and they depend on which town the address is in. Inside the City of Charleston, for example, the city's short-term rental permit page says every permit has to be renewed each year by its original date of issue.
So, Where Can You Track Airbnb Market Trends?
You can track them in BNBCalc Markets, where each market's Marketwide Stats tab covers the last 12 months and refreshes monthly. Once you're there, start with active listings against occupancy, then move on to nightly rate, lead time, the shape of the year and gross yield, reading each one against the others. For example, in BNBCalc's Charleston market that read showed a typical listing at 49% occupancy and $458 a night, with a 9.6% gross yield across all sizes.
From there, open the market you're weighing, set the tier and bedroom count you'd buy, and check the same six numbers each month against the homes you'd compete with.
A number only becomes a trend once you've compared it with itself, counted the same way, more than once. Until then, it's a snapshot.
Frequently Asked Questions
What Airbnb Market Numbers Should Investors Watch?
In BNBCalc Markets, watch six: active listings against the occupancy rate, then nightly rate, booking lead time, the shape of the year and gross yield. Read each one against the others, since a rate rise with occupancy holding means something different from one with occupancy falling. Over the 12 months to September 2026, a typical listing in BNBCalc's Charleston, South Carolina, market ran 49% occupancy at $458 a night.
How Can You Tell If an Airbnb Market Is Oversaturated?
Open the market in BNBCalc Markets and note the Supply column for your bedroom count in the Performance metrics by bedroom table. Then filter the Listings tab to your bedroom count and recheck the homes you'd compete with every few months. If listings keep rising while those homes book fewer of their open nights, new listings are splitting the same guests, whereas if their occupancy holds or climbs, demand is keeping pace.
How Often Is BNBCalc's Airbnb Market Data Updated?
BNBCalc Markets refreshes its market data monthly. The previous month's market statistics arrive early in the month, then the listing snapshot and market summaries, with home values updated mid-month. Each refresh is checked on a test system before it goes live, so a monthly look at your market is enough to keep current.
Can You Track Airbnb Market Trends Outside the US?
Yes. BNBCalc Markets covers 2,369 markets in 157 countries, with the same annual revenue, occupancy, nightly rate and lead time cards on each. Gross yield and home values are US-only, though, because property-value data is widely available only in the US, and you can switch the money figures into nine currencies, including euros and pounds.
What Is a Normal Booking Lead Time for an Airbnb?
BNBCalc Markets shows it on every market's Lead time card, the average days between booking and check-in. Over the 12 months to September 2026, guests booked the typical listing in the median US market 36 days ahead, against 52 days for a typical listing in BNBCalc's Charleston, South Carolina, market, where homes with four or more bedrooms were booked 61 days out.
BNBCalc Markets Pricing and Free Trial
When you're ready to watch a market of your own, BNBCalc Markets is $79 a month or $399 a year as of October 2026, and it includes the full BNBCalc Calculator.
If you'd like to try it first, you can run two property analyses free, or start a 7-day free trial with full access.
Airbnb Tax Deduction Calculator
Paying too much in taxes? We have the perfect solution. Simulate an Airbnb home purchase below.
Purchase Price
$450K
Structure Value
70%
Apply Trump's Tax Cut (Bonus Depreciation)
Depreciation
$117,695
Interest
$21,600
Tax
$6,750
Year 1 Deduction
$146,045
Want to claim this deduction? Get a free cost segregation benefit analysis from CSA Partners — no obligation.
Get Full Analysis