

Free instant analysis
Reveal Airbnb revenue for any address or city
How do you do Airbnb market research on a city before you buy a property there? Well, you take that one market through seven checks, in order. When I ran BNBCalc's Corpus Christi, Texas, market through them, a typical three-bedroom there had earned $60,406 over the 12 months to September 2026.
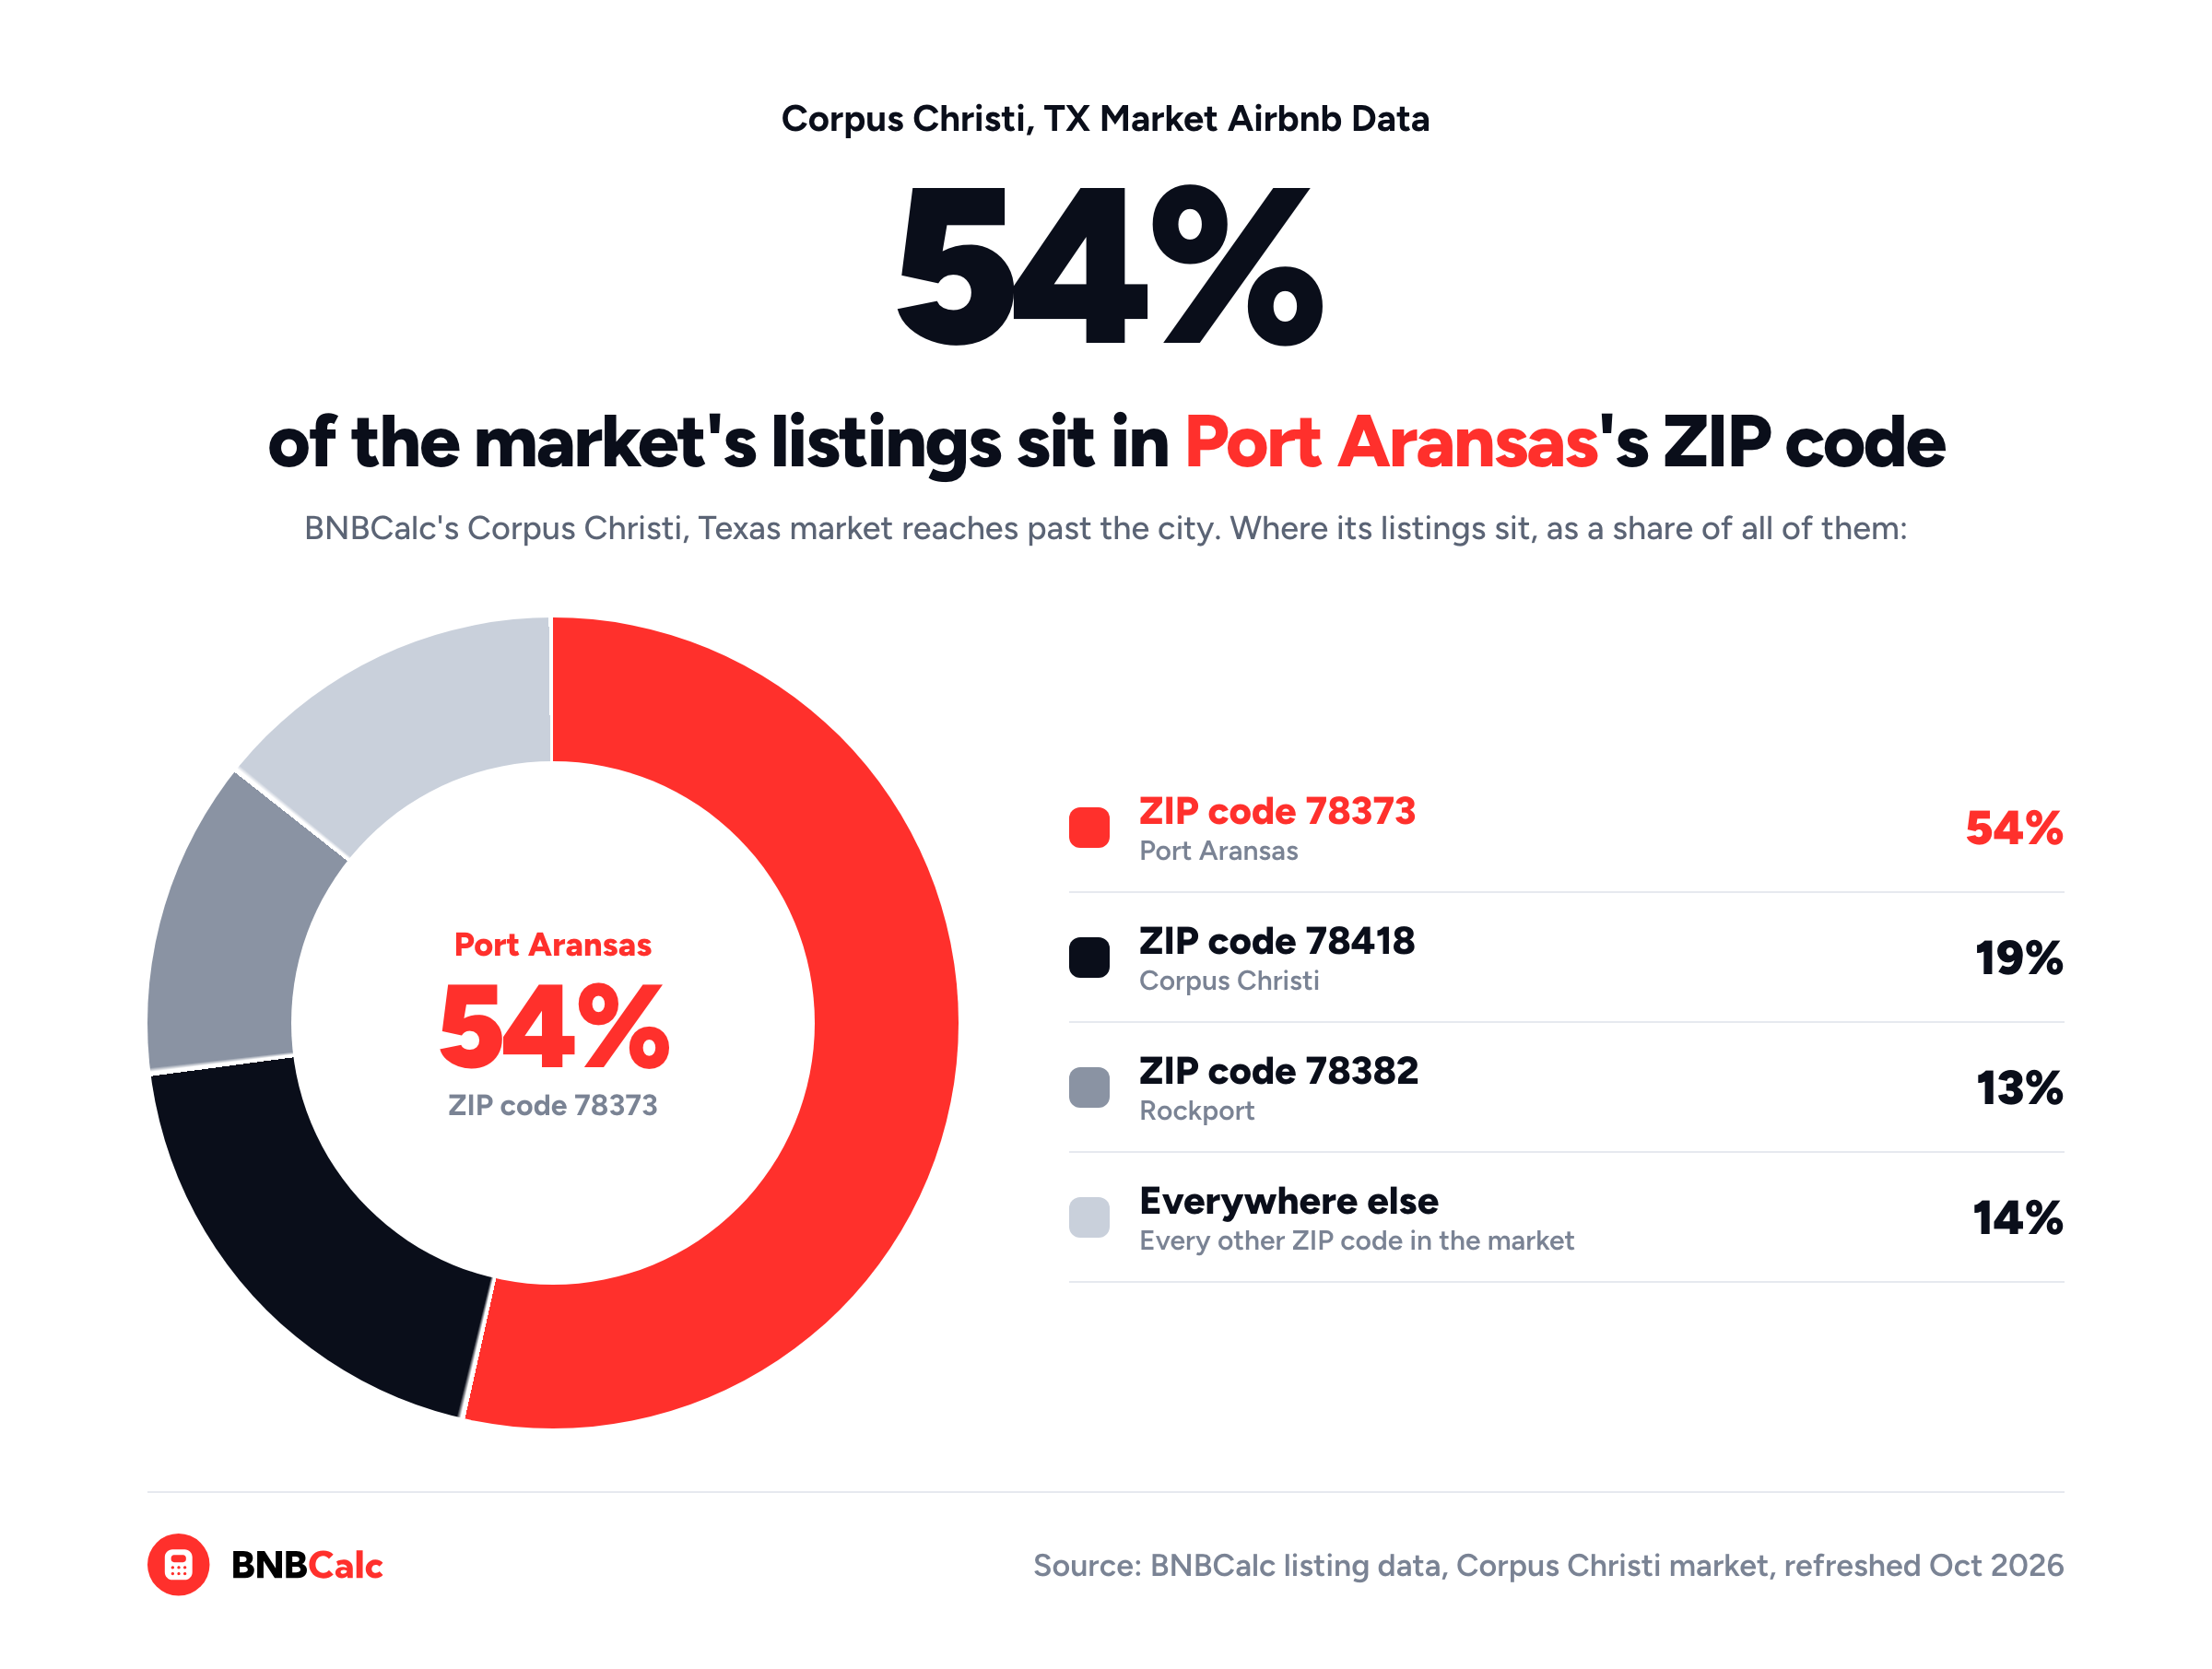
Before you plan around a number like that, you'll want to know two things it can't tell you: where the market's listings actually sit, and whether the rules let you run one at the address you'd buy. BNBCalc's Corpus Christi market reaches well past the city, for example, with more than half of its listings in Port Aransas's ZIP code, and the city itself caps rentals their owners don't live in at 15% of a block face.
So I'll start with the best place to do this research, then walk that market through all seven steps, ending with the house itself.
What's the Best Website to Research Airbnb Markets Before You Buy?
BNBCalc Markets is the one I'd use, because it covers the whole market side of the job in one place. It ranks markets, shows what listings earn by bedroom count and performance tier, maps each market's active listings, and breaks a market down by amenity and operator. It also includes the full BNBCalc Calculator, so once a house makes your shortlist, you can run its numbers on the same account.
Part of it is free, too. Without an account, a market page still shows its headline annual revenue and lead time, its gross yield in US markets, and in most markets its occupancy and nightly rate, while BNBCalc's US market rankings sort each state's markets by gross yield for anyone to see. Everyone can also explore one sample market, Broken Bow, Oklahoma, with all its data unlocked, so you can try the Markets screens below on it for free.
For any other market, you'll need the Markets plan to switch bedroom counts and performance tiers, see what each listing earned, and see what each operator's listings bring in.
How to Do Airbnb Market Research Before You Buy, Step by Step
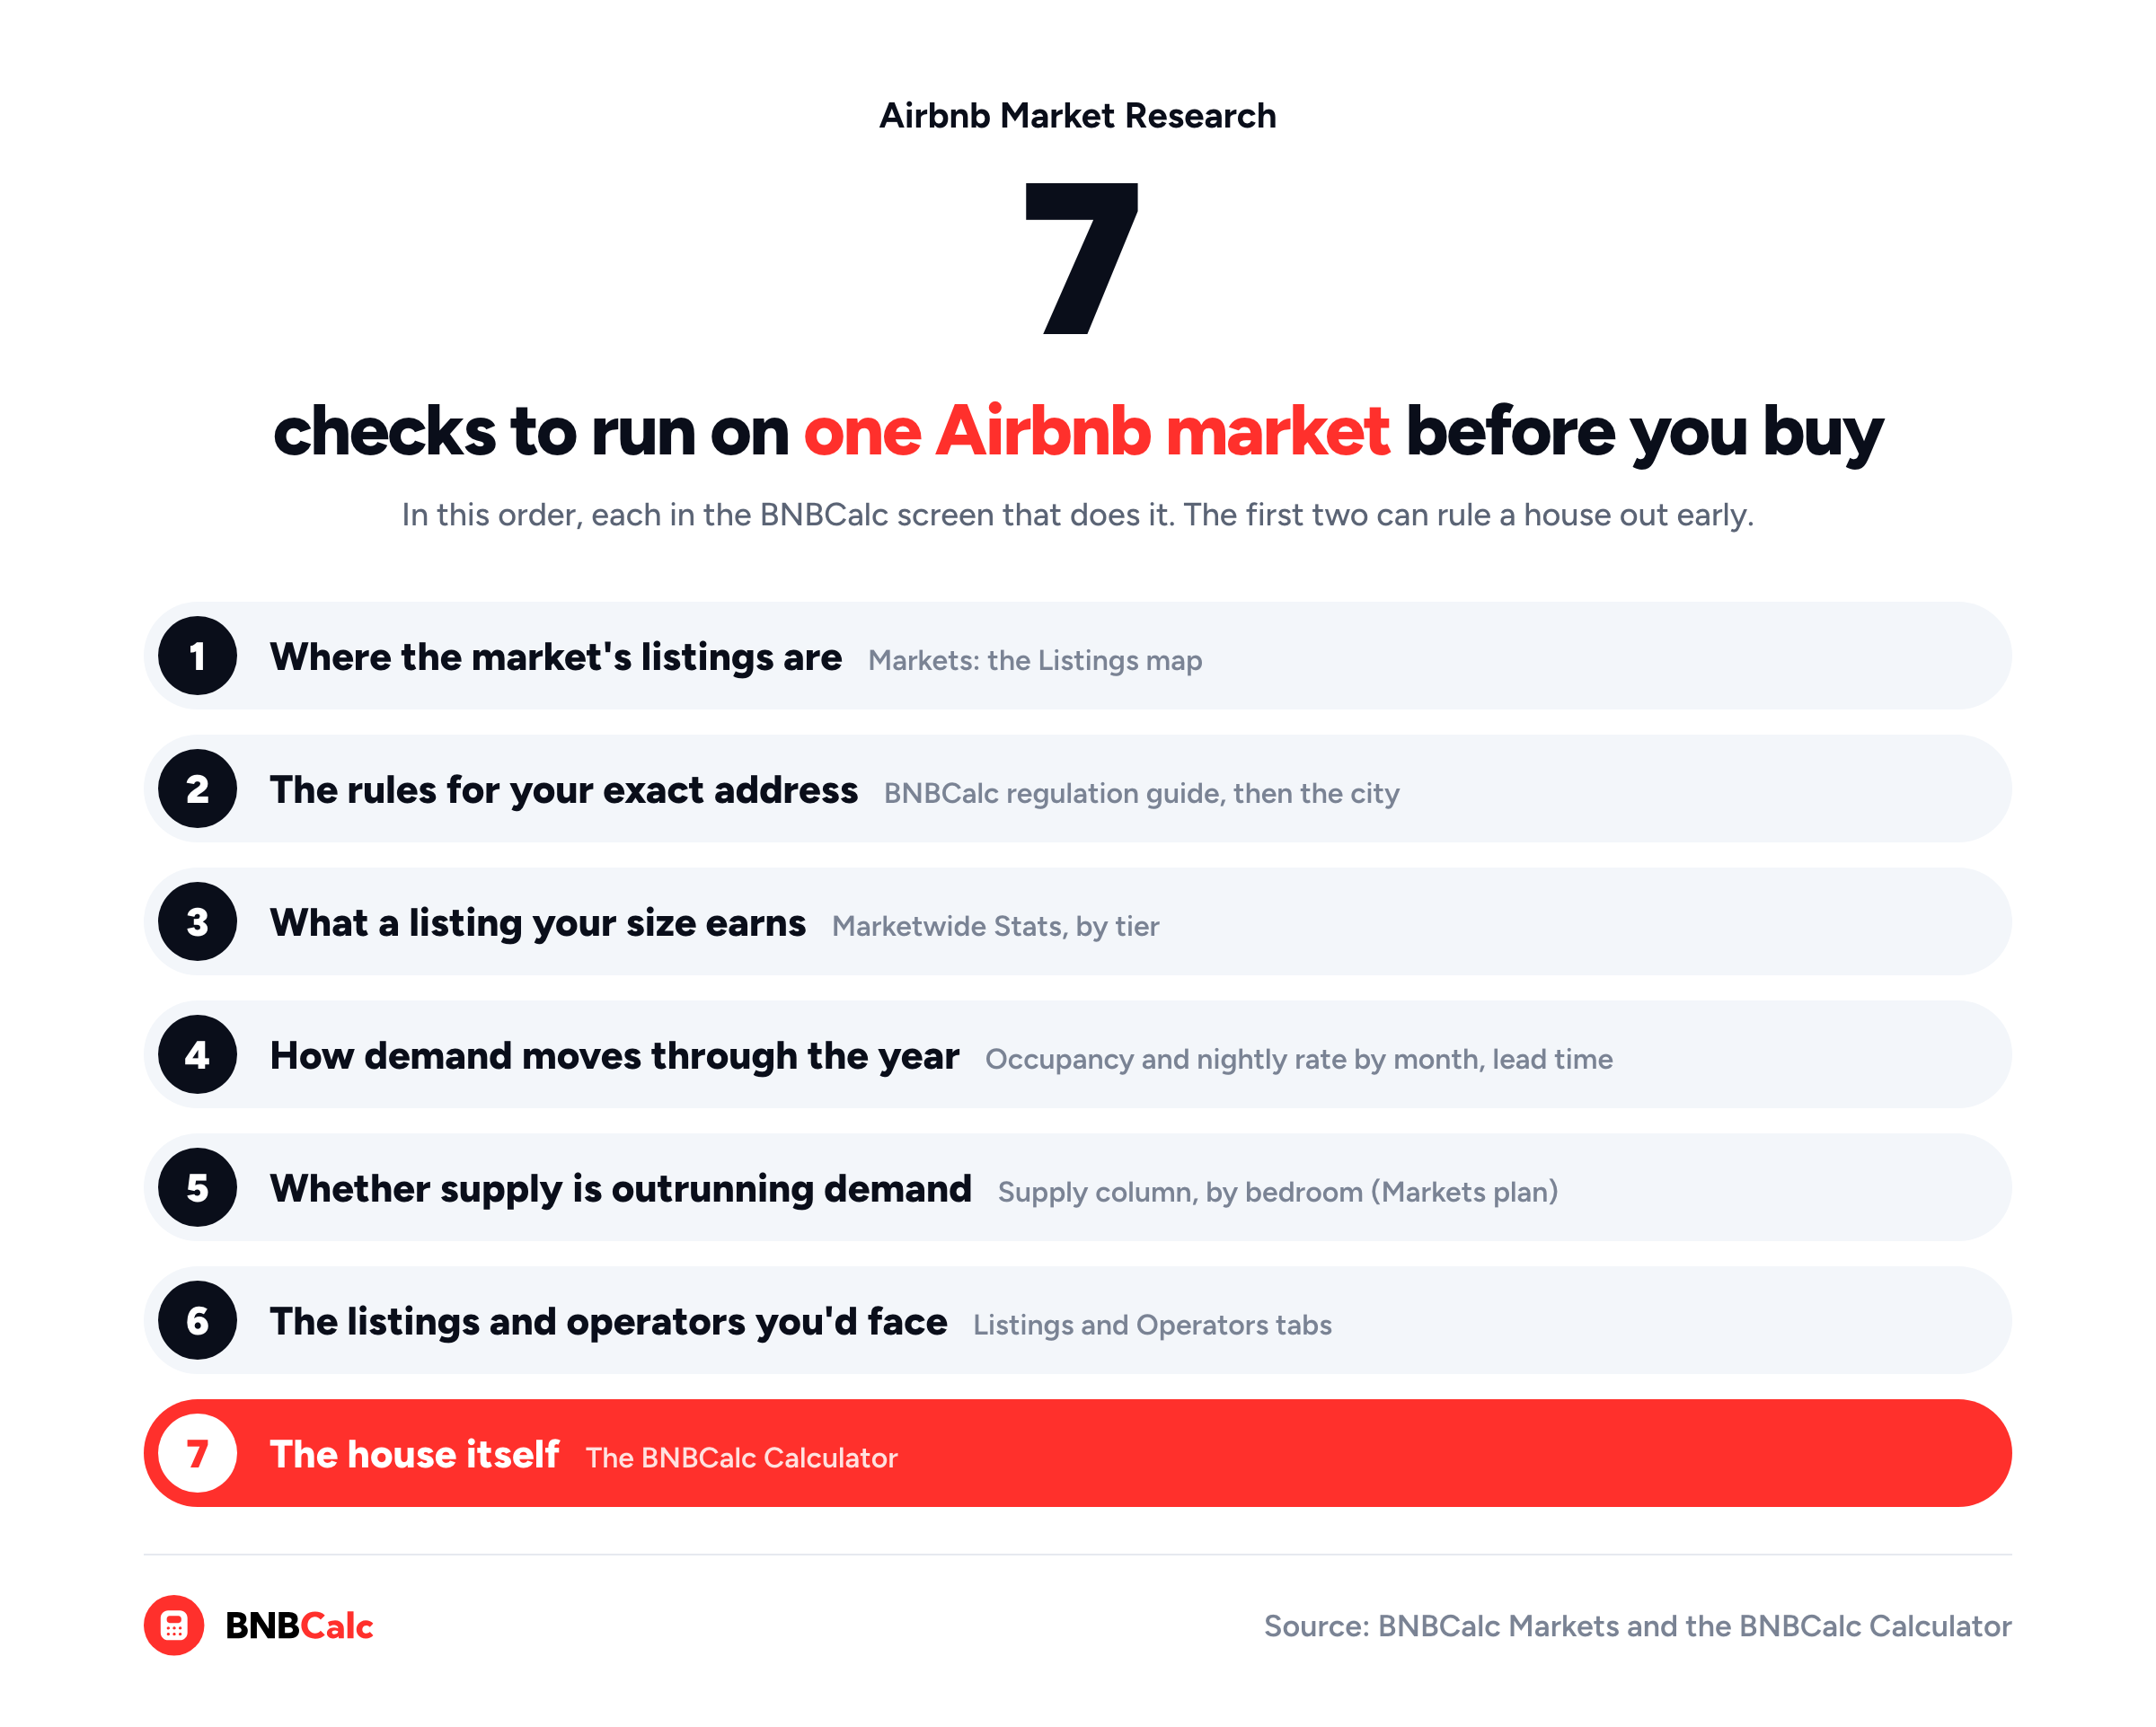
The order of the steps matters, because the first two can rule a house out before any revenue figure gets a say. I'd run them in this order, each with the BNBCalc tool that does it, using BNBCalc's Corpus Christi market as the example throughout.
Step 1: Find Out Where the Market's Listings Actually Are
Start with the map. A BNBCalc market is a named area with its own boundary, which can be a city, a region or a resort area. That's why you'll want to open the market's Listings tab in BNBCalc Markets and move the map from town to town, watching its "listings in view" count as you go.
BNBCalc's Corpus Christi market is a good example of why.
When I mapped its listing data, 54% of the listings sat in ZIP code 78373, which is Port Aransas's, and 19% were in 78418, a Corpus Christi ZIP code. Another 13% were in 78382, Rockport's, which leaves about one in seven for every other ZIP code combined.
That's worth knowing before every step after this one, because the market's averages describe that whole area, and the rules you'll read next depend on which town your address is in.
Step 2: Check the Rules for the Address, Not Just the City
Before you look at a single revenue figure, make sure the address itself can be rented short term, because the answer can change from one block to the next. I'd start with BNBCalc's Corpus Christi regulation guide. It walks through the permit, the taxes and the exceptions, and then you can confirm each rule on the city's own page.
When I checked Corpus Christi's short-term rental page on October 16, 2026, the city required a registration permit for any property rented for less than 30 consecutive days.
A rental that isn't the owner's or operator's own home counts as Type 2, and the city says those are "limited to 15% of the block face," awarded first come, first served. On top of that, short-term rentals "are not permitted in single-family zoning districts within the Padre/Mustang Island ADP," meaning the area covered by the city's development plan for the two islands. The city still takes applications there for units in multi-family and commercial zoning, though.
Even in a city that allows investors, then, a house can fail this step because its block has already hit the cap, or because it sits in single-family zoning on the islands.
With both rules in play, it's worth calling the city's Development Services department about the exact address, as BNBCalc's guide suggests, before you make an offer.
Keep in mind, too, that the city's permit covers addresses inside its city limits. If the house is in Port Aransas's or Rockport's ZIP code, find out whose rules cover that address, the town's or the county's, before you go any further.
Taxes come with the rules, too. Airbnb's Texas tax page says guests at listings in the City of Corpus Christi pay a 9% hotel/motel occupancy tax as part of their reservation, on top of Texas's 6% state hotel occupancy tax.
Step 3: Look Up What a Listing Your Size Earns
Once the address clears, open the market's Marketwide Stats tab and set the bedroom selector to the size you'd buy. Then switch the performance selector between its low, average and high tiers to see what a weaker, a typical and a stronger listing of that size earns.
For a three-bedroom in BNBCalc's Corpus Christi market, for example, the tiers looked like this over the 12 months to September 2026.
| Slice of the Corpus Christi market's 3-bedroom listings | Annual revenue | Occupancy | Nightly rate (ADR) |
|---|---|---|---|
| Low performance tier | $23,255 | 23.8% | $218 |
| All listings (market-wide average) | $49,962 | 30.9% | $327 |
| Average performance tier (a typical listing) | $60,406 | 37.0% | $314 |
| High performance tier | $124,590 | 42.4% | $529 |
Source: BNBCalc market data for the Corpus Christi, Texas market, three-bedroom listings, 12 months to September 2026, with cleaning fees included in revenue and the nightly rate.
Read it row by row, since each one averages a different group of the same three-bedrooms.
Which row should you plan around, then? I'd use the typical one and read the high tier as what the best-run listings managed. The all-listings average, meanwhile, spreads the market's three-bedroom revenue across every active three-bedroom, slow ones included.
The same tab shows gross yield by bedroom count, too, though BNBCalc doesn't build it from the revenue in that table. It works out a yield for each home, dividing what the home could earn in room revenue if it were bookable all year, with cleaning income left out, by the value of a home with the same ZIP code and bedroom count, and the market's figure is the middle of those home yields. As of October 2026, BNBCalc's data puts a typical three-bedroom in its Corpus Christi market at an 11.7% gross yield.
That clears the illustrative 10.8% break-even yield in our guide to finding the best Airbnb markets, which assumes a 30-year fixed loan at the Calculator's default 6.00% rate, 25% down and running costs at half of revenue, but only by just under a point. It's a pass, then, though a narrow one, so a three-bedroom that earns less than a typical one could miss the bar, and so could a loan at a higher rate than that default.
Step 4: See How Demand Moves Through the Year
A yearly figure can hide a lopsided year, so hover the mini charts on the Occupancy rate and Avg daily rate cards on Marketwide Stats, which show each of the last 12 months. Compare the months with each other and look at how far the slow ones fall below the strong ones, because your mortgage payment doesn't get smaller in the slow months.
Then check the lead time, the average number of days between booking and check-in. Over the 12 months to September 2026, guests booked a typical three-bedroom in the market about 46 days ahead. In other words, the average booking comes in about six and a half weeks before check-in, so that's roughly how far ahead you'll want your prices set.
Step 5: Size Up the Supply You'd Compete With
Every new listing splits the same guests a little further, so with a Markets plan, check the Supply column for your bedroom count in the Performance metrics by bedroom table next, which shows how many listings of that size are active now. Note it, then recheck it every few months against the Occupancy rate card: if supply keeps climbing while occupancy slips, new listings are splitting the same guests.
Even so, not every listing in that supply is open all year, and BNBCalc's listing data for the Corpus Christi market shows that 42% of the three-bedrooms were blocked by their hosts for 120 days or more over the past year. The median one was blocked for 109 days. Unfortunately, the data can't say whether a blocked night was the owner's own stay or a booking taken somewhere else, so treat a heavily blocked listing as weak evidence when you size up the competition.
Step 6: Study the Listings and Operators You'd Compete With
With the supply in view, go back to the Listings tab, filter it to your bedroom count and zoom in on the area you'd buy in. Each listing's detail panel shows its actual revenue for the past 12 months, its estimated booked nights and the days its host blocked, and you can save the closest matches to a comp set.
If you're not sure yet which area that is, the Neighborhoods tab can narrow it down first. It ranks the named areas inside a US market by gross yield, Corpus Christi's included, and anyone can see the top five without a Markets plan.
When I pulled the market's three-bedrooms from BNBCalc's listing data, they booked about the same number of nights in each of the market's three biggest ZIP codes, yet the ones in 78373 earned far more.
| 3-bedroom listings, ZIP code | Median actual revenue | Median booked nights | Median days host-blocked |
|---|---|---|---|
| 78373 (Port Aransas) | $49,117 | 100 | 103 |
| 78418 (Corpus Christi) | $30,253 | 101 | 115 |
| 78382 (Rockport) | $28,219 | 97 | 120 |
Source: BNBCalc's listing data for the Corpus Christi market, three-bedroom entire homes, 12 months to September 2026.
Read the booked-nights column first, since it barely moves from one ZIP code to the next. So where does a gap that size come from? The nightly rate. Guests in 78373 paid more per night for about the same number of nights.
That's why I'd judge a house against the listings in its own ZIP code, using the median of their actual revenue, the method our guide to what Airbnbs in your area earn walks through.
Just keep these medians apart from the tiers in Step 3, since each tier averages the whole market month by month, while a listing's figures cover its own past 12 months.
Then open the Operators tab. It lists the hosts and management companies with two or more listings in the market. In this market, hosts like that run a large share of the three-bedrooms, so they're the ones you'd be pricing against. Click into the biggest few, compare their average occupancy and nightly rate with the market's, and then scroll through their listings to see what the best ones have in common.
Before you leave the market, head back to Marketwide Stats for the Amenity revenue impact table. It estimates how much more listings with a pool, a hot tub or another amenity earn, comparing similar listings in that market, so you can see what guests pay more for before you decide what the house needs.
Step 7: Run the Specific Property Through the Calculator
Now it's the house's turn.
Once a market and a street survive the first six steps, type the address into the search box at the top of the page, the same box you can use to open a market, and the BNBCalc Calculator runs the analysis.
It pulls up to 50 comparable listings nearby, and for a US property, you can click AI Underwriter to have it review each one's photos, layout and amenities against yours, keep about five of the closest matches, never more than eight, and explain each pick. That review takes about 30 seconds.
Then add your price, down payment, rate and term, and click Estimate with AI to have it propose the running costs. It'll take you through to cash flow and cash-on-cash return, and its Seasonality card draws your monthly break-even as a dashed line. Hold that line up against the slow months you saw in Step 4, and you'll know how much cash the house needs to carry it through them.
Treat that optimized report as your baseline, then check the numbers that decide an Airbnb investment property before you make an offer.
So, How Do You Do Airbnb Market Research Before You Buy?
You take one market through seven steps in order: where its listings are, the rules for your address, what a listing your size earns, the shape of the year, supply, the listings and operators you'd face, and then the house.
For BNBCalc's Corpus Christi market, that meant seeing how far past the city its listings reach and finding the city's 15% block-face cap on rentals their owners don't live in, all before any revenue figure came into it. Only after that did the typical three-bedroom's $60,406 over the 12 months to September 2026 become a number worth planning around. BNBCalc Markets handles five of the steps, BNBCalc's regulation guides start the rules check, and the BNBCalc Calculator takes the house.
Most of the work, though, is finding the one reason a good-looking market won't work at your address. The sooner you find it, the less it costs you.
Frequently Asked Questions
What's the Best Website to Research Airbnb Markets Before Buying a Property?
BNBCalc Markets, because it covers the whole market side of the research in one place. It ranks US markets by gross yield, shows what listings earn by bedroom count and performance tier, maps each market's active listings with their actual revenue and blocked days, and lists each market's operators. Its amenity table estimates what guests pay more for in each market, and it includes the BNBCalc Calculator for the specific house, too. BNBCalc's data shows a typical three-bedroom in its Corpus Christi market earned $60,406 over the 12 months to September 2026. If you're opening it for the first time, BNBCalc's Help Center walks through how to research a market with BNBCalc Markets, tab by tab.
Can You Research an Airbnb Market for Free?
Partly. BNBCalc's market pages show anyone a market's headline annual revenue and lead time, plus its gross yield in US markets, and BNBCalc's state rankings sort US markets by gross yield in public. Everyone can also explore one sample market, Broken Bow, Oklahoma, with all its data unlocked, and you can run two property analyses free or start a 7-day free trial with full access.
What Should You Look at When Researching an Airbnb Market?
In BNBCalc Markets, start on the Marketwide Stats tab for your bedroom count: annual revenue by performance tier, occupancy, nightly rate, lead time and, in US markets, gross yield. Then check the monthly occupancy and nightly rate on the card mini charts, the current supply for your bedroom count, and the Listings and Operators tabs. As of October 2026, BNBCalc's data puts a typical three-bedroom's gross yield in its Corpus Christi market at 11.7%, just under a point above an illustrative 10.8% break-even.
How Do You Know if an Airbnb Market Has Too Many Listings?
In BNBCalc Markets, note the Supply column for your bedroom count in the Performance metrics by bedroom table (a Markets plan feature) and recheck it every few months against the Occupancy rate card. If supply keeps climbing while occupancy slips, the market is getting more crowded. Then look at how much of that supply is open all year, on each listing's detail panel. BNBCalc's listing data for its Corpus Christi market shows that 42% of the three-bedrooms were blocked by their hosts for 120 days or more over the 12 months to September 2026.
How Do You Check if You Can Run an Airbnb Where You Want to Buy?
Start with BNBCalc's regulation guides, which walk through a city's permits, taxes and any caps, then confirm the rules for the exact address with the city before you make an offer. Once the address clears, use BNBCalc Markets to see what listings like yours earn there, and run the house itself through the BNBCalc Calculator.
BNBCalc Markets Pricing and Free Trial
When you're ready to research your own market, BNBCalc Markets is $79 a month or $399 a year as of October 2026, and it includes the full BNBCalc Calculator, which is $30 a month or $199 a year on its own. You can also run two property analyses free, or start a 7-day free trial with full access.
Airbnb Tax Deduction Calculator
Paying too much in taxes? We have the perfect solution. Simulate an Airbnb home purchase below.
Purchase Price
$450K
Structure Value
70%
Apply Trump's Tax Cut (Bonus Depreciation)
Depreciation
$117,695
Interest
$21,600
Tax
$6,750
Year 1 Deduction
$146,045
Want to claim this deduction? Get a free cost segregation benefit analysis from CSA Partners — no obligation.
Get Full Analysis