
Free instant analysis
Reveal Airbnb revenue for any address or city
How do you find out what Airbnbs in your area earn? Well, the good news is you can get a solid answer in an afternoon, as long as you start with a market's headline numbers and then narrow down to the listings that match the place you'd buy.
The catch is that "what Airbnbs earn" isn't one number. When I looked up Austin, Texas, on BNBCalc in October 2026, a 2-bedroom earned anything from $14,302 to $85,903 a year, depending on which listings I counted. Both of those numbers are real.
The tool I'd use for this is BNBCalc Markets, because it shows you what each listing on your own streets earned over the past year. I'll walk you through the steps using Austin and ten 2-bedroom listings in its 78704 ZIP code, so by the end you'll know which number to plan around for your own street.
How Much Does a 2-Bedroom Airbnb Make in Austin?
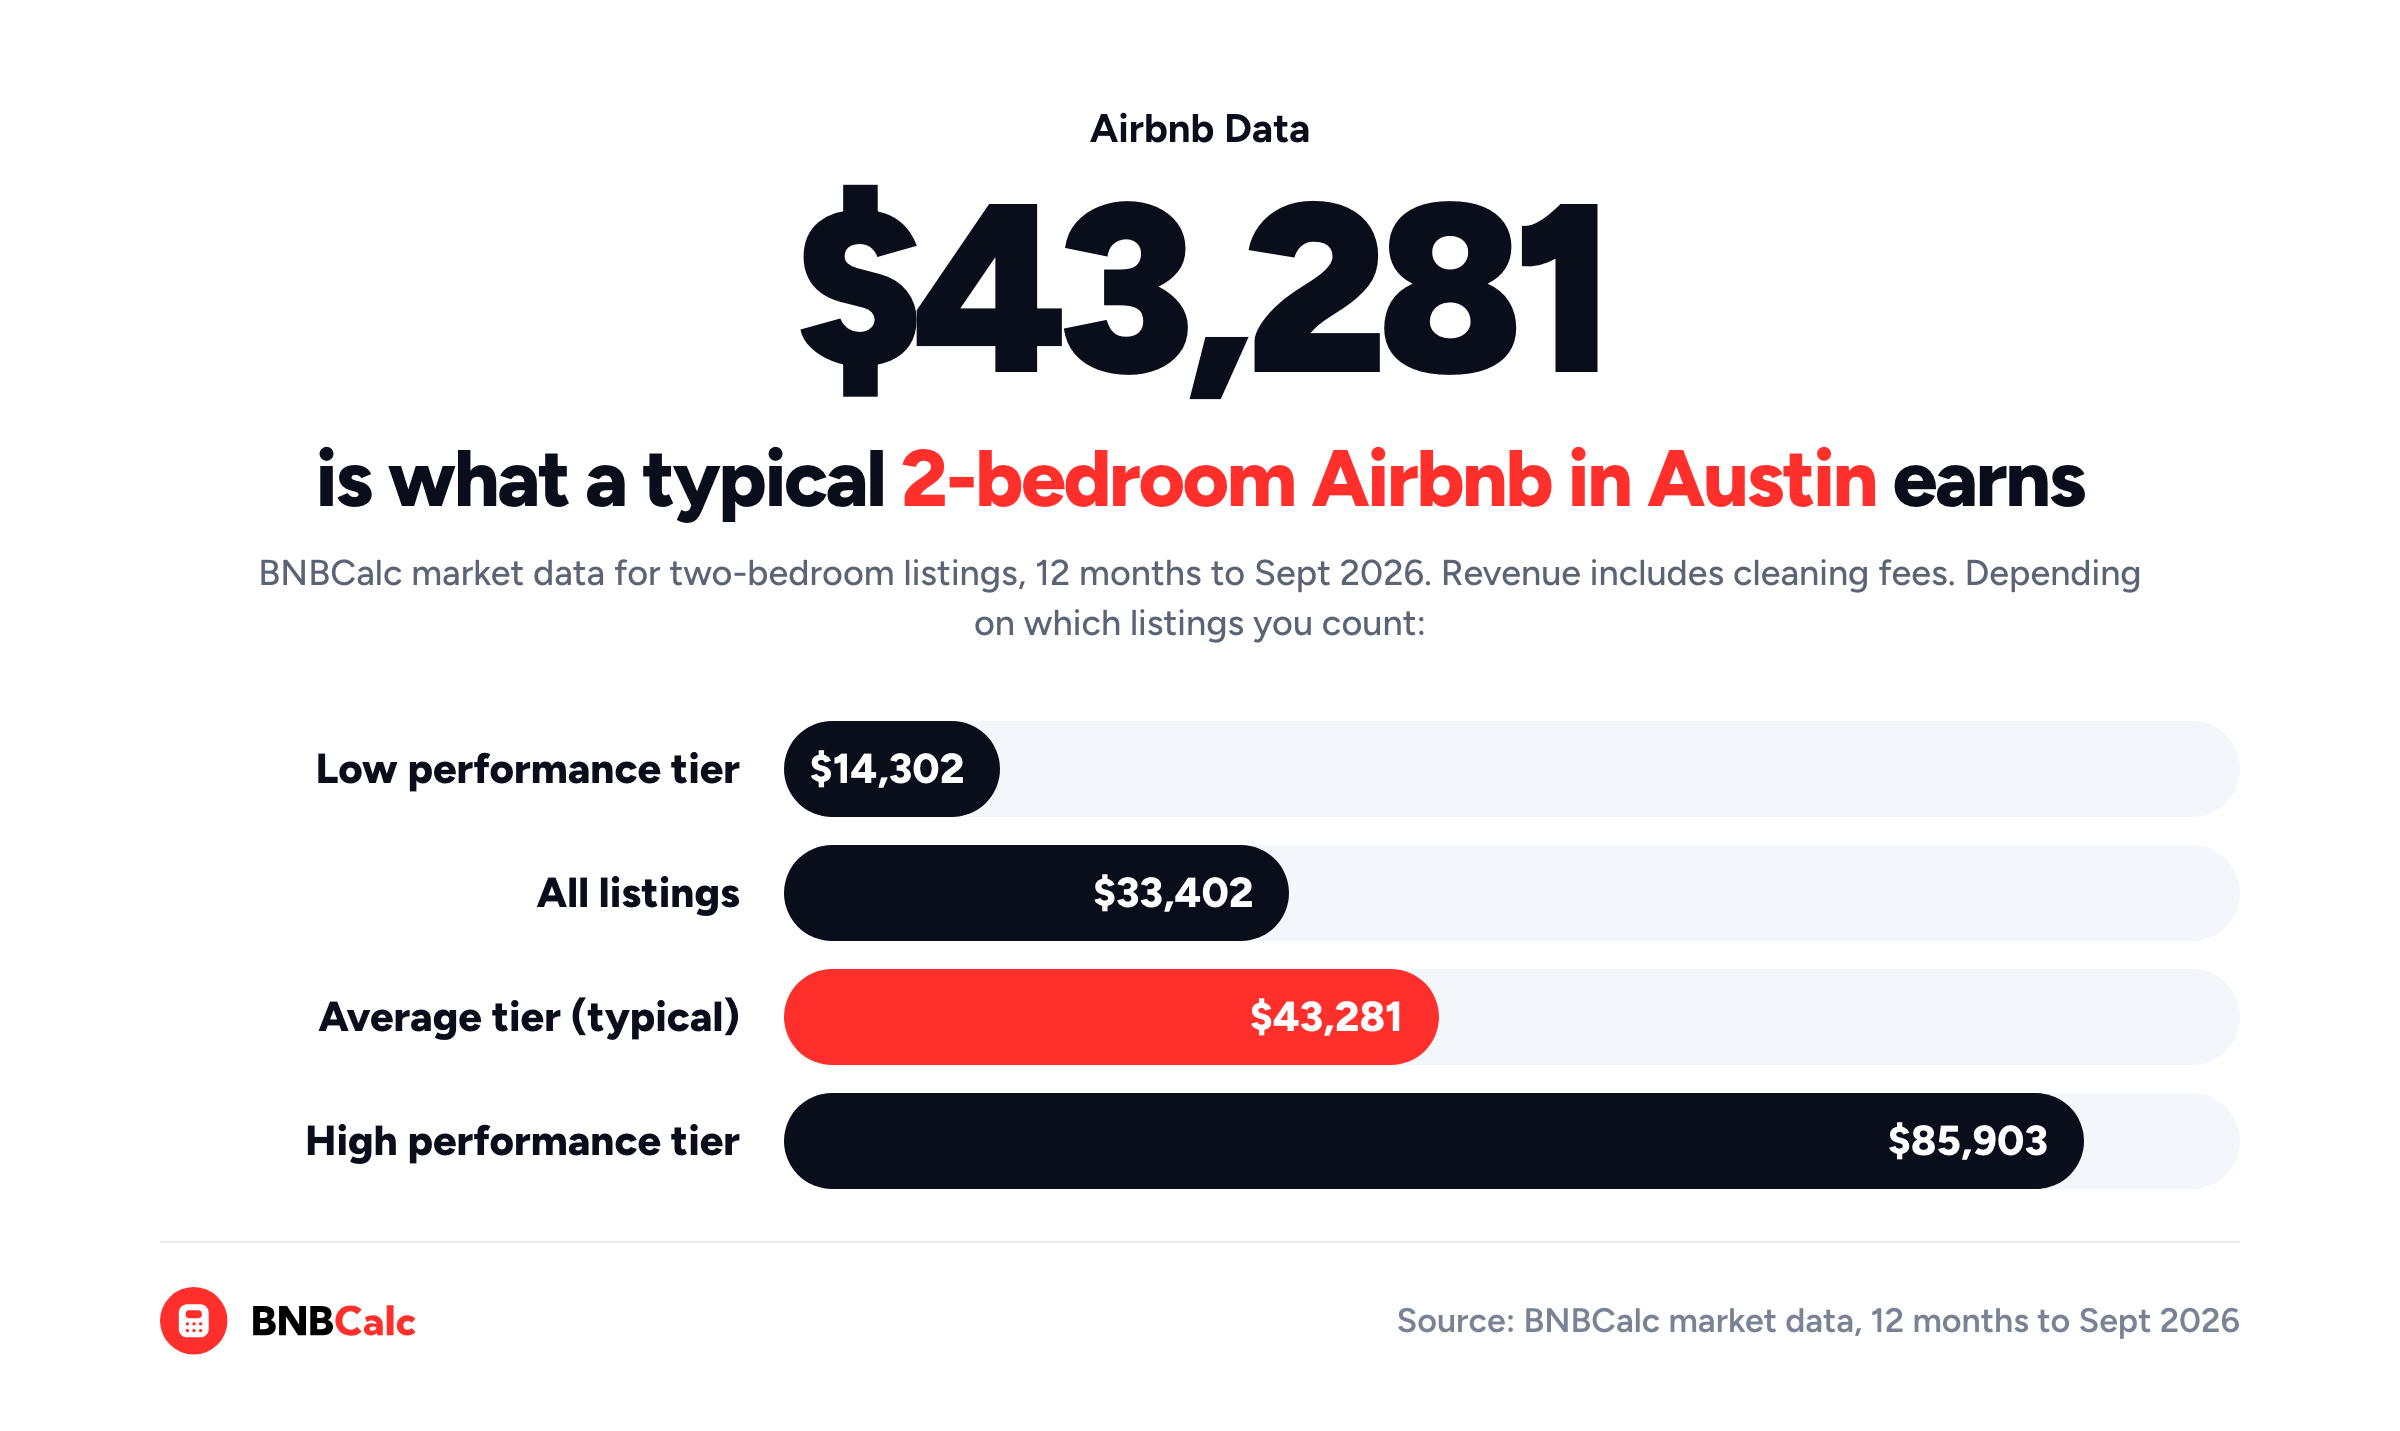
BNBCalc's Austin market data shows a typical 2-bedroom Airbnb there earned $43,281 in annual revenue over the 12 months to September 2026. But that's only one of four ways to slice the same listings, and each one gives you a different answer.
| Slice of Austin's 2-bedroom listings | Annual revenue | Occupancy | Nightly rate (ADR) |
|---|---|---|---|
| Low performance tier | $14,302 | 24.1% | $178 |
| All listings (market-wide average) | $33,402 | 37.3% | $227 |
| Average performance tier (a typical listing) | $43,281 | 50.3% | $207 |
| High performance tier | $85,903 | 55.5% | $338 |
Source: BNBCalc market data, Austin, Texas, two-bedroom listings, 12 months to September 2026. Annual revenue includes cleaning fees.
Each row counts a different group of the same 2-bedroom listings, so reading down the revenue column shows how much the answer depends on which ones you count. The all-listings average sits below the typical figure because it takes in every 2-bedroom, including the slow ones in the low tier that booked about a quarter of their bookable nights.
Keep in mind that annual revenue and the nightly rate (ADR) both include cleaning fees. Occupancy, meanwhile, leaves out the nights a host blocked, since it's booked nights divided by bookable nights, as BNBCalc's metric definitions page explains.
And don't try to work out the revenue figure from the nightly rate and occupancy, because these are averages across many listings, and averages don't multiply that way.
Those four figures cover the whole city, so to see where a place like yours would land, you'll want the listings on your own streets.
How to Find What Airbnbs in Your Area Earn, Step by Step
You'll find that 2-bedroom split and the listings on your own streets in BNBCalc Markets, so that's where I'd start for any area. Even when you're logged out, a market page shows its headline annual revenue and, in most markets, its occupancy and nightly rate. BNBCalc's ranking pages by state are fully public, too, and as of October 2026 they list 487 US markets and rank the 477 that have one by gross yield, which divides each home's yearly room-revenue potential by a home value matched to its ZIP code and bedroom count and takes the median.
For what individual listings earned, you'll want the Markets plan, which also includes the full BNBCalc Calculator. With it, you can browse a market's listings on a map and filter them by bedrooms and performance tier. Each listing's detail panel then shows its actual and potential annual revenue, nightly rate, nights available, estimated nights booked, occupancy of available nights and how many days the host blocked that year.
Still, those numbers only help if you read them the right way, so let's go through the check one step at a time.
Step 1: Check Which Listings a Headline Counts
Before you compare a headline with any other figure, check which performance tier, bedroom count and 12 months it covers. When I opened Austin's market page logged out on October 15, 2026, the headline tile read $51.5k a year, 46% occupancy and $265 a night, while the summary text under it said $47K a year.
Both of those cover every bedroom size, but the tile is the average performance tier and the $47K is the average across all listings. Logged out, the tier and bedroom count stay locked. On the Markets plan, however, you can switch them to your own bedroom count and any tier, which is how you'd see Austin's 2-bedroom split for yourself.
Step 2: Pull Up the Listings Like Yours
Next, zoom the map to the streets you'd buy on and filter to your bedroom count. If that leaves only a handful of listings, widen the map a little. A median from a handful can swing by thousands when a single listing comes or goes, so I wouldn't lean on fewer than a few dozen of the same size.
You can't do this by searching Airbnb with dates, by the way. Airbnb's help pages say all places that appear in a dated search should be available, and that a listing won't show up if it's blocked for the dates you searched, so that kind of search leaves out every place that's booked or blocked. You'd miss the places guests picked.
Step 3: Take the Median of Their Actual Revenue
Once you've got the right listings, take the median of their actual annual revenue, since that's what places like yours earned over the past 12 months. That's your baseline.
Each listing's detail panel also shows a potential revenue figure. That's BNBCalc's estimate of what the listing would've earned if it had been bookable all year, at the rate it booked its open nights, which means the gap between the two comes down to the days its host blocked. You'll find those on the same page, too, so you can see how much of the year each listing was open.
Step 4: Check the City's License Records
As a last check, see whether your city publishes its active short-term rental licenses. Austin does, with an open-data file of "the general neighborhood and zip code location of active short term rentals," which you can filter down to 78704 to see which blocks already have one. It doesn't record bedrooms or earnings, though, and it can't tell you what the local rules allow. For that, BNBCalc's regulation guides by city cover Austin and plenty of other places.
What Do 2-Bedroom Airbnbs in Austin's 78704 Actually Earn?
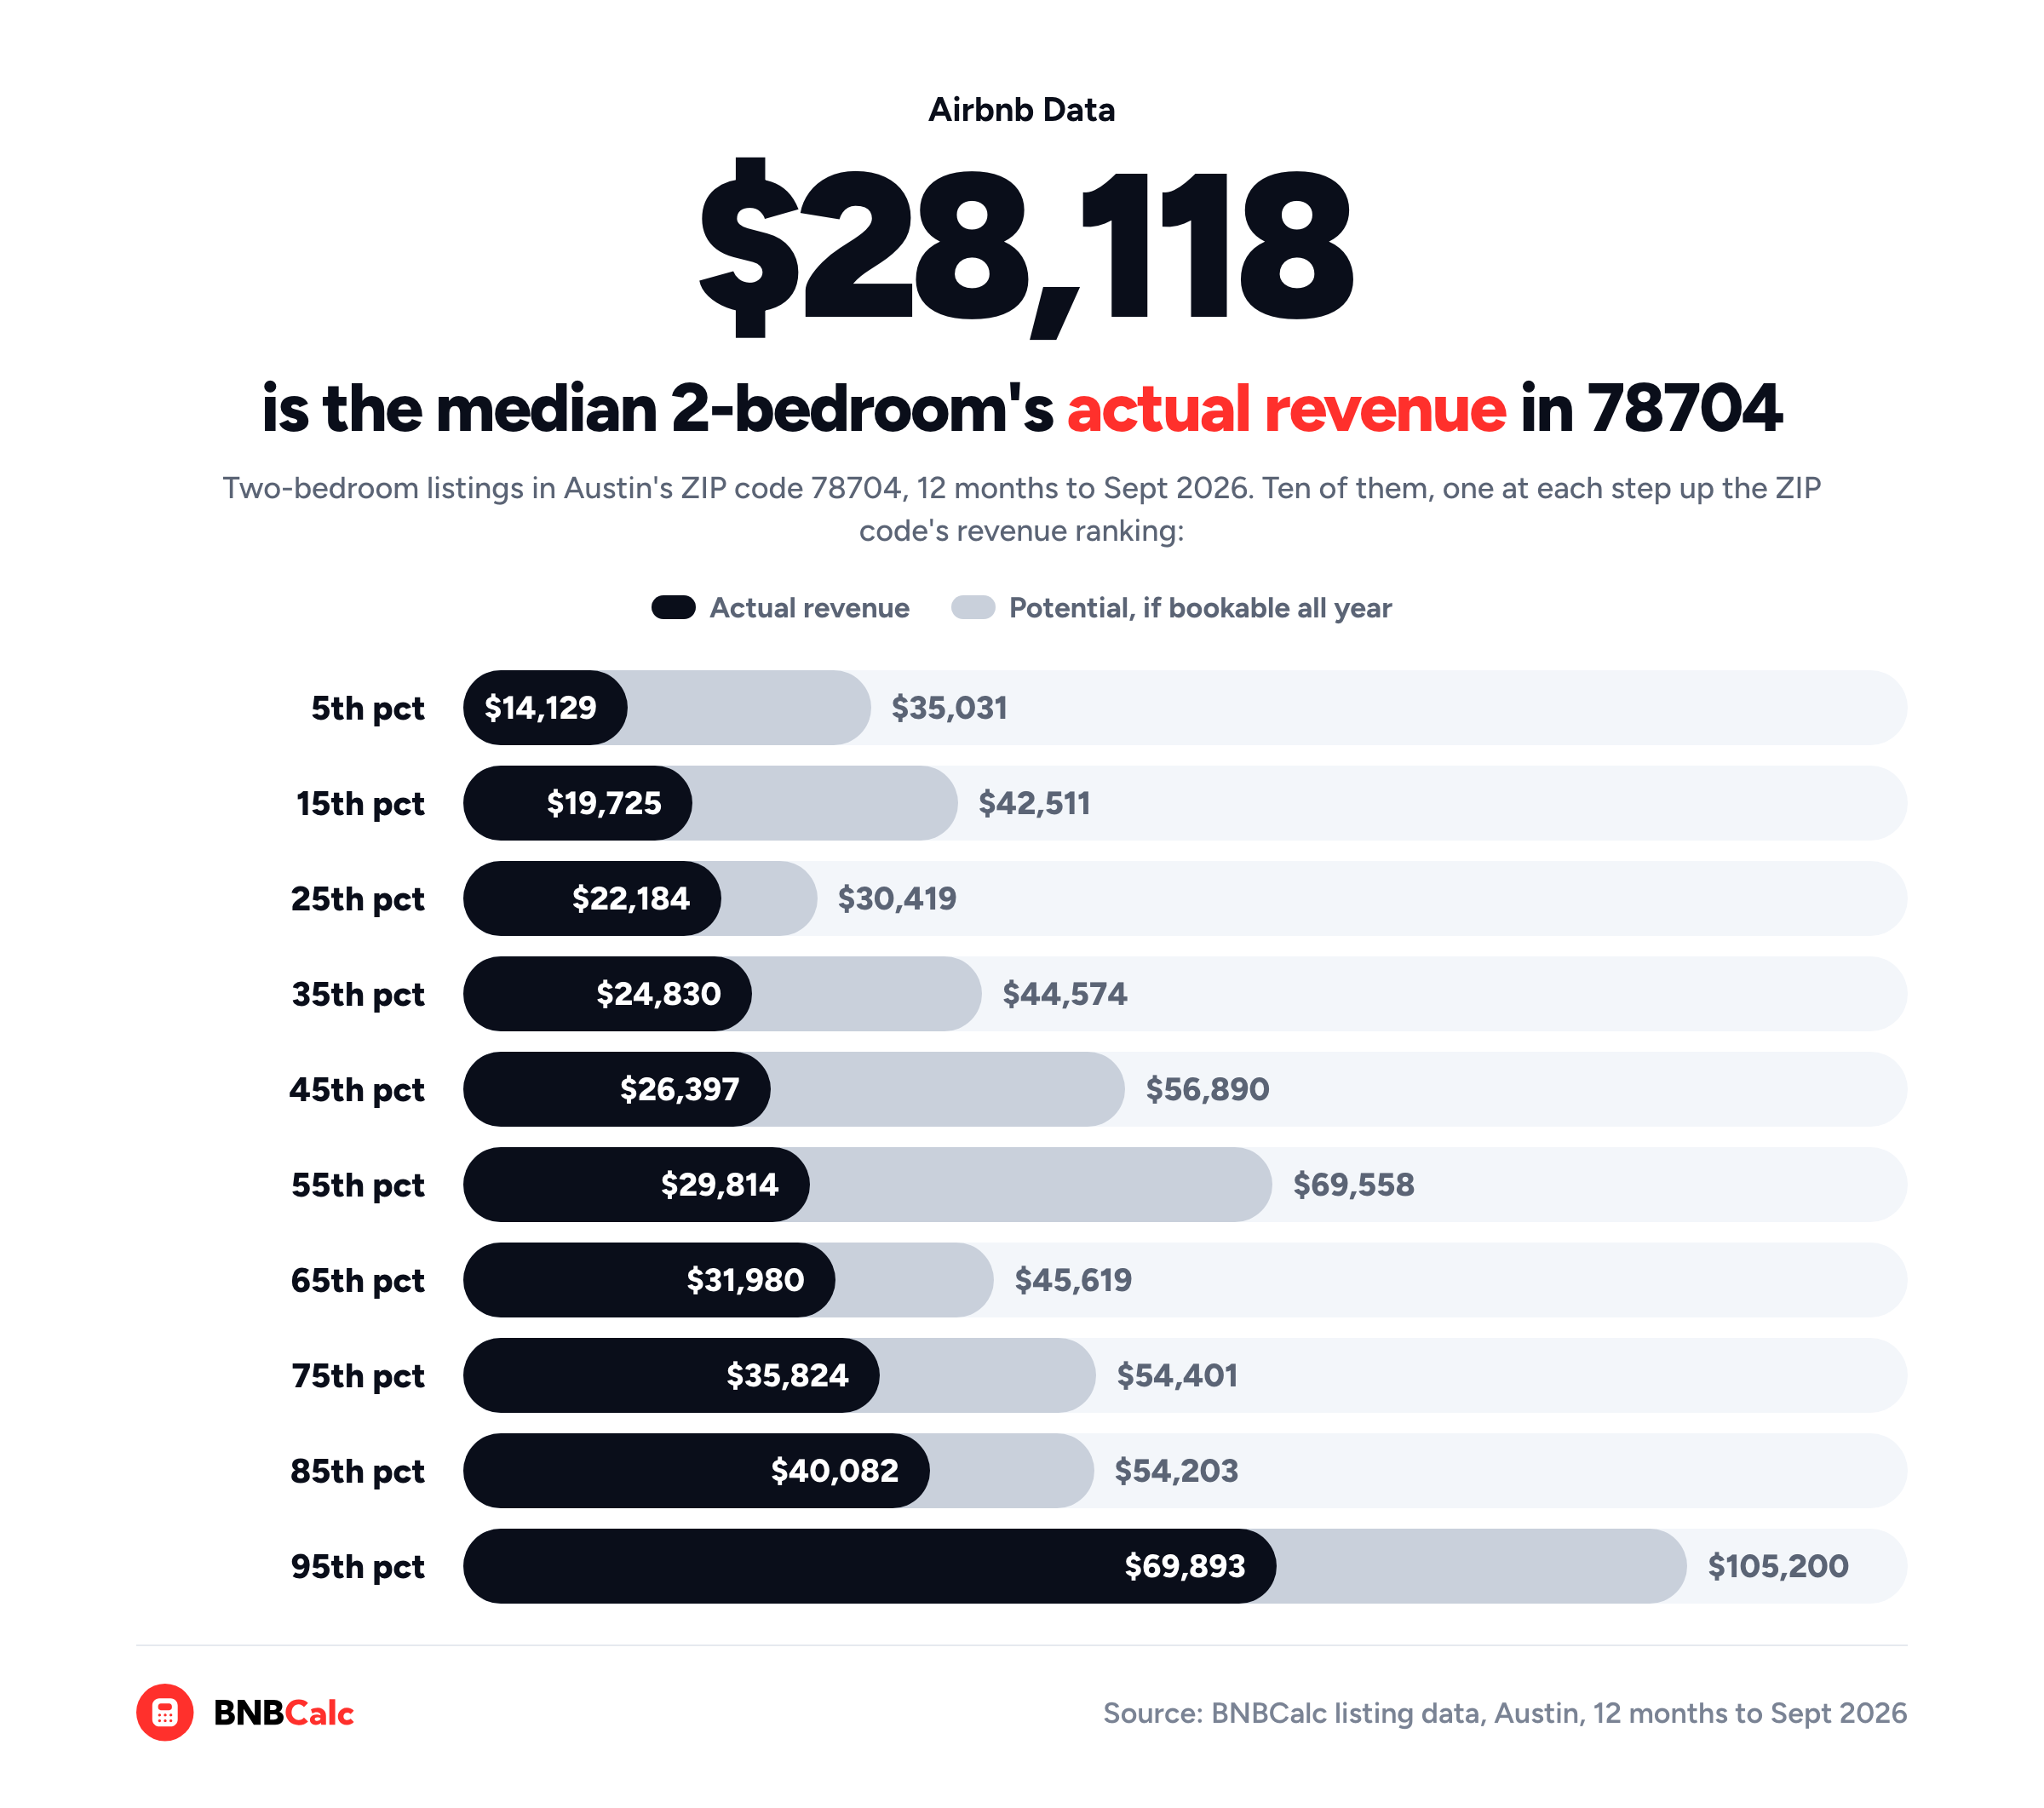
To see those steps with real numbers, I grouped BNBCalc's Austin listing data by ZIP code and pulled every 2-bedroom in 78704 for the 12 months to September 2026. Then I picked ten of them, one from each tenth of the ZIP code's revenue ranking, and left out names, hosts and exact locations.
| Percentile rank in 78704 | Days host-blocked | Nights booked | Occupancy of available nights | Actual revenue | Potential revenue |
|---|---|---|---|---|---|
| 5th percentile | 218 | 74 | 50% | $14,129 | $35,031 |
| 15th percentile | 196 | 96 | 57% | $19,725 | $42,511 |
| 25th percentile | 99 | 101 | 38% | $22,184 | $30,419 |
| 35th percentile | 162 | 126 | 62% | $24,830 | $44,574 |
| 45th percentile | 196 | 86 | 51% | $26,397 | $56,890 |
| 55th percentile | 209 | 117 | 75% | $29,814 | $69,558 |
| 65th percentile | 110 | 143 | 56% | $31,980 | $45,619 |
| 75th percentile | 125 | 156 | 65% | $35,824 | $54,401 |
| 85th percentile | 96 | 124 | 46% | $40,082 | $54,203 |
| 95th percentile | 123 | 160 | 66% | $69,893 | $105,200 |
Source: BNBCalc's Austin listing data for 2-bedroom listings in ZIP code 78704, 12 months to September 2026, hotel listings left out; shares of the full year in the text are nights booked divided by 365.
Each row is one listing, from the slowest earner at the top to the strongest at the bottom, and its occupancy leaves out the nights its host blocked. Take the 55th percentile listing, for example: its host blocked 209 days, and it booked 75% of the 156 nights left. Those 117 booked nights come to about a third of the year, and they earned it $29,814. BNBCalc puts its potential revenue at $69,558, which is what it would've earned open all year at that same 75%.
It isn't the only one, either. Blocked days run through the whole ZIP code, and at the median, its 2-bedrooms booked 53% of their available nights, yet only 33.2% of the full year, since the median listing had 237 available nights and its host blocked 128 days. In fact, 92.5% of them were blocked for 90 days or more. Unfortunately, there's no telling from the data whether a blocked night was the owner's own stay, a booking taken somewhere else or a stretch when the listing wasn't open at all.
Now, if you take every 2-bedroom in 78704 and ask what this ZIP code "earns," you'll get four honest answers.
| Way of counting (every 2-bedroom in 78704) | Annual revenue |
|---|---|
| Median actual revenue | $28,118 |
| Average actual revenue | $31,869 |
| Average of the top half by actual revenue | $42,200 |
| Median potential revenue | $44,707 |
Source: BNBCalc's Austin listing data, 2-bedroom listings in ZIP code 78704, 12 months to September 2026.
The median and the average both show what a typical listing here earned, and the average sits a little higher because a few strong listings, like the one at the 95th percentile, pull it up. Meanwhile, the top-half average shows what the stronger half earned, and the median potential shows what these listings would've earned with every night open.
For a 2-bedroom in 78704, then, I'd use the $28,118 median as the baseline and open the top earners to see what they do differently.
If you'd rather read Austin by neighborhood than by ZIP code, BNBCalc has public pages for selected areas such as Travis Heights, and you can open them without an account. Each page sets the area's yearly revenue, occupancy and nightly rate against the whole Austin market, and its table of nearby areas links on to others, like Bouldin Creek and South Lamar. Remember, though, that those pages leave out listings open fewer than 127 nights a year and lead with an average across every home size, while every figure in this section is for 2-bedrooms in the 78704 ZIP code, so don't set one against the other.
How to Compare Airbnb Earnings Between Two Areas
Once you've got a number for your own area, you'll probably want to set it beside another one, and that only works if you compare like with like: actual revenue against actual, for the same bedroom count, over the same 12 months. If you plan to block weeks for your own use, you'll also want listings that block about as much, because a place open 150 nights and one open 270 are running two different businesses.
Keep the two kinds of BNBCalc figures apart, too. A market page builds its tiers from the whole market's monthly figures, while each listing's numbers cover its own past 12 months, so don't set a ZIP median from the listings against one of those tiers. That's why, when I lined up two Austin ZIP codes, I pulled every group from BNBCalc's Austin listing data.
| Austin listing group | Median actual revenue | Median days blocked |
|---|---|---|
| 2-bedroom, ZIP 78704 | $28,118 | 128 |
| 2-bedroom, ZIP 78702 | $31,026 | 122 |
| 3-bedroom, ZIP 78704 | $41,701 | 134 |
| 3-bedroom, ZIP 78702 | $37,994 | 113 |
Source: BNBCalc's Austin listing data, 12 months to September 2026, hotel listings left out.
Read the table one bedroom count at a time. The median 2-bedroom in 78702 earned more than the one in 78704, but with 3-bedrooms the two ZIP codes swap places, so make sure you compare the size you'd buy. Their hosts blocked a similar share of the year, too, a median of 113 to 134 days, so neither group comes out ahead by staying open longer.
So, How Do You Find Out What Airbnbs in Your Area Earn?
Start with a market page for the headline, then pull up the listings like yours, check how many nights each one was open and take the median of what they earned. For the 2-bedrooms in Austin's 78704, that median came to $28,118 over the 12 months to September 2026. That's the baseline I'd build on. BNBCalc Markets puts those listing-level numbers on a map, so it's the place to look up your own streets.
Almost every number you'll see about an area answers a narrower question than its label lets on. Most disagreements between two figures stop being confusing once you ask which listings each one counts, which nights it divides by and which 12 months it covers. And the one worth planning around is usually the plainest: what places like yours earned over the past year.
Frequently Asked Questions
Is There a Free Tool to See How Much Airbnbs Make in My Area?
Yes, BNBCalc's market pages are free to view without an account. Each one shows a market's headline annual revenue for the past 12 months and, in most markets, its occupancy and nightly rate, while BNBCalc's rankings of US markets by state are fully public, too. For what each listing on your street earned, you'll want the listing-level data in BNBCalc Markets, which is $79 a month as of October 2026.
How Do I Find Out What Airbnbs in a Specific Neighborhood Earn?
If BNBCalc has a public page for the neighborhood, start there. Those pages cover selected neighborhoods in Austin, Tampa and Orlando, such as Travis Heights in Austin, and you can open them without an account. Each page sets the area's yearly revenue, occupancy and nightly rate over the past 12 months against the whole market. In any US market with published neighborhoods, the Neighborhoods tab in BNBCalc Markets ranks them by gross yield, and BNBCalc's Help Center shows how to see Airbnb data by neighborhood or ZIP code. Anywhere else, open BNBCalc Markets, zoom the map to the neighborhood, filter the listings to your bedroom count, and take the median of their actual annual revenue. For BNBCalc's two-bedroom listings in Austin's 78704 ZIP code, that median came to $28,118 over the 12 months to September 2026. Each listing's detail panel also shows how many days its host blocked, so read that next to its revenue.
Where Can I Find Airbnb Occupancy Rates by ZIP Code?
In BNBCalc Markets, zoom the map to the ZIP code's streets and filter to your bedroom count. The occupancy above the listings then shows the average for the listings in view, counting booked nights against the nights their hosts left open. BNBCalc's two-bedroom listings in Austin's 78704 ZIP code, for example, booked a median 53% of their available nights over the 12 months to September 2026, or 33.2% of all 365 nights.
How Much Do Top-Performing Airbnbs Earn Compared With a Typical One?
BNBCalc Markets sorts each market's listings into low, average and high performance tiers, and you can switch a market page between them. On Austin's market page, two-bedrooms in the high performance tier earned $85,903 over the 12 months to September 2026, nearly twice the $43,281 a typical one earned in the average tier. The low tier earned $14,302, and all two-bedrooms together averaged $33,402.
How Do I Compare Airbnb Earnings Between Two ZIP Codes?
In BNBCalc Markets, zoom the map to each ZIP code's streets in turn, filter to the same bedroom count, and compare the median actual revenue of the listings in each over the same 12 months. BNBCalc's two-bedroom listings in Austin's 78702, for example, earned a median $31,026 over the 12 months to September 2026, against $28,118 in 78704. With three-bedrooms, 78704 came out ahead, $41,701 to $37,994, so make sure you compare the size you'd buy.
BNBCalc Markets Pricing and Free Trial
When you're ready to see what the listings on your own streets earned, BNBCalc Markets is $79 a month or $399 a year as of October 2026, and it includes the full BNBCalc Calculator. You can compare the plans, run two property analyses free, or start a 7-day free trial with full access.
Airbnb Tax Deduction Calculator
Paying too much in taxes? We have the perfect solution. Simulate an Airbnb home purchase below.
Purchase Price
$450K
Structure Value
70%
Apply Trump's Tax Cut (Bonus Depreciation)
Depreciation
$117,695
Interest
$21,600
Tax
$6,750
Year 1 Deduction
$146,045
Want to claim this deduction? Get a free cost segregation benefit analysis from CSA Partners — no obligation.
Get Full Analysis