
Free instant analysis
Reveal Airbnb revenue for any address or city
What's an Airbnb heatmap tool, and how do you use one to pick where to buy? Well, it's a map that colors a market's listings, or its neighborhoods, by one measure. When I lined up the top neighborhoods in BNBCalc's Indianapolis, Indiana market by revenue and then by yield, Near Southside and Old Southside showed more potential room revenue than three of the other four, yet ranked last of the five on gross yield, at 20.1%.
The first look, by revenue, shows you where listings bring in the most money. The second, by gross yield, shows where they bring in the most for what the house costs. Those aren't always the same places, because gross yield sets each home's revenue against what a home like it costs in its ZIP code, and that's how New Castle and Henry County out-yields Near Southside, at 20.8%, on a little over half the revenue in BNBCalc's October 2026 data.
So I'll show you what each of BNBCalc's heatmap views colors and how to read its shades, then walk the screen step by step, from a dark cluster on the map to one address in the BNBCalc Calculator.
What Is an Airbnb Heatmap?
An Airbnb heatmap is a map of a market's short-term rentals shaded by a number, so you can see where the strong ones cluster without opening each listing. In BNBCalc Markets, each active listing is a dot on the market's map, and the Heatmap setting in the Filters panel decides what the shades mean, with five views to choose from. Two of them only work in US markets, since they need US home values.
| View | What each dot's shade shows |
|---|---|
| Revenue (the default) | The listing's potential revenue: what it would earn if it were open to book all 365 days, at its actual nightly rate and occupancy |
| Gross yield (US) | That potential revenue with its cleaning portion left out, divided by the estimated home value for the listing's ZIP code and bedroom count |
| Est value (US) | The estimated home value for the listing's ZIP code and bedroom count |
| Performance | Whether the listing is High, Average or Low compared with same-size listings |
| Nightly rate | The average price per booked night |
Each row is one way to shade the same dots, and a color legend on the map shows which shade is which, with the darkest dots at the top. On top of that, in the Revenue view the top 50 listings get a pill on the map with their figure, such as "$85K", which makes the leaders easy to find. The market's Neighborhoods tab does the same job one level up, shading whole neighborhoods by a measure such as gross yield or potential room revenue.
You'll need the Markets plan for the full map, and it includes the BNBCalc Calculator. Without it, you can still use the heatmap and filters on a sample of each market's listings, but revenue and occupancy are masked on most of them and each listing's detail panel stays locked. If you'd like to try the heatmap first, Broken Bow, Oklahoma is open to everyone with all its data.
Revenue vs Gross Yield: Which Airbnb Heatmap Should You Use?
Use both, in that order. The Revenue view shows where listings bring in the most money, while the Gross yield view shows where they bring in the most for what the house costs. If you're borrowing to buy, the second one matters more, because your loan payments depend on the price.
Since the Revenue view shades potential revenue, a listing whose owner blocks half the year doesn't look weak just because it's often closed. Its shades are set across the whole market, though, so every listing gets ranked against every other one, whatever its size.
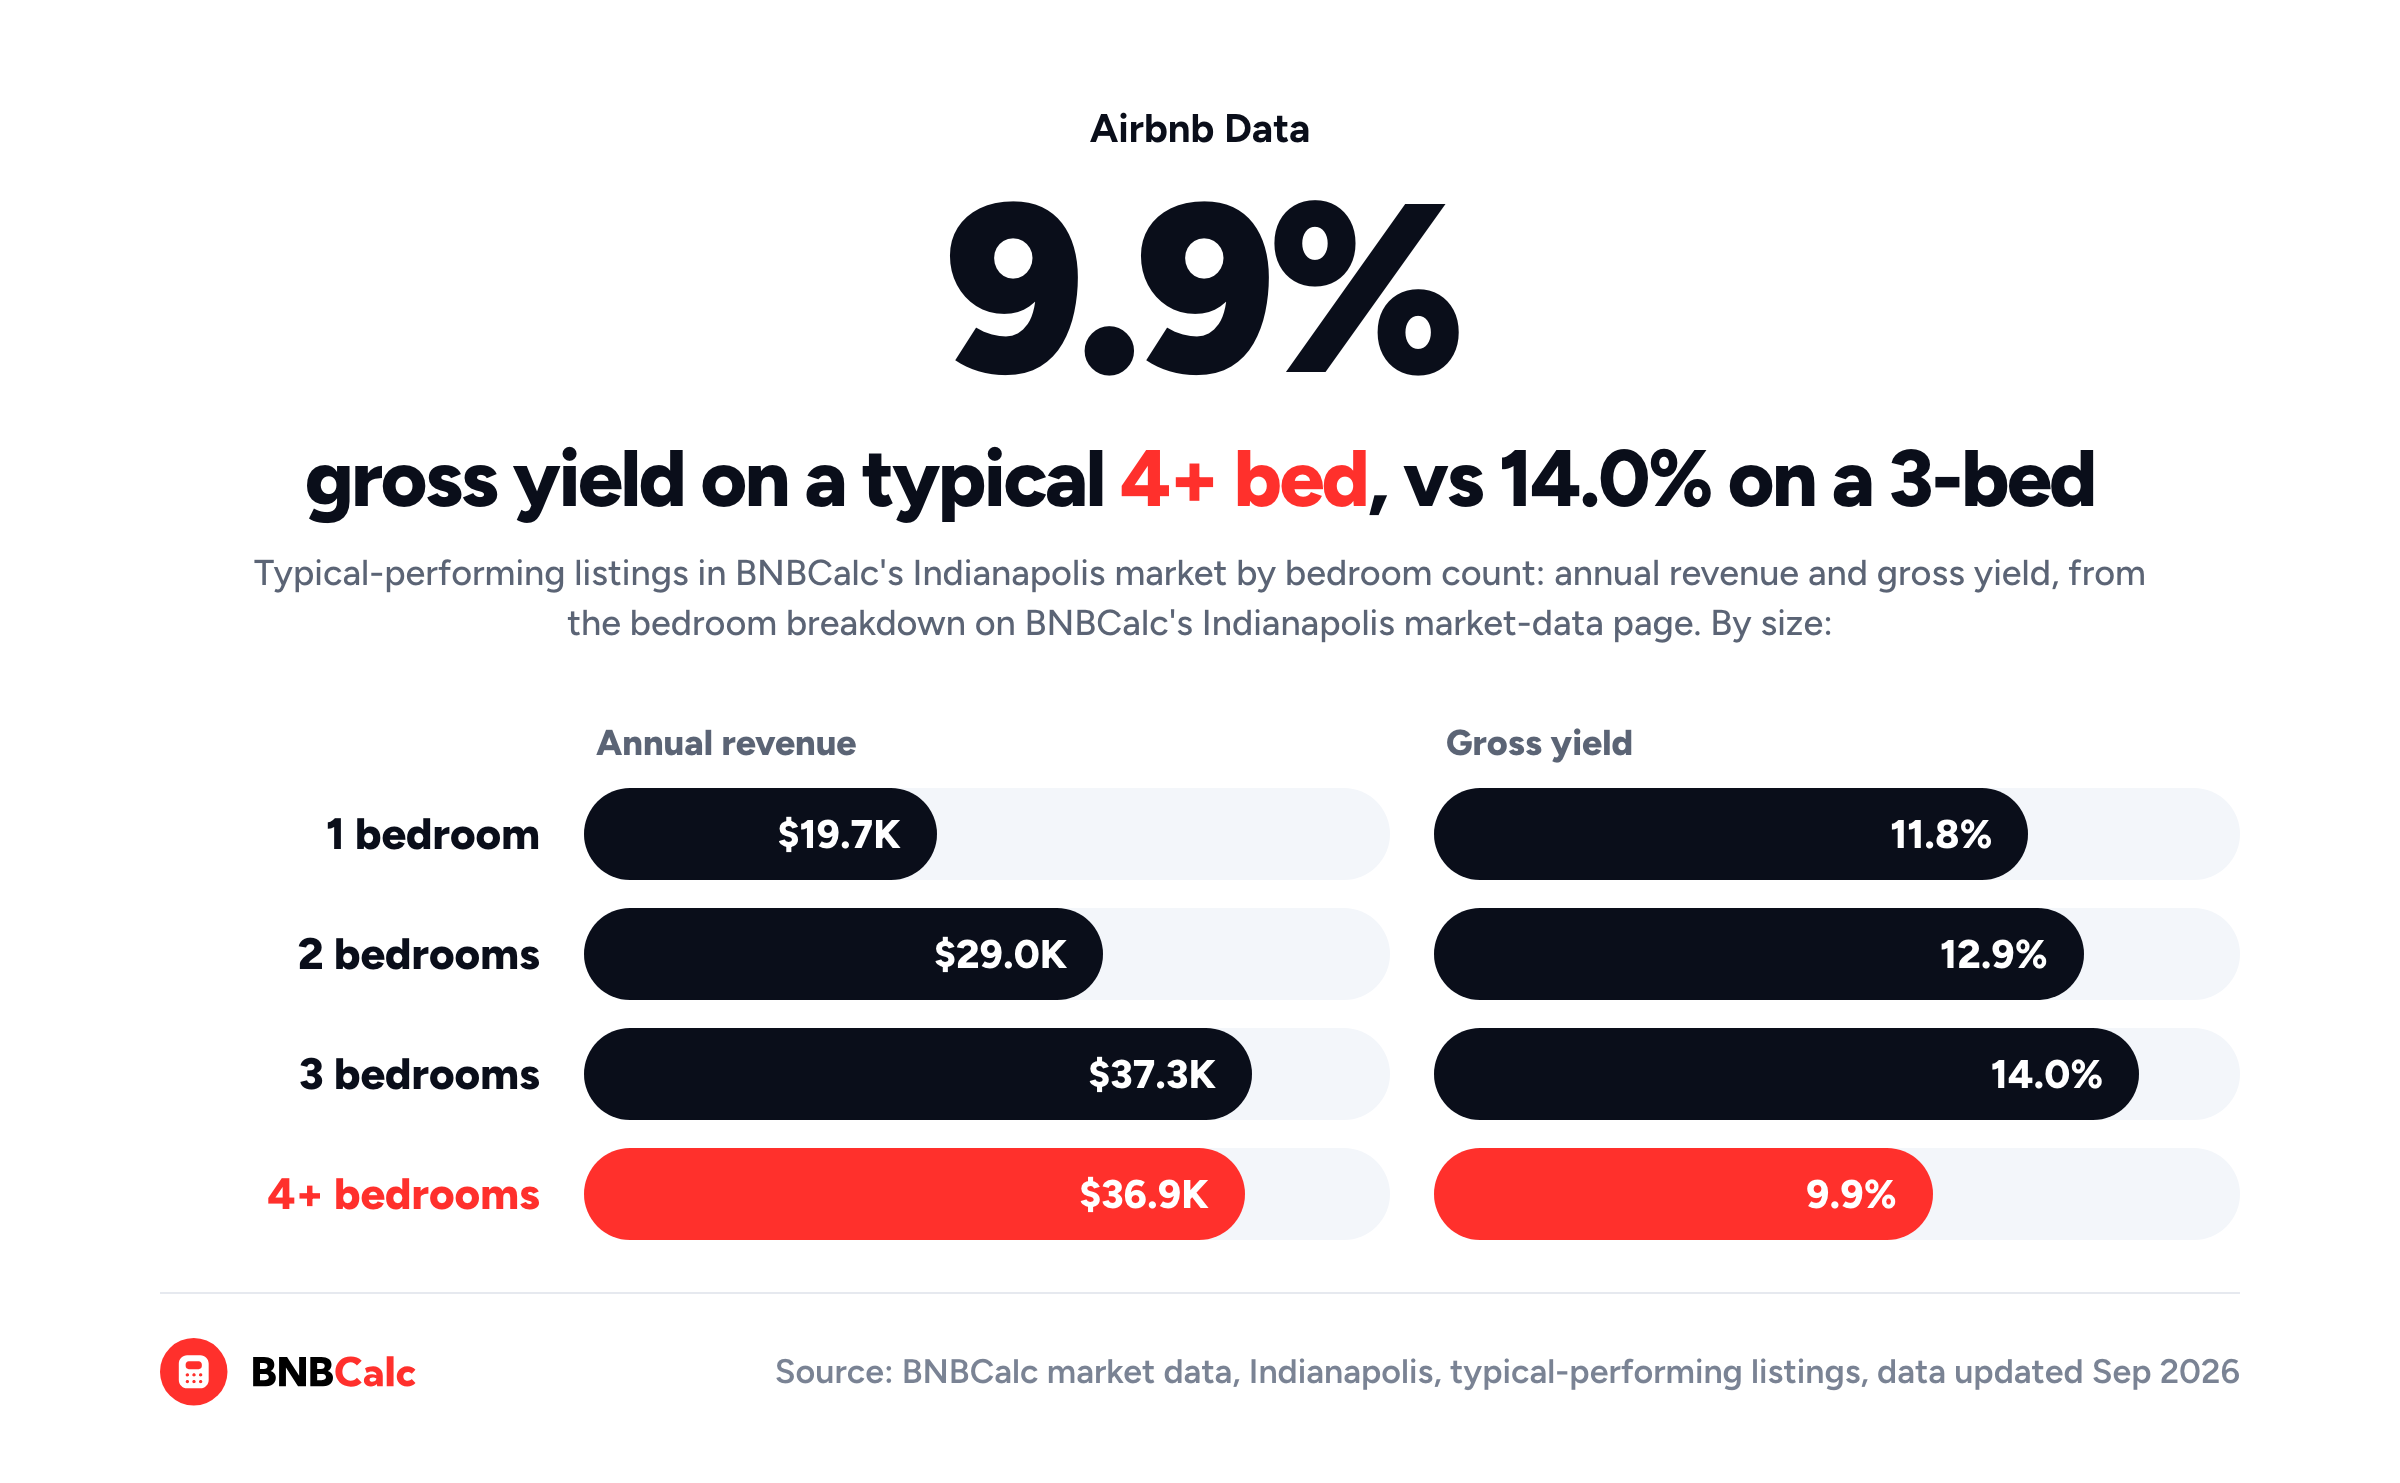
So bigger houses look hotter. BNBCalc's bedroom breakdown for Indianapolis puts a typical three-bedroom at $37.3K a year, against $19.7K for a typical one-bedroom, which is why you'll want to filter the map to the size you'd buy before you read it.
The Gross yield view, by contrast, sets that revenue against what the house costs, and bigger houses cost more. On that same BNBCalc breakdown, a typical four-plus-bedroom brings in about what a three-bedroom does, $36.9K against $37.3K, yet its gross yield comes out at 9.9%, against 14.0%.
The same thing happens between areas, and the price is why. Every three-bedroom in the same ZIP code carries the same estimated value, so inside one ZIP code the yield shades follow each listing's room revenue. Across ZIP codes, however, the price changes, and an area where houses cost twice as much has to earn twice as much just to hold the same gross yield.
Keep in mind, too, that gross yield leaves a lot out, since BNBCalc's market pages say it's "before expenses and financing." It tells you where the price leaves room, not what you'll keep. And if you're still choosing a market, the same split shows up between whole markets, as I found when I ranked US markets by gross yield.
How to Screen a Market With BNBCalc's Airbnb Heatmap
I'd run the same five steps on any US market in BNBCalc Markets.
Step 1: Filter the Map to the Size You'd Buy
Open the market from the search box, go to its Listings tab and open Filters. Then set the Bedrooms range to the house you're shopping for, so you're comparing three-bedrooms with three-bedrooms.
While you're there, make sure to check where the market's listings actually sit, since a BNBCalc market can cover a whole region rather than one city's limits. When I placed each ZIP code's listings at their middle point and looked up that point's county with the Census Bureau's geocoder, a little over half of the listings sat in Marion County, home to Indianapolis, and about one in ten in Hamilton County. The rest spread across Indiana as far out as Lafayette, Muncie and Terre Haute.
Step 2: Find the Dark Clusters in the Revenue View
Leave the heatmap on Revenue and zoom toward the darkest clusters. As you move the map, the numbers above the listing cards update for whatever's in view. They show Annual rev, Occupancy and Nightly rate next to the market average, so you can see how far a cluster runs ahead of the market as a whole.
Annual rev there is the average potential revenue of the listings in view, the same measure the dots use.
Step 3: Switch to Gross Yield and See What Stays Dark
Then switch the heatmap to Gross yield and look at the same streets again. A cluster that stays dark earns a lot for what houses cost there, whereas one that fades was earning a lot on expensive houses. If you only want the strong ones on screen, set the Gross yield filter to more than 15%, which hides every listing below it.
Step 4: Open the Detail Panels in the Cluster
Next, open a few listings in the cluster to see what's behind the color. Click Stats on a listing card and its detail panel opens. Under Revenue stats, you'll see the listing's annual revenue potential and the cleaning portion it includes, its estimated home value, its gross yield and its performance rating, and under Past 12 months, what it earned, how many nights it was open and its occupancy of those nights.
That gross yield is the same figure the map's colors and filter use, so the panel and the dot you clicked tell the same story. Still, make sure to set the listing's potential against what it earned before you use it as a benchmark, because a home that's blocked off for much of the year can show a potential well above its earnings. Once you've found the listings closest to the house you'd buy, + Add saves them to a comp set you can come back to.
Step 5: Run One Address Through the BNBCalc Calculator
There's no button that sends a listing from Markets to the Calculator. Instead, find a house for sale in the area you've shortlisted and type its address, or paste its Zillow link, into the search box.
The BNBCalc Calculator then pulls up to 50 comparable listings nearby, and for a US property, you can run its AI Underwriter, which keeps the closest matches, about five and never more than eight, and tells you why it kept or left out each one. Add your price, down payment, rate and term, and it runs the deal through to cash flow and cash-on-cash return. If you'd like to check its picks by hand, here's how to run Airbnb comps step by step.
Which Indianapolis Neighborhoods Have the Best Airbnb Gross Yield?
To see the screen on real numbers, I opened BNBCalc's Indianapolis market page, where anyone can see the five neighborhoods with the highest median gross yield, each with its median potential room revenue. That list covers every size and every earner together, so it's a coarser cut than the three-bedroom filter in Step 1, but it does mean you can check every figure here yourself without a plan.
| Neighborhood | Potential room revenue (median) | Gross yield (median) |
|---|---|---|
| Decatur and Camby | $39.5K | 26.5% |
| Near Southside and Old Southside | $36.9K | 20.1% |
| Shelbyville and Connersville Country | $30.6K | 22.3% |
| Near Westside | $28.9K | 22.7% |
| New Castle and Henry County | $20.9K | 20.8% |
Each row is one neighborhood, sorted from the most revenue to the least, and you'll notice the yield column doesn't follow it. Decatur and Camby leads on both, while Near Southside and Old Southside has the second-most revenue and still ranks last of the five on yield.
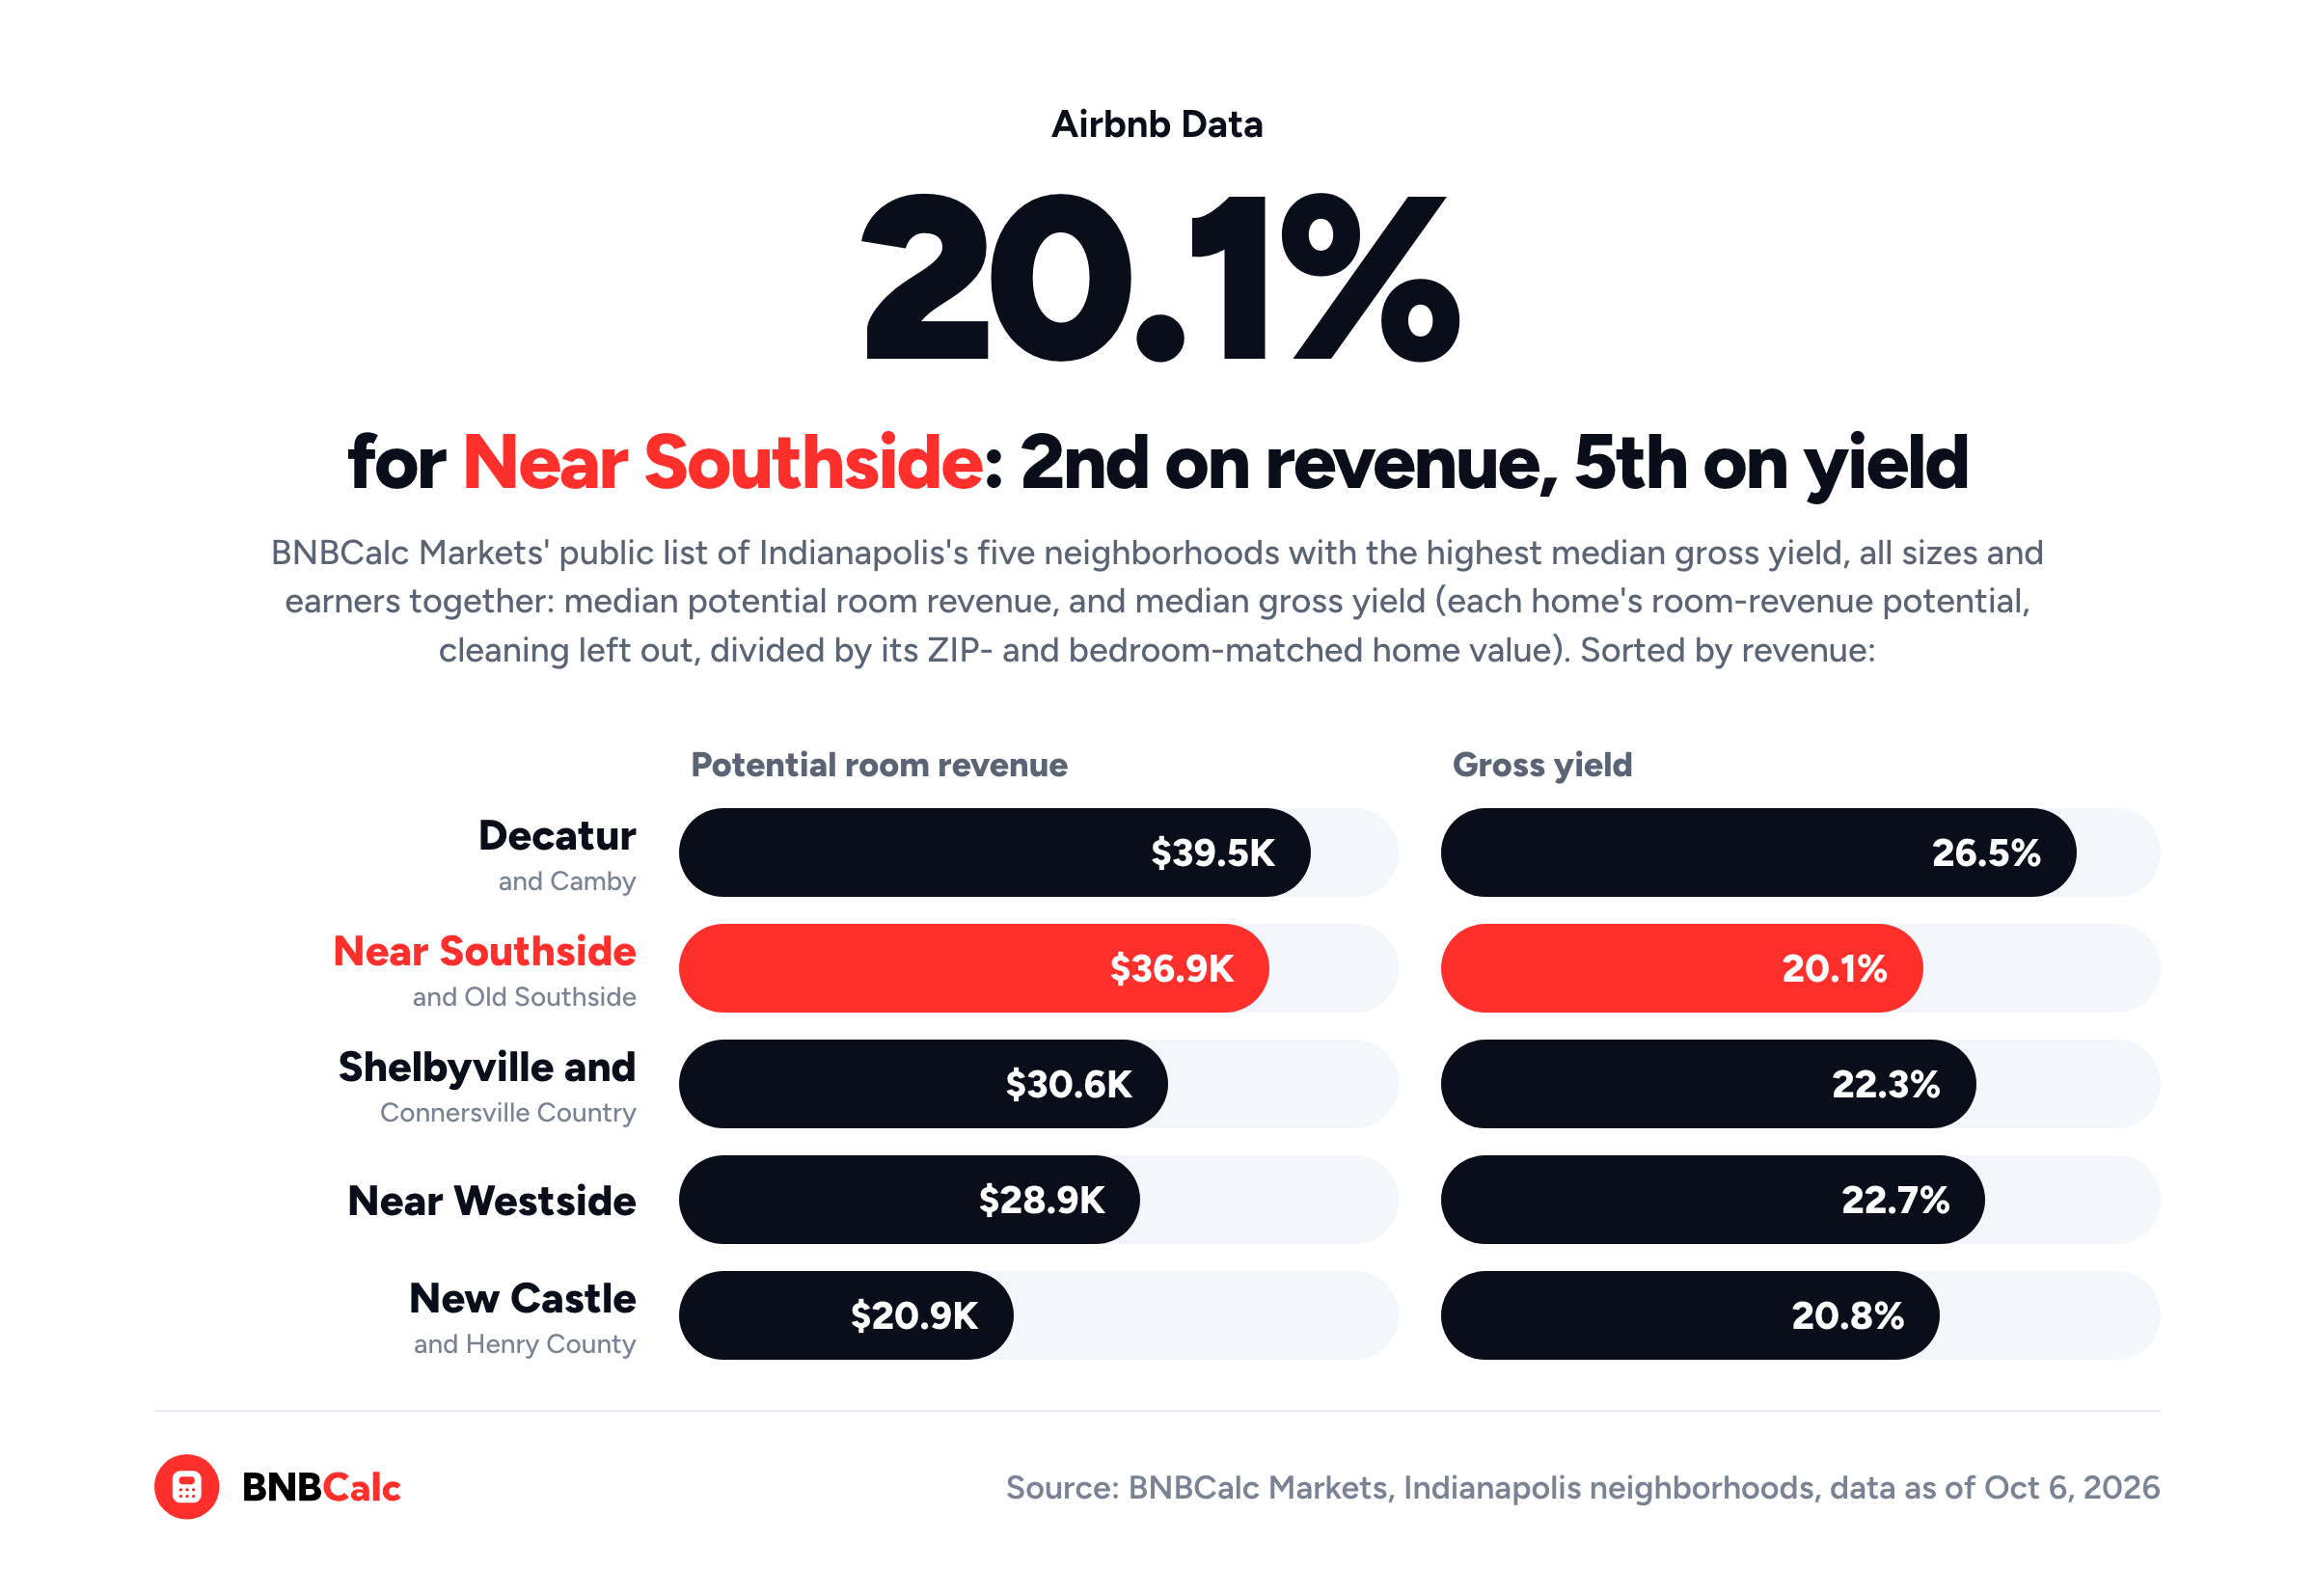
The gap comes down to home prices again. On BNBCalc's list, New Castle and Henry County's potential room revenue is a little over half Near Southside's, $20.9K a year against $36.9K, yet its homes post the higher median yield, 20.8% against 20.1%, which points to much cheaper homes there. On a Markets plan, the Stats tab's Top ZIP codes table runs the same comparison by ZIP code for the bedroom count you pick, with each ZIP code's median revenue and median home value beside its yield, so you can see the prices behind a gap like this one.
So why does that matter if you're borrowing? Say you buy a home that earns right at its neighborhood's median gross yield, with 25% down and a 30-year loan at the Calculator's default 6.00% rate, below the 7.40% average in Freddie Mac's mortgage survey as of October 15, 2026. A year's payments on that loan come to about 5.4% of the price, whatever the price is, so at BNBCalc's median yields they'd take about 20% of the home's room revenue in Decatur and Camby, against about 27% in Near Southside and Old Southside.
That's a real gap. Paying about 20% instead of 27% leaves more of the home's revenue for everything else, starting with Airbnb's service fee, which most hosts on its single fee pay at 15.5% as of October 2026, then cleaning, running costs and property tax. Still, a higher yield doesn't make any one house there a good buy.
Before you get attached to any of these neighborhoods, make sure you can rent the house short term where it sits. BNBCalc's Indianapolis regulation guide covers the city's permit, while New Castle, Shelbyville and Connersville are separate cities outside Marion County, so you'll want to check each city's own rules there. Then take a real house for sale in the neighborhood you like and run it through the BNBCalc Calculator, which is where the costs and your actual loan come in.
So, How Do You Use an Airbnb Heatmap to Screen a Market?
You read it twice. First, color the market by revenue to find where listings earn the most, and then by gross yield to see which of those areas earn the most for what the houses cost. In BNBCalc's October 2026 Indianapolis data, that second look took Near Southside and Old Southside from second of the top five neighborhoods on revenue to last on yield, at 20.1%, while New Castle and Henry County, last on revenue, edged past it at 20.8%.
After that, open the detail panels in the area you like and run one real address through the BNBCalc Calculator with your own costs and loan.
The same holds beyond Indianapolis. A hot spot on a map tells you where the money is, not what it costs to get a share of it, and the price is the one number every deal starts from.
Frequently Asked Questions
What Do the Colors on an Airbnb Heatmap Mean?
In BNBCalc Markets, each dot is one listing, and its shade shows where that listing sits on the measure you picked, with a legend on the map and the darkest dots at the top. In the Revenue view, the darkest dots are the market's biggest earners on potential revenue, and in the Gross yield view, they're the listings earning the most for their estimated home value. To keep only the strongest on screen, set the Gross yield filter to over 20%, 15%, 10% or 5%.
Is There an Airbnb Heatmap for Gross Yield?
Yes. BNBCalc Markets has a Gross yield view for US markets, which divides each listing's room-revenue potential, cleaning income left out, by the estimated home value for its ZIP code and bedroom count. Its Neighborhoods tab shades whole neighborhoods by median gross yield too, and in BNBCalc's October 2026 data, Decatur and Camby tops Indianapolis's neighborhoods at 26.5%.
Can You Use BNBCalc's Airbnb Heatmap for Free?
BNBCalc Markets opens one market in full to everyone, Broken Bow, Oklahoma, so you can try the heatmap there for free. In other markets, you can use the heatmap and filters on a sample of listings, but revenue and occupancy are masked on most of them, and each listing's detail panel stays locked until you're on the Markets plan or its 7-day free trial. US market pages with neighborhoods also show everyone their top five neighborhoods by gross yield.
How Does BNBCalc Calculate a Listing's Gross Yield?
BNBCalc Markets divides each US listing's annual room-revenue potential, what it could earn if it were bookable all year with cleaning income left out, by the estimated value of a home with the same ZIP code and bedroom count. The listing's detail panel, the map's Gross yield colors and the Gross yield filter all use that one figure, and a neighborhood's or a market's gross yield is the median of its listings' yields.
How Do You Analyze a Property You Found on an Airbnb Heatmap?
Run it through the BNBCalc Calculator by typing the property's address, or pasting its Zillow link, into the search box, since there's no button that sends a listing from Markets to the Calculator. It pulls up to 50 comparable listings nearby, lets you run AI Underwriter to keep the closest matches for a US property, and then takes your price and loan through to cash flow and cash-on-cash return.
BNBCalc Markets Pricing and Free Trial
When you're ready to screen a market of your own, BNBCalc Markets costs $79 a month or $399 a year as of October 2026, and it includes the BNBCalc Calculator you'd use in Step 5. On its own, the Calculator is $30 a month or $199 a year. If you'd like to try them first, you can run two property analyses free, or start a 7-day free trial with full access.
Airbnb Tax Deduction Calculator
Paying too much in taxes? We have the perfect solution. Simulate an Airbnb home purchase below.
Purchase Price
$450K
Structure Value
70%
Apply Trump's Tax Cut (Bonus Depreciation)
Depreciation
$117,695
Interest
$21,600
Tax
$6,750
Year 1 Deduction
$146,045
Want to claim this deduction? Get a free cost segregation benefit analysis from CSA Partners — no obligation.
Get Full Analysis