

Free instant analysis
Reveal Airbnb revenue for any address or city
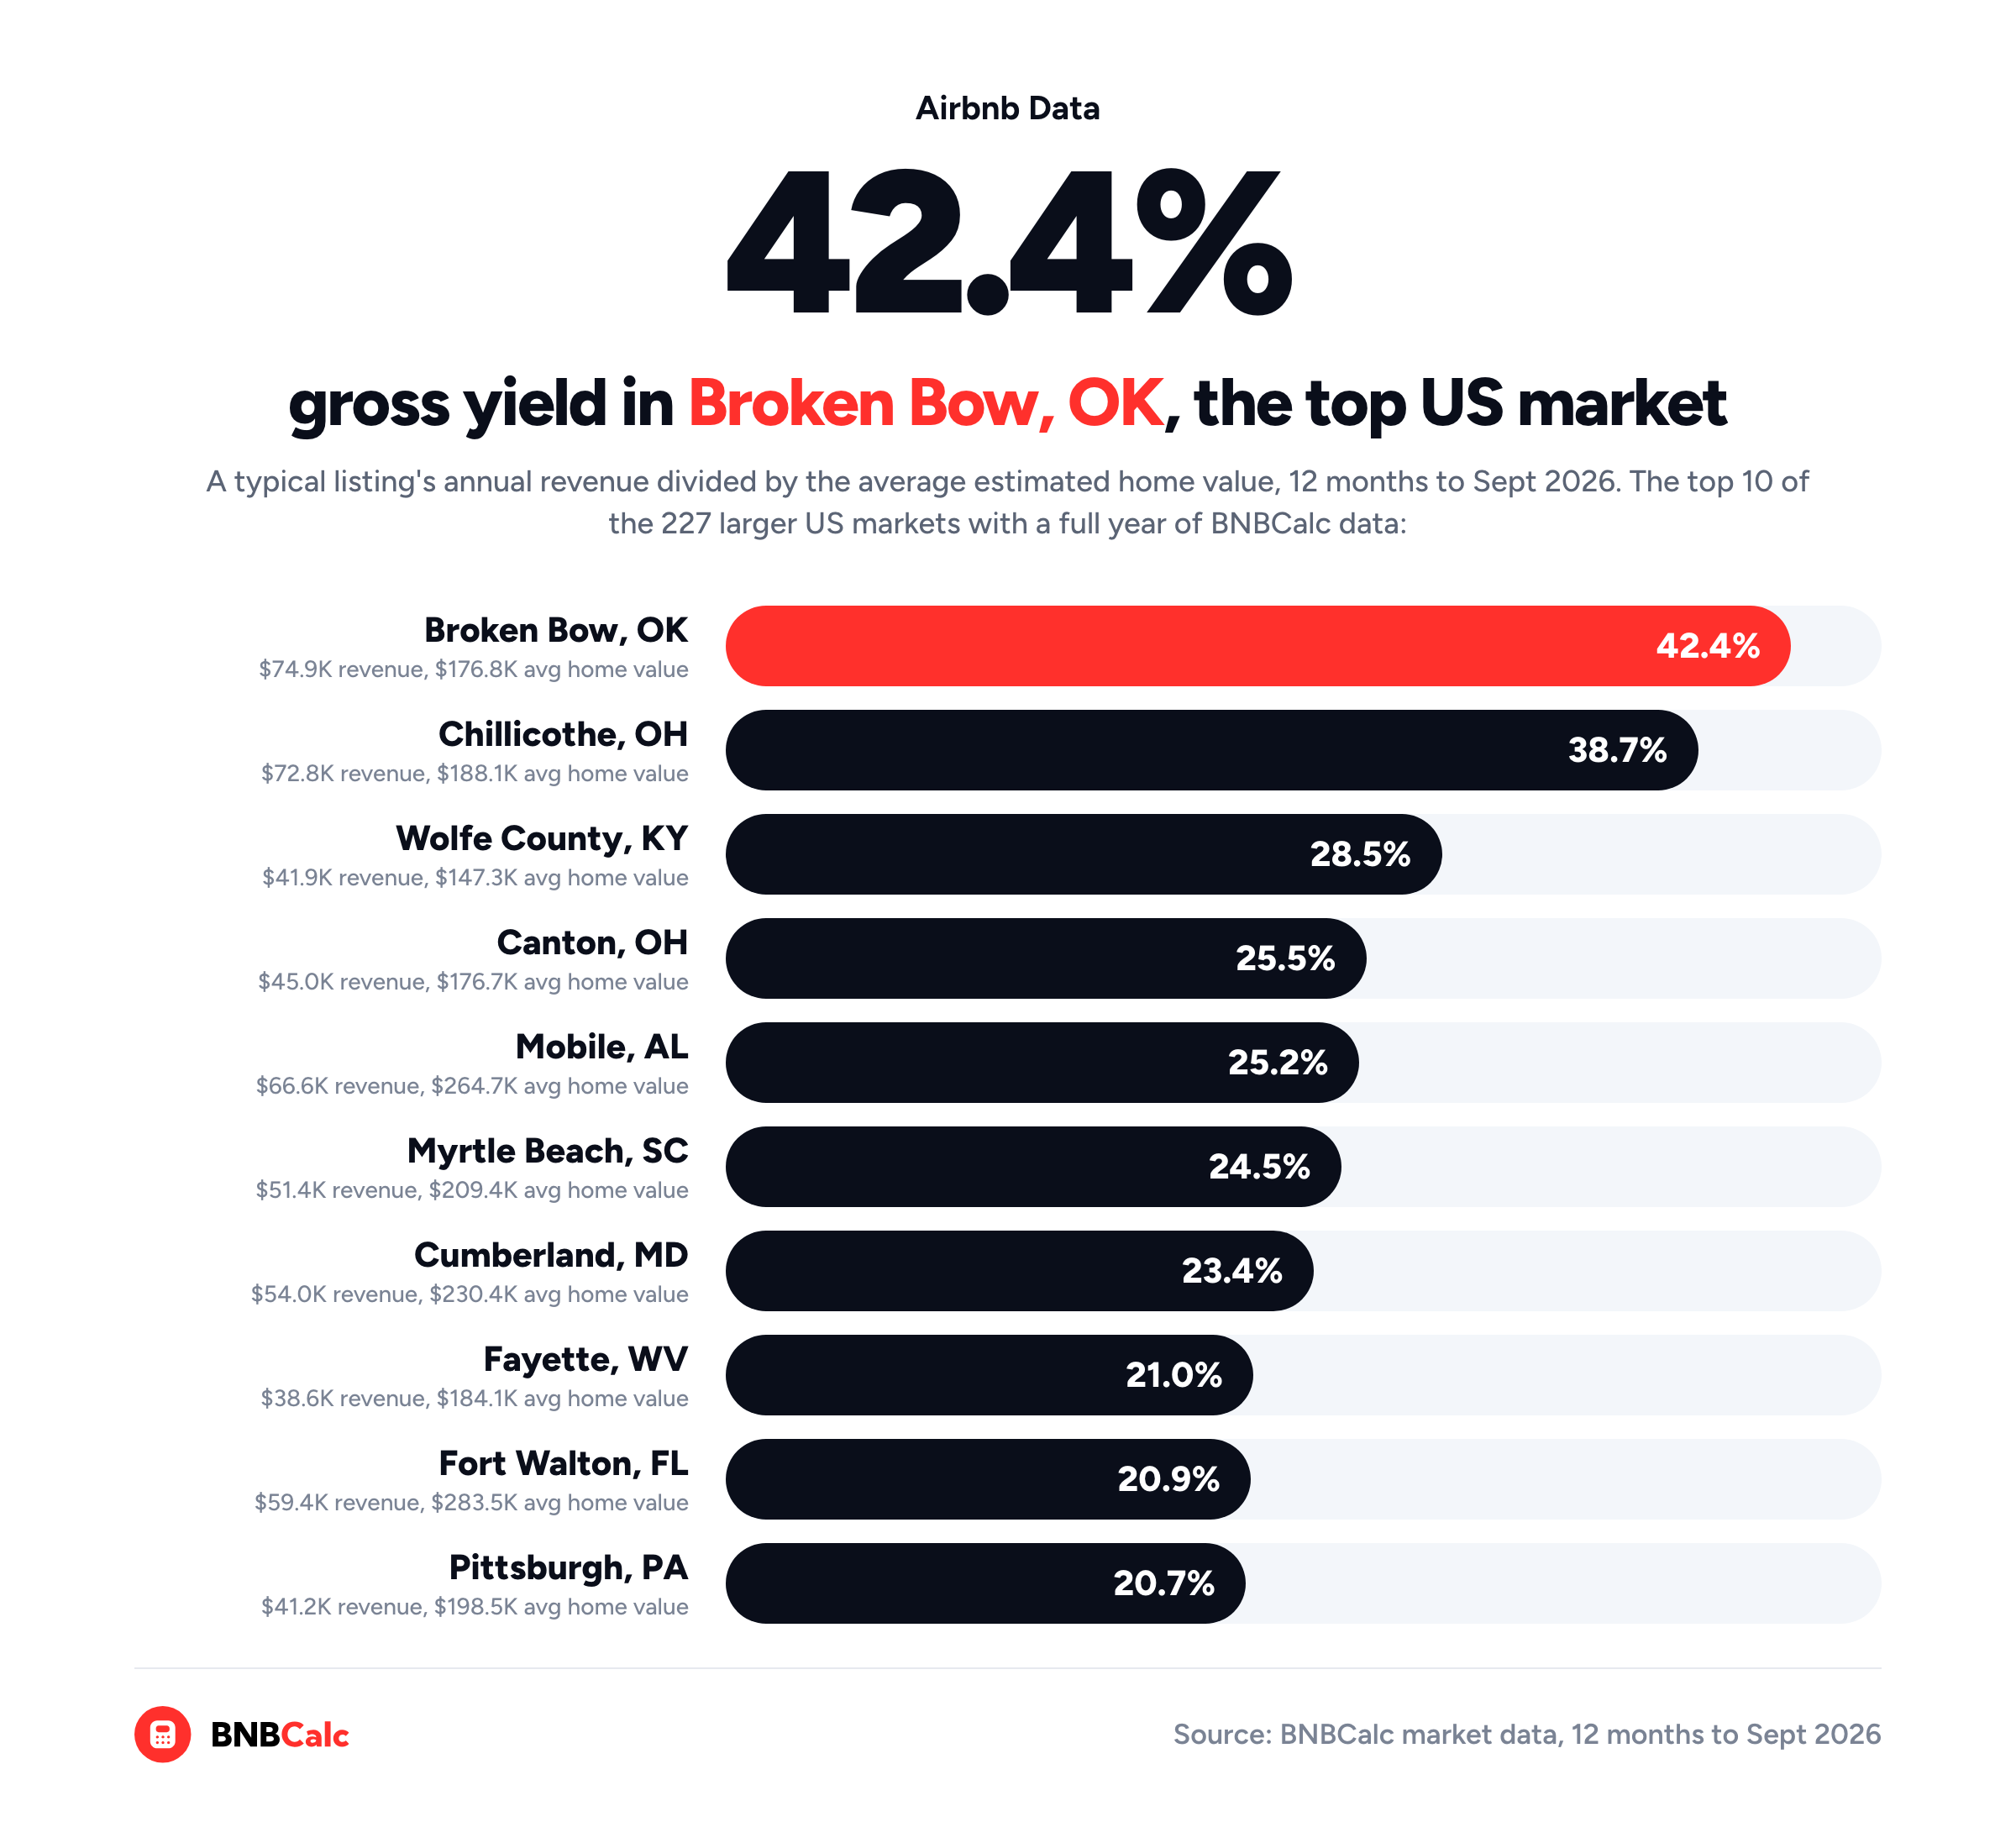
What are the best cities for Airbnb investing in 2026? Well, when I ranked the US markets BNBCalc tracks by gross yield, a typical listing's annual revenue divided by the average estimated home value, Broken Bow, Oklahoma came out on top at 42.4% over the 12 months to September 2026. Chillicothe, Ohio was next at 38.7%, then Wolfe County, Kentucky at 28.5% and Canton, Ohio at 25.5%.
To keep small markets from crowding the top, I only ranked the 454 US markets with a full year of BNBCalc data, and of those, only the larger half by active listings, which left 227. Even so, most of the top 10 are smaller places rather than big cities, because homes there are cheap.
From there, I'll walk you through the top 20, where the big-name markets and the best states land, and what a high yield still can't tell you.
What Are the Best US Cities for Airbnb Investing by Gross Yield?
BNBCalc Markets sorts US markets by gross yield by default, and markets elsewhere by annual revenue, since gross yield is a US-only figure. If you'd rather not sign up, you can check the same numbers state by state on BNBCalc's public market rankings, no account needed. These are the top 20 of the 227 markets I ranked. The revenue is for a typical listing, meaning all bedroom counts at BNBCalc's average performance tier, which is also what the ranking pages show by default.
| Rank | Market | Gross yield | Typical listing's annual revenue | Average estimated home value |
|---|---|---|---|---|
| 1 | Broken Bow, OK | 42.4% | $74,895 | $176,845 |
| 2 | Chillicothe, OH | 38.7% | $72,837 | $188,092 |
| 3 | Wolfe County, KY | 28.5% | $41,932 | $147,301 |
| 4 | Canton, OH | 25.5% | $45,031 | $176,687 |
| 5 | Mobile, AL | 25.2% | $66,591 | $264,678 |
| 6 | Myrtle Beach, SC | 24.5% | $51,353 | $209,448 |
| 7 | Cumberland, MD | 23.4% | $53,989 | $230,392 |
| 8 | Fayette, WV | 21.0% | $38,641 | $184,144 |
| 9 | Fort Walton, FL | 20.9% | $59,358 | $283,542 |
| 10 | Pittsburgh, PA | 20.7% | $41,161 | $198,541 |
| 11 | Finger Lakes, NY | 20.4% | $52,873 | $259,386 |
| 12 | Las Vegas, NV | 20.3% | $75,148 | $369,353 |
| 13 | Lake Norman, NC | 20.2% | $78,167 | $386,663 |
| 14 | Corpus Christi, TX | 19.6% | $56,443 | $287,701 |
| 15 | Pensacola, FL | 19.4% | $47,803 | $246,120 |
| 16 | Bangor, ME | 19.3% | $65,919 | $341,917 |
| 17 | Branson, MO | 19.0% | $44,348 | $232,951 |
| 18 | Williamsport, PA | 19.0% | $44,637 | $234,696 |
| 19 | South Bend, IN | 19.0% | $58,142 | $305,780 |
| 20 | Saugatuck, MI | 18.2% | $67,956 | $373,419 |
Each row is one market, and its gross yield is the revenue column divided by the home-value column. You'll notice it isn't a list of big cities, though. Of the top 10, only Mobile and Pittsburgh are named for a city of more than 100,000 people, going by the Census Bureau's 2025 estimates. Across the whole top 20, the biggest city is Las Vegas, in 12th.
Why do smaller cities, towns and counties like Broken Bow, Wolfe County and Fayette win on this measure? Mostly, it's the cheap homes. Of the top 20, 15 have an average estimated home value under $300,000, and every one sits below the median for the 227, about $396,000. Their revenue isn't much higher, since the typical listing in the median top-20 market earned $55,216, against $49,304 in the median market of all 227. That's also why most big cities, where homes cost more, sit further down the list.
How Is Gross Yield Calculated?
BNBCalc works out a market's gross yield as a typical listing's annual revenue divided by the market's average estimated home value, which the state ranking pages list as its purchase price. BNBCalc's own definition also makes clear that the figure "doesn't include operating or financing costs."
For Broken Bow, that's $74,895 ÷ $176,845, or 42.4%, and you'll find the same row on BNBCalc's Oklahoma rankings. Broken Bow is also the one market anyone can explore fully in BNBCalc Markets, so you can open its market page and look through its listings too.
Keep in mind that the revenue side is gross bookings, cleaning fees included, before any of your own costs come out. It's also counted before Airbnb's service fee, which comes out of the host's payout at 15.5% for most hosts on its single-fee structure, as of October 2026.
So why the average home value and not the median? I've ranked on the average, the way BNBCalc does, because it puts every market on the same footing.
If you divide the same $74,895 by Broken Bow's median estimated home value of $171,228 instead, you get 43.7%, and in most of the 227 markets, the gap is wider than that. Broken Bow's market page also notes that because its home values by bedroom count are incomplete, its yield uses a benchmark for all homes instead. That's why, on a real deal, I'd redo the math on what the house you'd buy costs.
Which Markets Made the List?
I ranked 227 of the 487 US markets BNBCalc tracks. First, I kept the 454 with a full 12 months of data to September 2026, so every yield covers every season. Then I kept the larger half of those by active listings, as the ranking pages count them, because in a smaller market, a few strong listings or a few cheap homes can push the yield up on their own.
Without that second step, 11 of the top 20 would have been smaller markets like Bartlesville, Oklahoma and Altoona, Pennsylvania, although the top three wouldn't change. The state pages still rank all 487, so you'll find those smaller markets there too.
Also, a BNBCalc market is a named area with a boundary, whether that's a city, a region or a resort area, which is why Wolfe County and the Finger Lakes sit beside Pittsburgh and Las Vegas.
Which US Airbnb Markets Make the Most Money?
If you sort BNBCalc Markets by revenue instead of gross yield, a different set of markets comes out on top, and Aspen, Colorado is the clearest case.
A typical Aspen listing earned $160,786 over the 12 months to September 2026, the most of the 227, yet the market ranked 178th on gross yield, because its average estimated home value was $1,785,759.
For a wider view, these are some of the best-known markets, sorted by what a typical listing brought in.
| Market | Typical listing's annual revenue | Gross yield | Rank of 227 |
|---|---|---|---|
| Aspen, CO | $160,786 | 9.0% | 178 |
| San Diego, CA | $88,507 | 10.1% | 160 |
| Destin, FL | $78,252 | 10.9% | 139 |
| Las Vegas, NV | $75,148 | 20.3% | 12 |
| Panama City Beach, FL | $68,509 | 17.4% | 27 |
| Sevierville, TN | $68,351 | 14.2% | 65 |
| Nashville, TN | $62,899 | 13.3% | 85 |
| Chicago, IL | $62,278 | 17.4% | 28 |
| Phoenix, AZ | $55,972 | 11.4% | 128 |
| Austin, TX | $51,522 | 10.9% | 138 |
| Myrtle Beach, SC | $51,353 | 24.5% | 6 |
| Tampa, FL | $49,304 | 14.5% | 60 |
Read each row from left to right: revenue first, then what that revenue is worth against home prices there.
Of the table's four highest earners, three rank 139th or lower on yield, since their homes cost so much more. Las Vegas is the exception. Like Myrtle Beach, it makes the top 20, with an average home value under $370,000.
Even so, a high yield in a big city doesn't mean you can buy a home there just to put on Airbnb. Chicago, for example, ranks 28th at 17.4%, but its rules are strict.
Under the city's eligibility criteria, as of October 2026, the "unit must be primary residence" in a single-family home or a building with two to four units. Those buildings get a "maximum 1 active rental," and no unit can be in a Restricted Residential Zone or on the city's Prohibited Buildings List.
Larger buildings are different: in a building with five or more units, the page says the "unit does not need to be primary residence," but the city still allows a maximum of one-quarter of the building's units or six rental units, whichever is less. So if you're eyeing a Chicago condo as an investment, make sure to read BNBCalc's Chicago regulation guide before you make an offer.
What Are the Best States for Airbnb Investment?
BNBCalc's state ranking pages break the US down one state at a time, and each page shows a median gross yield across that state's markets. Using the same 454 markets, I ranked the 36 states with at least five of them by that median, and then added each state's highest market on my city list.
| Rank | State | Median gross yield of its markets | Highest market on the city list |
|---|---|---|---|
| 1 | West Virginia | 19.3% | Fayette (8th) |
| 2 | Pennsylvania | 18.3% | Pittsburgh (10th) |
| 3 | Ohio | 17.3% | Chillicothe (2nd) |
| 4 | Illinois | 17.0% | Chicago (28th) |
| 5 | Indiana | 16.2% | South Bend (19th) |
| 6 | Michigan | 16.0% | Saugatuck (20th) |
| 7 | Kentucky | 16.0% | Wolfe County (3rd) |
| 8 | Louisiana | 16.0% | New Orleans (22nd) |
| 9 | Oklahoma | 15.7% | Broken Bow (1st) |
| 10 | Alabama | 14.8% | Mobile (5th) |
The median tells you how a state's middle market does, while the last column shows its best one among the 227. Oklahoma shows the difference: it has the top market and still ranks ninth, because Broken Bow sits far above the state's other markets.
By contrast, some of the best-known Airbnb states sit lower on this measure, with Tennessee 21st at 12.1%, Florida 25th at 11.5% and Arizona 31st at 9.6%. Our guide to the best states for Airbnb investing looks at why each of them lands where it does.
Some state medians here differ from the state pages, such as Pennsylvania's 18.3% against 17.0% on its state page and Arizona's 9.6% against 9.1%, because the state pages also count markets with less than a year of data.
Is a High Gross Yield Enough to Buy in a Market?
Not on its own, since gross yield leaves out your running costs, your loan and the rules, and any one of them can sink a market near the top of this list.
A quick first test, then, is a break-even yield, meaning the yield where revenue just covers the running costs and the mortgage. In our guide to finding the best Airbnb markets, that bar comes to about 10.8% on a 30-year fixed loan at the Calculator's default 6.00% rate, with 25% down and running costs at half of revenue. All 20 markets in the table clear it, although only 140 of the 227 I ranked do.
Then check the rules before you get attached to a number. Make sure an owner who doesn't live there can legally rent out a whole home in the area you'd buy in, which is the first screen in that guide, and BNBCalc's regulation guides are the quickest place to start.
Finally, a market's yield describes its typical listing, so the house you buy can land above or below it. That's the job of the BNBCalc Calculator: give it the address, and it pulls up to 50 comparable listings nearby, lets you run AI Underwriter to keep the closest matches for a US property, and then runs your price and loan through to cash flow and cash-on-cash return.
So, What Are the Best Cities for Airbnb Investing in 2026?
By gross yield, they're Broken Bow, Chillicothe, Wolfe County, Canton and Mobile, the top five of the 227 US markets I ranked on BNBCalc's data for the 12 months to September 2026. In all five, a typical listing brought in more than a quarter of the average home's value, mostly because homes there are cheap, and at the state level, West Virginia, Pennsylvania and Ohio lead on their median market.
If you want to build your own shortlist, sort BNBCalc Markets by gross yield for the bedroom count you'd buy, and then run a specific house through the BNBCalc Calculator.
A ranking like this tells you where revenue runs high against what homes cost, and that's a good place to start looking. Whether any one of those homes is worth buying still comes down to the rules, the loan and the house itself.
Frequently Asked Questions
What City Has the Highest Airbnb Gross Yield in the US?
BNBCalc Markets puts Broken Bow, Oklahoma first, with a 42.4% gross yield for a typical listing over the 12 months to September 2026, from $74,895 in annual revenue against a $176,845 average estimated home value. Chillicothe, Ohio is second at 38.7%, and they hold those two spots whether you rank all 487 US markets BNBCalc tracks or only the larger ones with a full year of data. Broken Bow is also the one market anyone can explore fully in BNBCalc Markets.
What Is the Best State for Airbnb Investment?
BNBCalc's market data puts West Virginia first, with a median gross yield of 19.3% across its markets for a typical listing over the 12 months to September 2026. That ranking only counts the 36 states with at least five markets that have a full year of data, and Pennsylvania (18.3%) and Ohio (17.3%) come next. A state's median can hide a wide spread, so check the markets inside it on its BNBCalc state ranking page before you pick one.
Where Can I See Airbnb Market Rankings for Free?
On BNBCalc's public ranking pages, which rank all 487 US markets BNBCalc tracks by gross yield, state by state, with each market's annual revenue, ADR, occupancy and purchase price, which is its average estimated home value. You don't need an account. Inside BNBCalc Markets, everyone can see the first 10 markets in the US ranking, while the full list and the bedroom and performance filters come with a Markets plan or its 7-day free trial.
Is Gross Yield the Same as Profit?
No. BNBCalc's gross yield is a typical listing's annual revenue divided by the average estimated home value, and BNBCalc's own definition notes that it doesn't include operating or financing costs. To see profit, run an address through the BNBCalc Calculator, which takes out Airbnb's host fee and your running costs, then your loan payments, to get you to cash flow and cash-on-cash return.
How Often Does BNBCalc Update Its Market Rankings?
BNBCalc refreshes its market data every month, and its public ranking pages refresh daily. The rankings here come from BNBCalc's October 2026 update, which covers the 12 months to September 2026, so the order can shift a little from one month to the next.
BNBCalc Markets Pricing and Free Trial
When you're ready to rank markets for your own budget and bedroom count, BNBCalc Markets is $79 a month or $399 a year as of October 2026, and it includes the full BNBCalc Calculator. If you'd like to try it first, you can run two property analyses free, or start a 7-day free trial with full access.
Airbnb Tax Deduction Calculator
Paying too much in taxes? We have the perfect solution. Simulate an Airbnb home purchase below.
Purchase Price
$450K
Structure Value
70%
Apply Trump's Tax Cut (Bonus Depreciation)
Depreciation
$117,695
Interest
$21,600
Tax
$6,750
Year 1 Deduction
$146,045
Want to claim this deduction? Get a free cost segregation benefit analysis from CSA Partners — no obligation.
Get Full Analysis