8 tracked markets

Source: BNBCalc market metadata · Reviewed by Parker Place, CTO of BNBCalc.com · Data updated July 10, 2026

Best Airbnb Markets in Montana by Gross Yield

Big Sky is the top Montana short-term rental market across Airbnb and Vrbo by gross yield, with 14.8% gross yield, $104,553 in average annual revenue, and 1,154 active listings.

Top gross yield

14.8%

Big Sky

Median gross yield

9.1%

8 markets with yield data

Median annual revenue

$40.7K

Average listing revenue

Tracked markets

8

Statewide market coverage

Filter market rankings

Default rankings show all bedrooms at the average performance tier.

Bedroom count

Performance tier

Top 10 Montana Airbnb and Vrbo Markets

Big Sky short-term rental market

#1

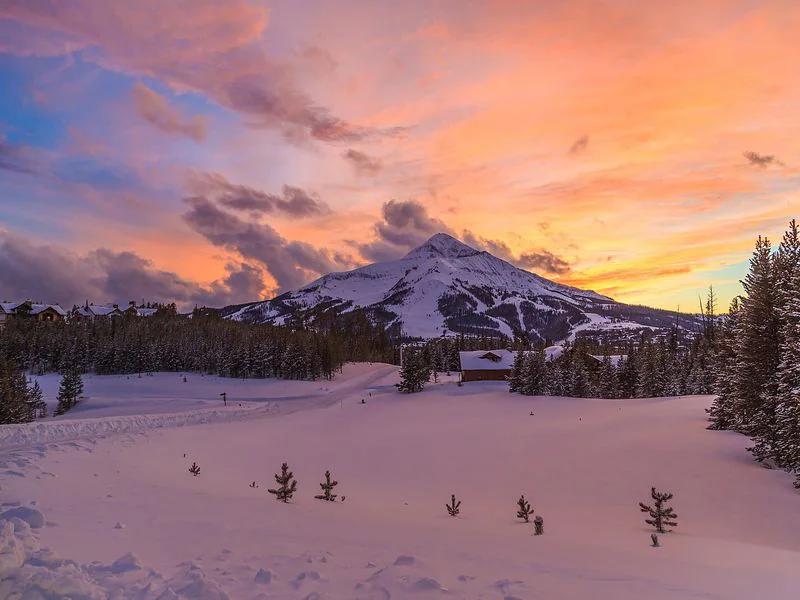
Big Sky

Big Sky stands out as a high-revenue short-term rental market, yielding an impressive annual revenue of $87,756 and a premium average daily rate of $645. Investors should note that the 1,113 active listings face a relatively low occupancy rate of 33%, though the strong 12.5% gross yield remains highly attractive.

Yield

14.8%

Revenue

$104.6K

Listings

1,154

Glacier National Park short-term rental market

#2

Glacier National Park

The Glacier National Park short-term rental market features a 9.2% gross yield and a solid $290 ADR, generating $34,952 in annual revenue. With 364 active listings and a 32% occupancy rate, investors must focus on optimizing guest experiences to capture consistent bookings.

Yield

14.7%

Revenue

$56.1K

Listings

369

Whitefish short-term rental market

#3

Whitefish

Whitefish attracts short-term rental investors with a strong annual revenue of $46,420 and an impressive average daily rate of $407. However, with 1,162 active listings competing for guests, the 32% occupancy rate indicates that securing consistent bookings requires high-quality listings and an optimized pricing strategy to achieve the projected 8.6% gross yield.

Yield

10.1%

Revenue

$55.1K

Listings

1,238

Great Falls short-term rental market

#4

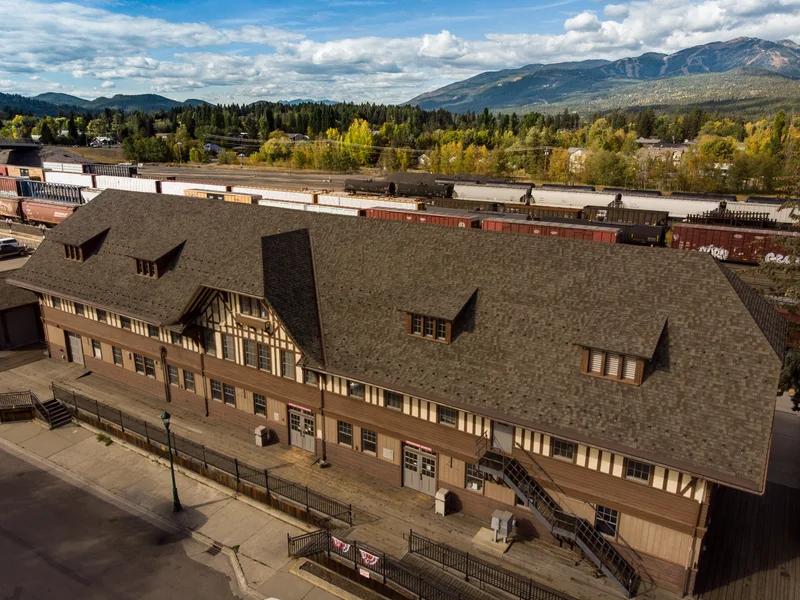
Great Falls

Investors targeting Great Falls will find a less crowded market with only 214 active listings and a gross yield of 7.5%. Although the annual revenue sits at $24,141 with a 34% occupancy rate, the $179 average daily rate offers a steady entry point for new short-term rental hosts.

Yield

9.4%

Revenue

$30.9K

Listings

220

Billings short-term rental market

#5

Billings

For short-term rental investors, Billings offers a stable 8.4% gross yield and an annual revenue of $29,899 across 797 active listings. While the average daily rate of $235 is moderate, the 35% occupancy rate suggests that operators must focus on guest satisfaction and property differentiation to maximize their booking potential.

Yield

8.8%

Revenue

$32.0K

Listings

812

Helena short-term rental market

#6

Helena

Helena provides short-term rental investors with a 6.5% gross yield and an average daily rate of $224. However, with 491 active listings in the market, occupancy is limited to 34%, which keeps average annual revenue at $27,881 and highlights the need for competitive pricing strategies to attract guests.

Yield

7.2%

Revenue

$31.7K

Listings

504

Flathead short-term rental market

#7

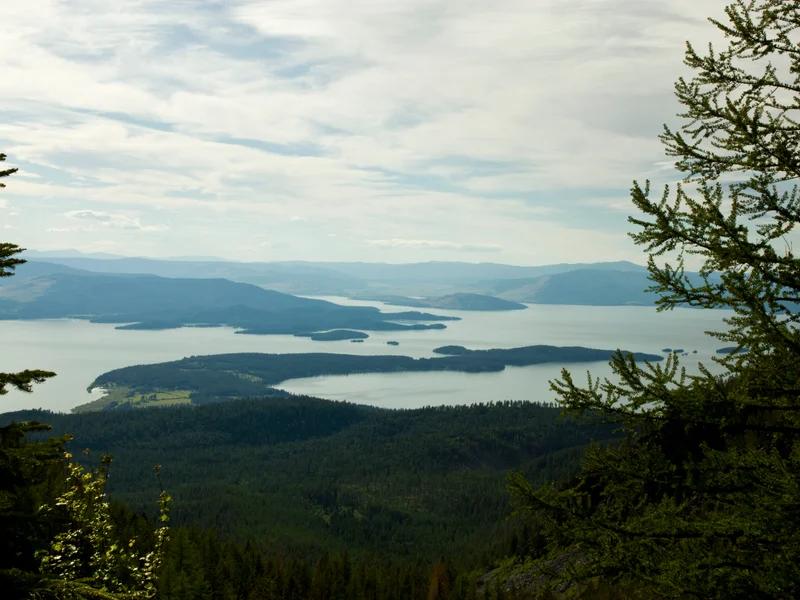
Flathead

The Flathead short-term rental market currently features 760 active listings and commands a respectable average daily rate of $305 for local hosts. However, a low occupancy rate of 29% restricts annual revenue to $31,697, leading to a modest gross yield of 4.8% for prospective real estate investors.

Yield

6.7%

Revenue

$44.8K

Listings

781

Missoula short-term rental market

#8

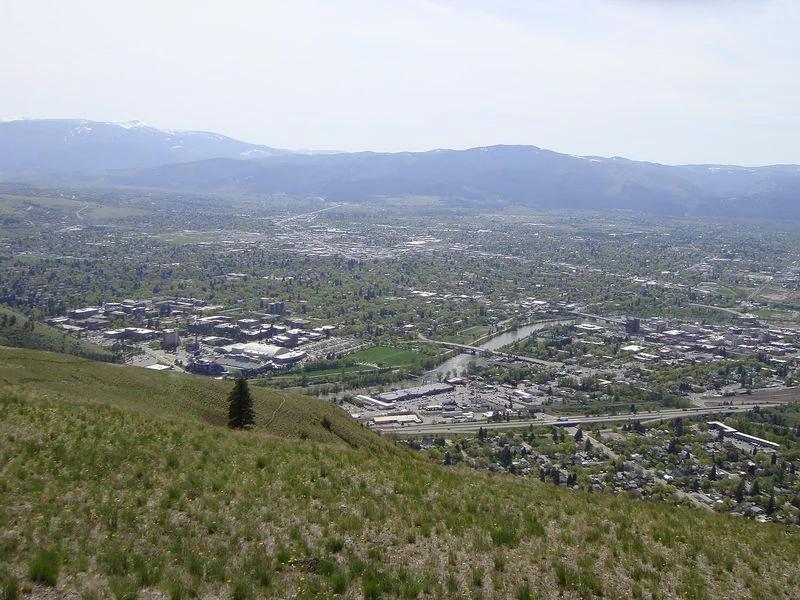
Missoula

Missoula offers short-term rental investors a 5.9% gross yield and an average daily rate of $264 across 784 active listings. However, a lower occupancy rate of 32% means that buyers must carefully manage operational costs to successfully capture the market's $31,480 in annual revenue.

Yield

6.7%

Revenue

$36.6K

Listings

805

All Montana Short-Term Rental Markets

Every market below links to its full BNBCalc market page. Rankings use gross yield first, then annual revenue when yield is missing.

Active listings are Airbnb and Vrbo listings observed as active in the selected market metadata segment. The all-bedrooms view uses all active listings in that market; bedroom filters use the active listing count for the selected bedroom group.

RankMarketGross yieldAnnual revenueMonthly revenueADROccupancyListingsPurchase price
#1Big Sky14.8%$104,553$8,713$68236%1,154$707,919
#2Glacier National Park14.7%$56,109$4,676$32239%369$381,278
#3Whitefish10.1%$55,085$4,590$39236%1,238$545,341
#4Great Falls9.4%$30,858$2,572$17742%220$328,500
#5Billings8.8%$31,974$2,664$22638%812$364,902
#6Helena7.2%$31,710$2,643$22236%504$438,491
#7Flathead6.7%$44,819$3,735$29637%781$664,806
#8Missoula6.7%$36,588$3,049$25437%805$544,216

How We Rank Markets

For US markets, BNBCalc ranks state market pages by gross yield: annual Airbnb and Vrbo short-term rental revenue divided by estimated property value. Gross yield is a fast way to compare market-level opportunity before operating expenses, financing, taxes, insurance, seasonality, and local rules.

  • Annual revenue uses ADR, adjusted occupancy, and estimated cleaning revenue when cleaning and stay data exists.

  • ADR is nightly-only and excludes cleaning fees and other guest fees.

  • Occupancy is adjusted occupancy of bookable nights, excluding host-blocked nights.

  • Gross yield uses annual revenue divided by estimated property value; it does not include operating expenses, financing, taxes, or local regulation risk.

Compare Rental Demand in Montana

For long-term rental context, compare statewide Section 8 Fair Market Rent data alongside short-term rental market performance.

Frequently Asked Questions About Montana Airbnb and Vrbo Markets