BNBCalc research metrics
Short-term rental metrics lexicon
Clear definitions for the revenue, occupancy, fee, and yield metrics used across BNBCalc market pages and listing stats.
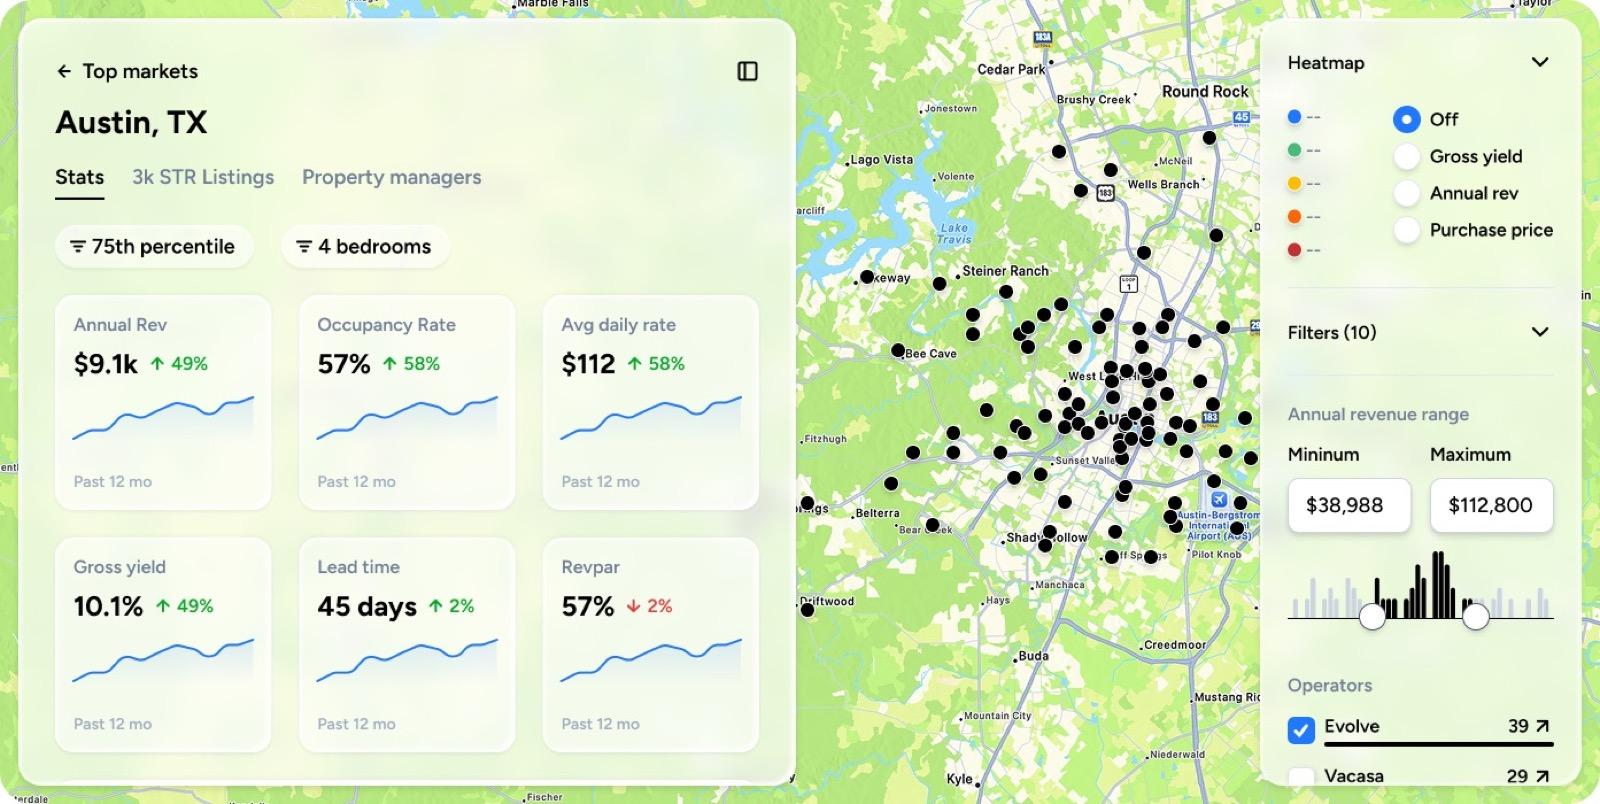
Annual revenue
RevenueEstimated yearly listing revenue, including cleaning fees. In market stats, BNBCalc divides total market revenue over the last 12 months by the average number of active listings over those months.
total market revenue (last 12 months) ÷ average active listings
Cleaning fees are bundled into the booked nightly rate, so revenue and ADR already include them. BNBCalc never adds cleaning on top.
Annual revenue (actual)
RevenueListing-level revenue estimate from the past 12 months of bookings. It already includes cleaning fees.
Annual revenue (potential)
RevenueListing-level revenue estimate if the listing were bookable year-round.
actual revenue × adjusted occupancy ÷ calendar occupancy
Includes cleaning fees. Potential cleaning revenue is an estimated portion of this total, based on estimated stays and the cleaning fee. It is never added to it.
Nightly revenue
RevenueRevenue from booked nightly rates. Cleaning fees are bundled into the nightly rate, so it includes them. It excludes other guest fees.
booked nights × ADR
ADR / ANR
RatesAverage daily rate, also called average nightly rate. It is the average booked nightly price.
booked nightly revenue ÷ booked nights
ADR includes cleaning fees, which are bundled into the booked nightly rate. It excludes other guest fees.
APR
RatesAverage posted rate, or asking rate. It averages booked and available nightly prices.
APR excludes cleaning fees and guest fees.
Adjusted occupancy
OccupancyOccupancy of bookable nights, excluding host-blocked nights.
booked nights ÷ bookable nights
Adjusted booked nights
OccupancyEstimated booked nights after accounting for host-blocked days.
bookable nights × adjusted occupancy
LOS
Stay MetricsLength of stay. This is the average number of nights per reservation.
Estimated stays
Stay MetricsEstimated reservation count over the period, based on revenue, ADR, and LOS.
revenue ÷ ADR ÷ LOS
Cleaning revenue
FeesEstimated portion of revenue that comes from cleaning fees, based on estimated stays and the listing's past cleaning fee, or the market's median fee for the same bedroom count. It is already part of revenue and is never added to it.
estimated stays × cleaning fee
Cleaning ADR effect
FeesCleaning fee converted into a per-night number. Because cleaning is bundled into the booked nightly rate, it estimates how much of ADR comes from cleaning.
cleaning fee ÷ LOS
RevPAR
RevenueRevenue per available night. For market benchmarks, RevPAR includes cleaning fees.
ADR × occupancy
Gross yield
InvestmentFor each eligible home, annual room-revenue potential is divided by a ZIP- and bedroom-matched home-value estimate. Groups show the median of those yields. Cleaning income is excluded. Gross yield is before expenses and financing.
Annual room-revenue potential ÷ matched home value, before expenses.
The chart holds current revenue potential constant and uses the matched home value for each month. It models price changes, not past earnings.
Professional host share
OperationsShare of listings operated by hosts or managers with multiple active listings in the market data.
Listings by availability
SupplyDistribution of listings by annual bookable nights. This helps separate part-time listings from year-round inventory.