
Free instant analysis
Reveal Airbnb revenue for any address or city
How do you size up the Airbnb hosts you'd be competing with before you buy? Well, you find out who runs the listings like yours, how those listings perform by tier and what the top performers have. When I did that for three-bedroom Airbnb listings in BNBCalc's Destin, Florida market, the high performance tier earned a median $81,231 over the 12 months to September 2026, against $52,344 for the average tier.
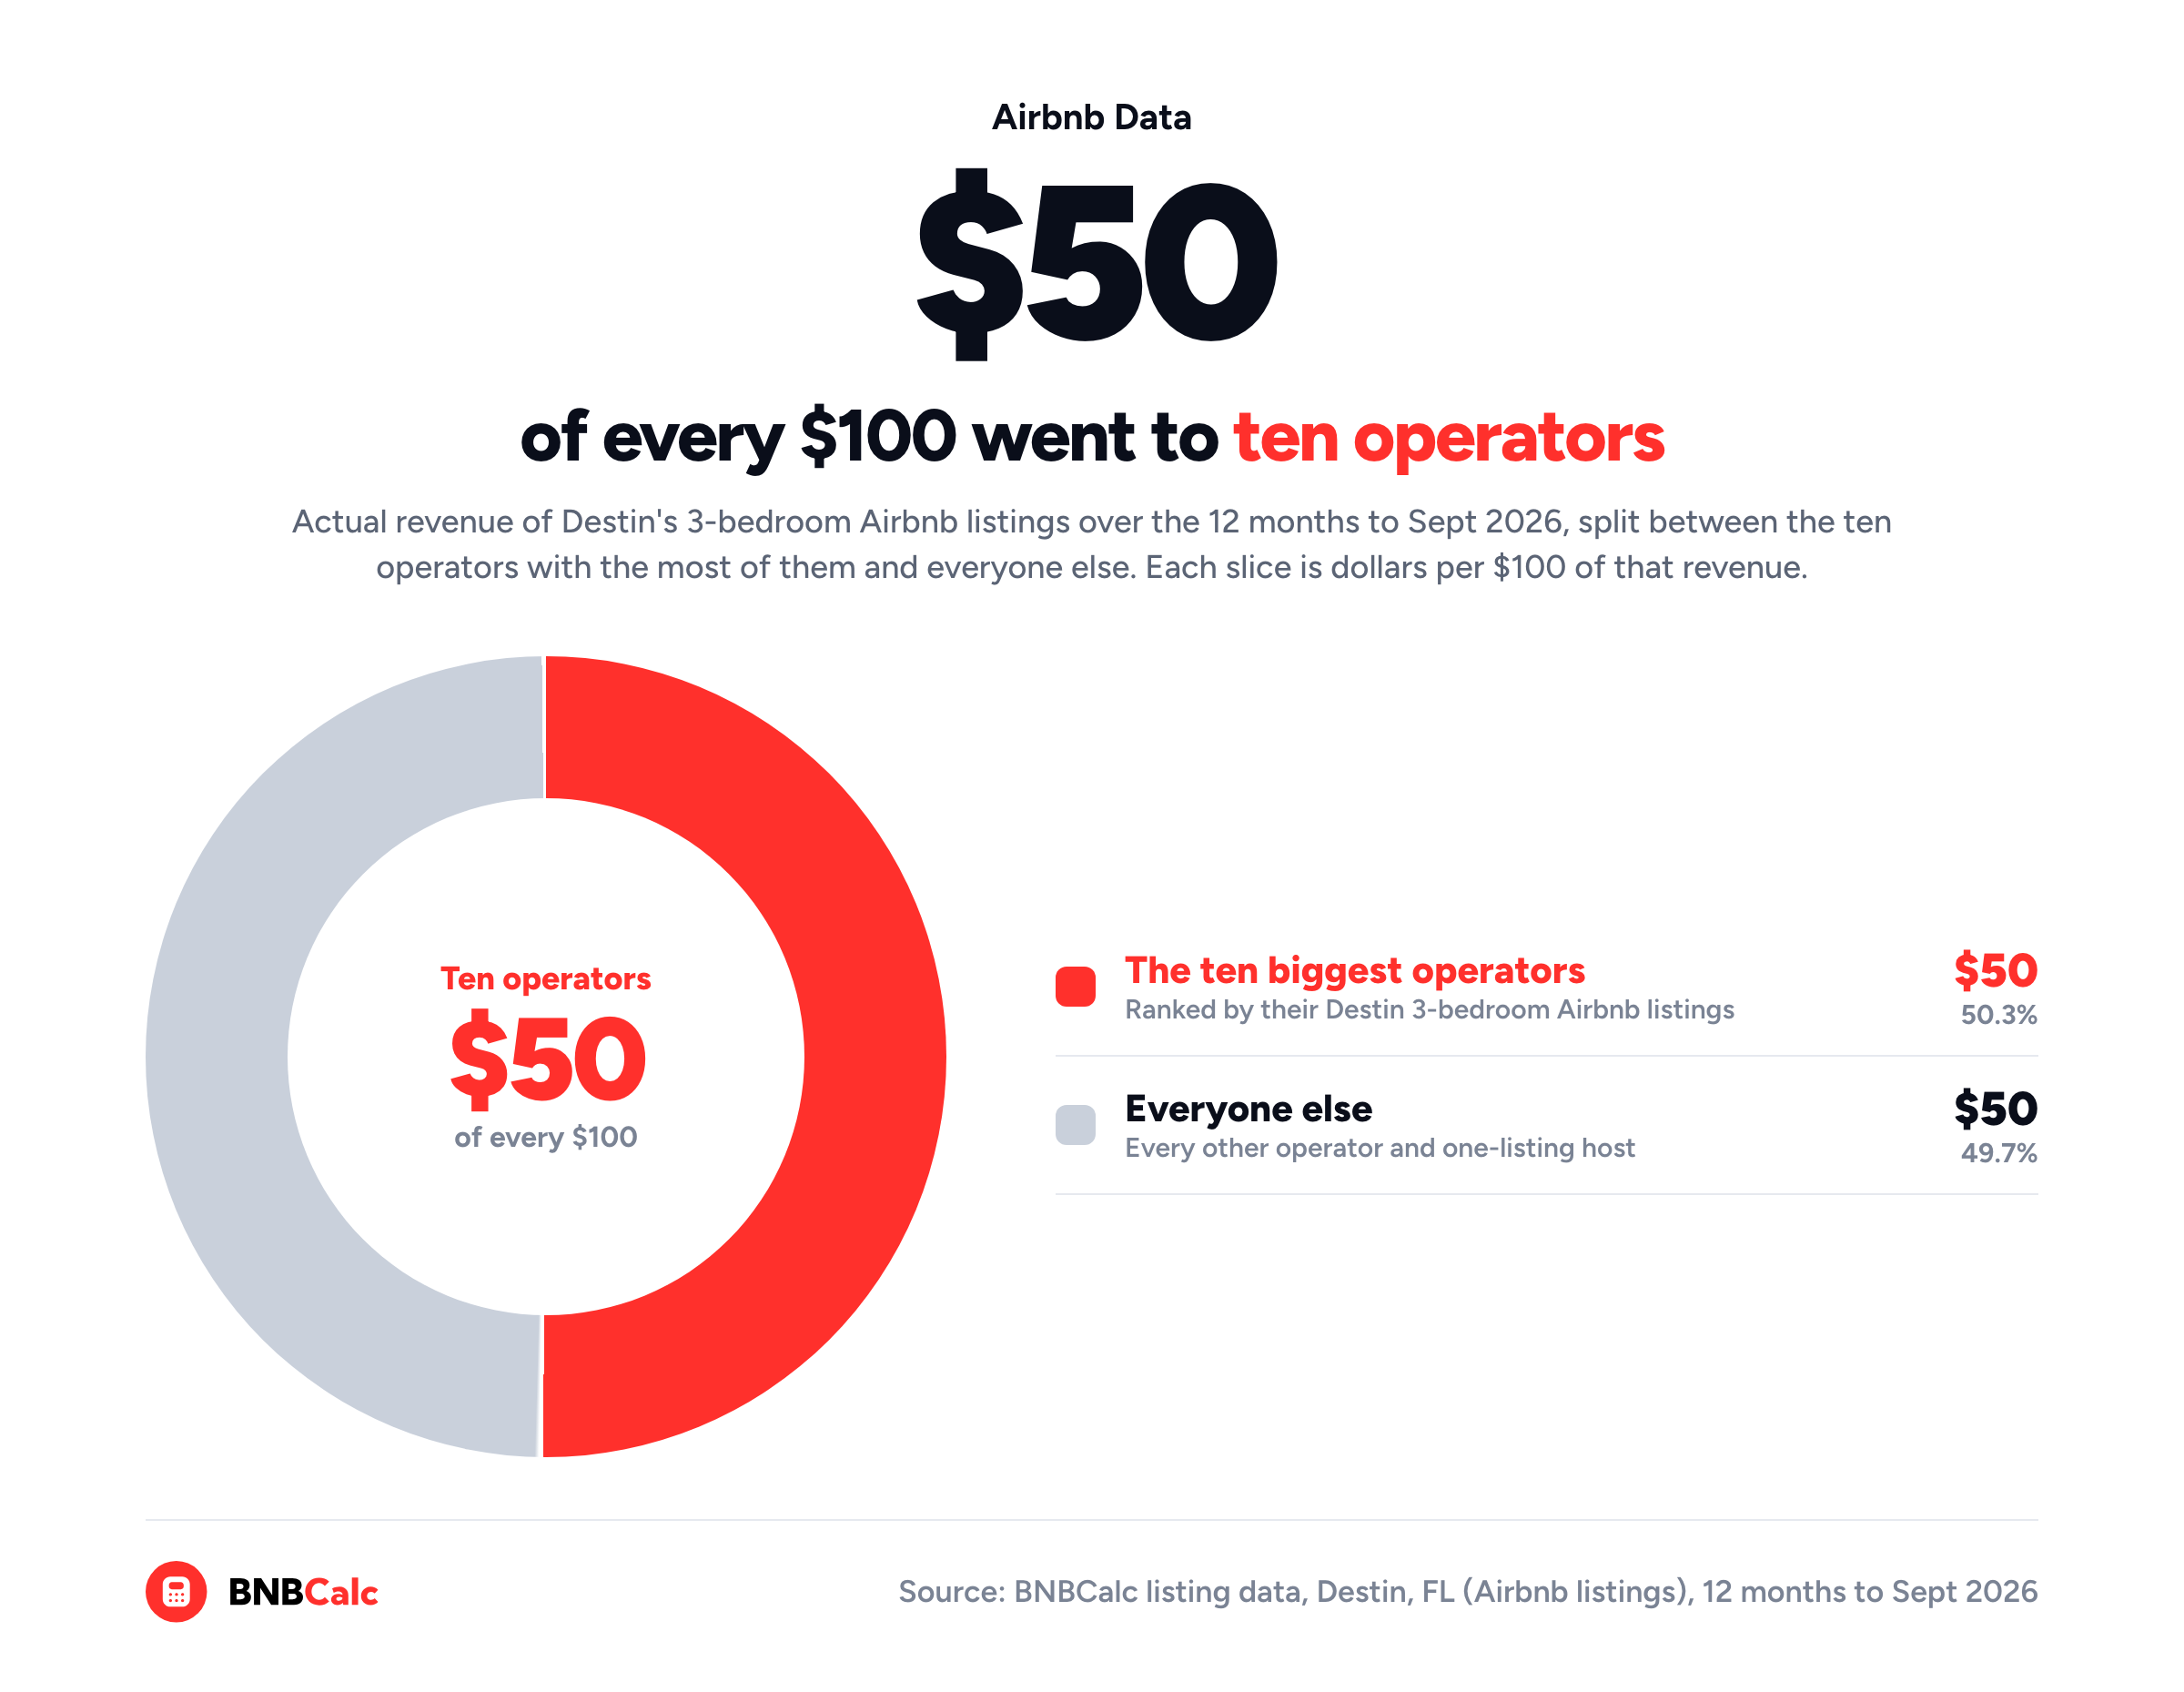
The competition there is concentrated, too, because professional hosts, meaning hosts with two or more listings, run a large share of those three-bedrooms, and the ten operators with the most of them took about $50 of every $100 those listings earned.
So let's walk through how to run that analysis in BNBCalc Markets, step by step, and then what it turned up in Destin.
How to Do an Airbnb Competitor Analysis in BNBCalc Markets
Every market page in BNBCalc Markets has three tabs. Listings puts the market's listings on a map, with a card for each one that opens its detail panel. Marketwide Stats breaks the market's figures down by bedroom count and performance tier, while Operators lists the hosts and management companies running two or more listings there. Together they cover the whole analysis, and a comp set keeps it going afterwards.
Step 1: Find Out Who Runs the Listings You'd Compete With
Start on the Operators tab. It lists every host or management company with two or more listings in the market, sorted by revenue or by number of listings, and each row shows how many listings an operator runs, on which platforms, and what those listings earned in a year.
Click an operator to open their profile. It sets their average revenue, occupancy and nightly rate against the market average, and it shows their bedroom mix, how their listings split across performance tiers and their star ratings. For the bigger picture, the Professional host share card on the Marketwide Stats tab shows what share of the market's listings is run by hosts with two or more.
To map one operator's listings, tick its name in the Operators filter. Before you rank anyone by size, keep in mind that every listing card in Markets is one platform's listing, so a home an operator lists on both Airbnb and Vrbo shows up twice. If you'd rather count homes, filter the Listings tab by Source and look at one platform at a time.
Step 2: Benchmark Revenue, Rates and Occupancy by Performance Tier
Next, find out what a listing like yours earns at each level of the market. Each listing's detail panel in Markets rates its performance as High, Average or Low against same-size listings there, along with its actual revenue, nights booked, nightly rate and occupancy of available nights.
From there, the filter labelled Rev. Performance narrows the map to one tier, while the Performance selector on the Marketwide Stats tab switches the market's own figures between tiers for each bedroom count.
Step 3: See What the Top Performers Have That Others Don't
Once you know the gap between tiers, look for what closes it. Filter to the high tier, tick an amenity in the Amenities filter and see how many listings stay on the map, then do the same for the low tier. If a feature turns up far more often at the top, it's worth a closer look.
The Amenity revenue impact table on Marketwide Stats goes a step further, since it estimates each amenity's revenue lift for the bedroom count you pick by comparing similar listings in that market.
Step 4: Narrow It Down to Your True Competitors
A market's tiers show you where the bar is, but your real competitors are the listings a guest would book instead of yours, with the same bedrooms, similar bathrooms and guest count, the same kind of setting and the same headline amenities. Picking them is the same job as running comps, and our guide to running Airbnb comps walks through it step by step with real Nashville listings, so I won't repeat it.
Step 5: Track Your Competitors Over Time With a Comp Set
Once you've picked your competitors, save them.
Click + Add on a listing card to create a comp set, then add the rest to it. The set's page shows their average annual revenue, occupancy, nightly rate, RevPAR, lead time and stay length, each beside the market average. A set's annual revenue is the average potential revenue of its listings, meaning what they'd earn if they were bookable all year, so it isn't the same figure as the actual revenue in each listing's detail panel.
A comp set only stores which listings belong to it, and their numbers refresh from BNBCalc's latest monthly data whenever you open it, so it's an easy place to check on your competition once a month. For a record you can compare later, export the set to CSV each time, and remember that the CSV's occupancy counts all 365 nights, so it reads lower than the in-app figure, which only counts open nights.
Step 6: Benchmark Your Own Listing Once It's Live
After you buy and launch, the competitor analysis turns into a check on your own listing. BNBCalc's Listing Audit reads your live Airbnb listing, its photos, up to 100 guest reviews and up to 50 nearby listings, then grades it and lists the changes to make first.
The nearby listings it picks are rated 4.7 or higher, with at least 10 reviews and a bedroom count within one of yours. For those, the report shows the typical nightly rate, occupancy and potential revenue, which amenities most of them have and the keywords their titles use. It runs on credits, and paid Calculator and Markets members get one free credit, once per account.
For a quick check on price between audits, Airbnb's compare similar listings tool shows the average booked and unbooked prices of similar listings nearby, for up to 31 days at a time, from the Pricing tab of your listing's calendar.
Who Would a 3-Bedroom Airbnb in Destin Compete With?
Let's run those steps on Destin, Florida, for a three-bedroom you might buy there. Before you benchmark anyone, make sure you can rent the house short term. Florida classifies a vacation rental as one type of public lodging establishment under section 509.242 of the Florida Statutes. That means it needs a state license, since section 509.241 requires one for each public lodging establishment.
BNBCalc's Florida regulation guide covers that license and how local rules can add to it. As for the numbers, every figure in this example comes from BNBCalc's listing data for Destin over the 12 months to September 2026. I've also stuck to Airbnb listings, because most of Destin's biggest management companies list on Vrbo as well, and keeping to one platform means a home they list on both only counts once.
Who Runs Destin's 3-Bedroom Airbnbs?
Professional hosts run a large share of Destin's three-bedroom Airbnb listings, and a handful of them hold a big slice of it: the ten operators with the most three-bedrooms there took about $50 of every $100 those listings earned over the year. If you rank them by revenue instead, you get the same ten.
Bigger doesn't mean better, though.
The operator with the most three-bedrooms has fewer than one in ten of them in BNBCalc's high performance tier, while three of the other nine have most of theirs there. That's why I'd open each big operator's profile and benchmark against the ones putting listings in the high tier.
If you set the operators against hosts with a single Airbnb listing in Destin, the split looks like this.
| Destin 3-bedroom Airbnb listings | Operators (2+ listings) | One-listing hosts |
|---|---|---|
| Median actual revenue | $51,277 | $43,124 |
| Median nightly rate | $542 | $460 |
| Median occupancy of available nights | 50% | 44% |
| Share in the high performance tier | 24% | 12% |
| Share with three or more bathrooms | 64% | 37% |
| Median rating (listings with 10+ reviews) | 4.83 | 4.94 |
| Median review count | 7 | 48 |
Read each row across. The operators earned more, charging $82 more a night and filling more of their open nights, and the homes themselves may explain part of that, since more of their three-bedrooms have a third bathroom. The one-listing hosts, by contrast, win on reviews, with a higher median rating and a median of 48 reviews against 7.
That reviews gap matters if you'll be a one-listing host yourself. Airbnb's help page on search results says listings with better ratings and reviews tend to rank higher, so reviews are where an independent host can hold their own against a management company, while the operators' rates are the ones you'll be priced against.
How Much Do Destin's 3-Bedroom Airbnbs Make by Tier?
Now for what those listings earned at each level of the market.
| Performance tier | Median actual revenue | Median nightly rate | Median occupancy of available nights |
|---|---|---|---|
| Low | $34,659 | $422 | 38% |
| Average | $52,344 | $535 | 50% |
| High | $81,231 | $695 | 72% |
| All three-bedrooms | $50,041 | $531 | 49% |
Each figure is the median for that tier's listings, so the columns won't multiply into the revenue column. The high tier earned about 55% more than the average tier, charging $160 more a night and filling 72% of its open nights against 50%.
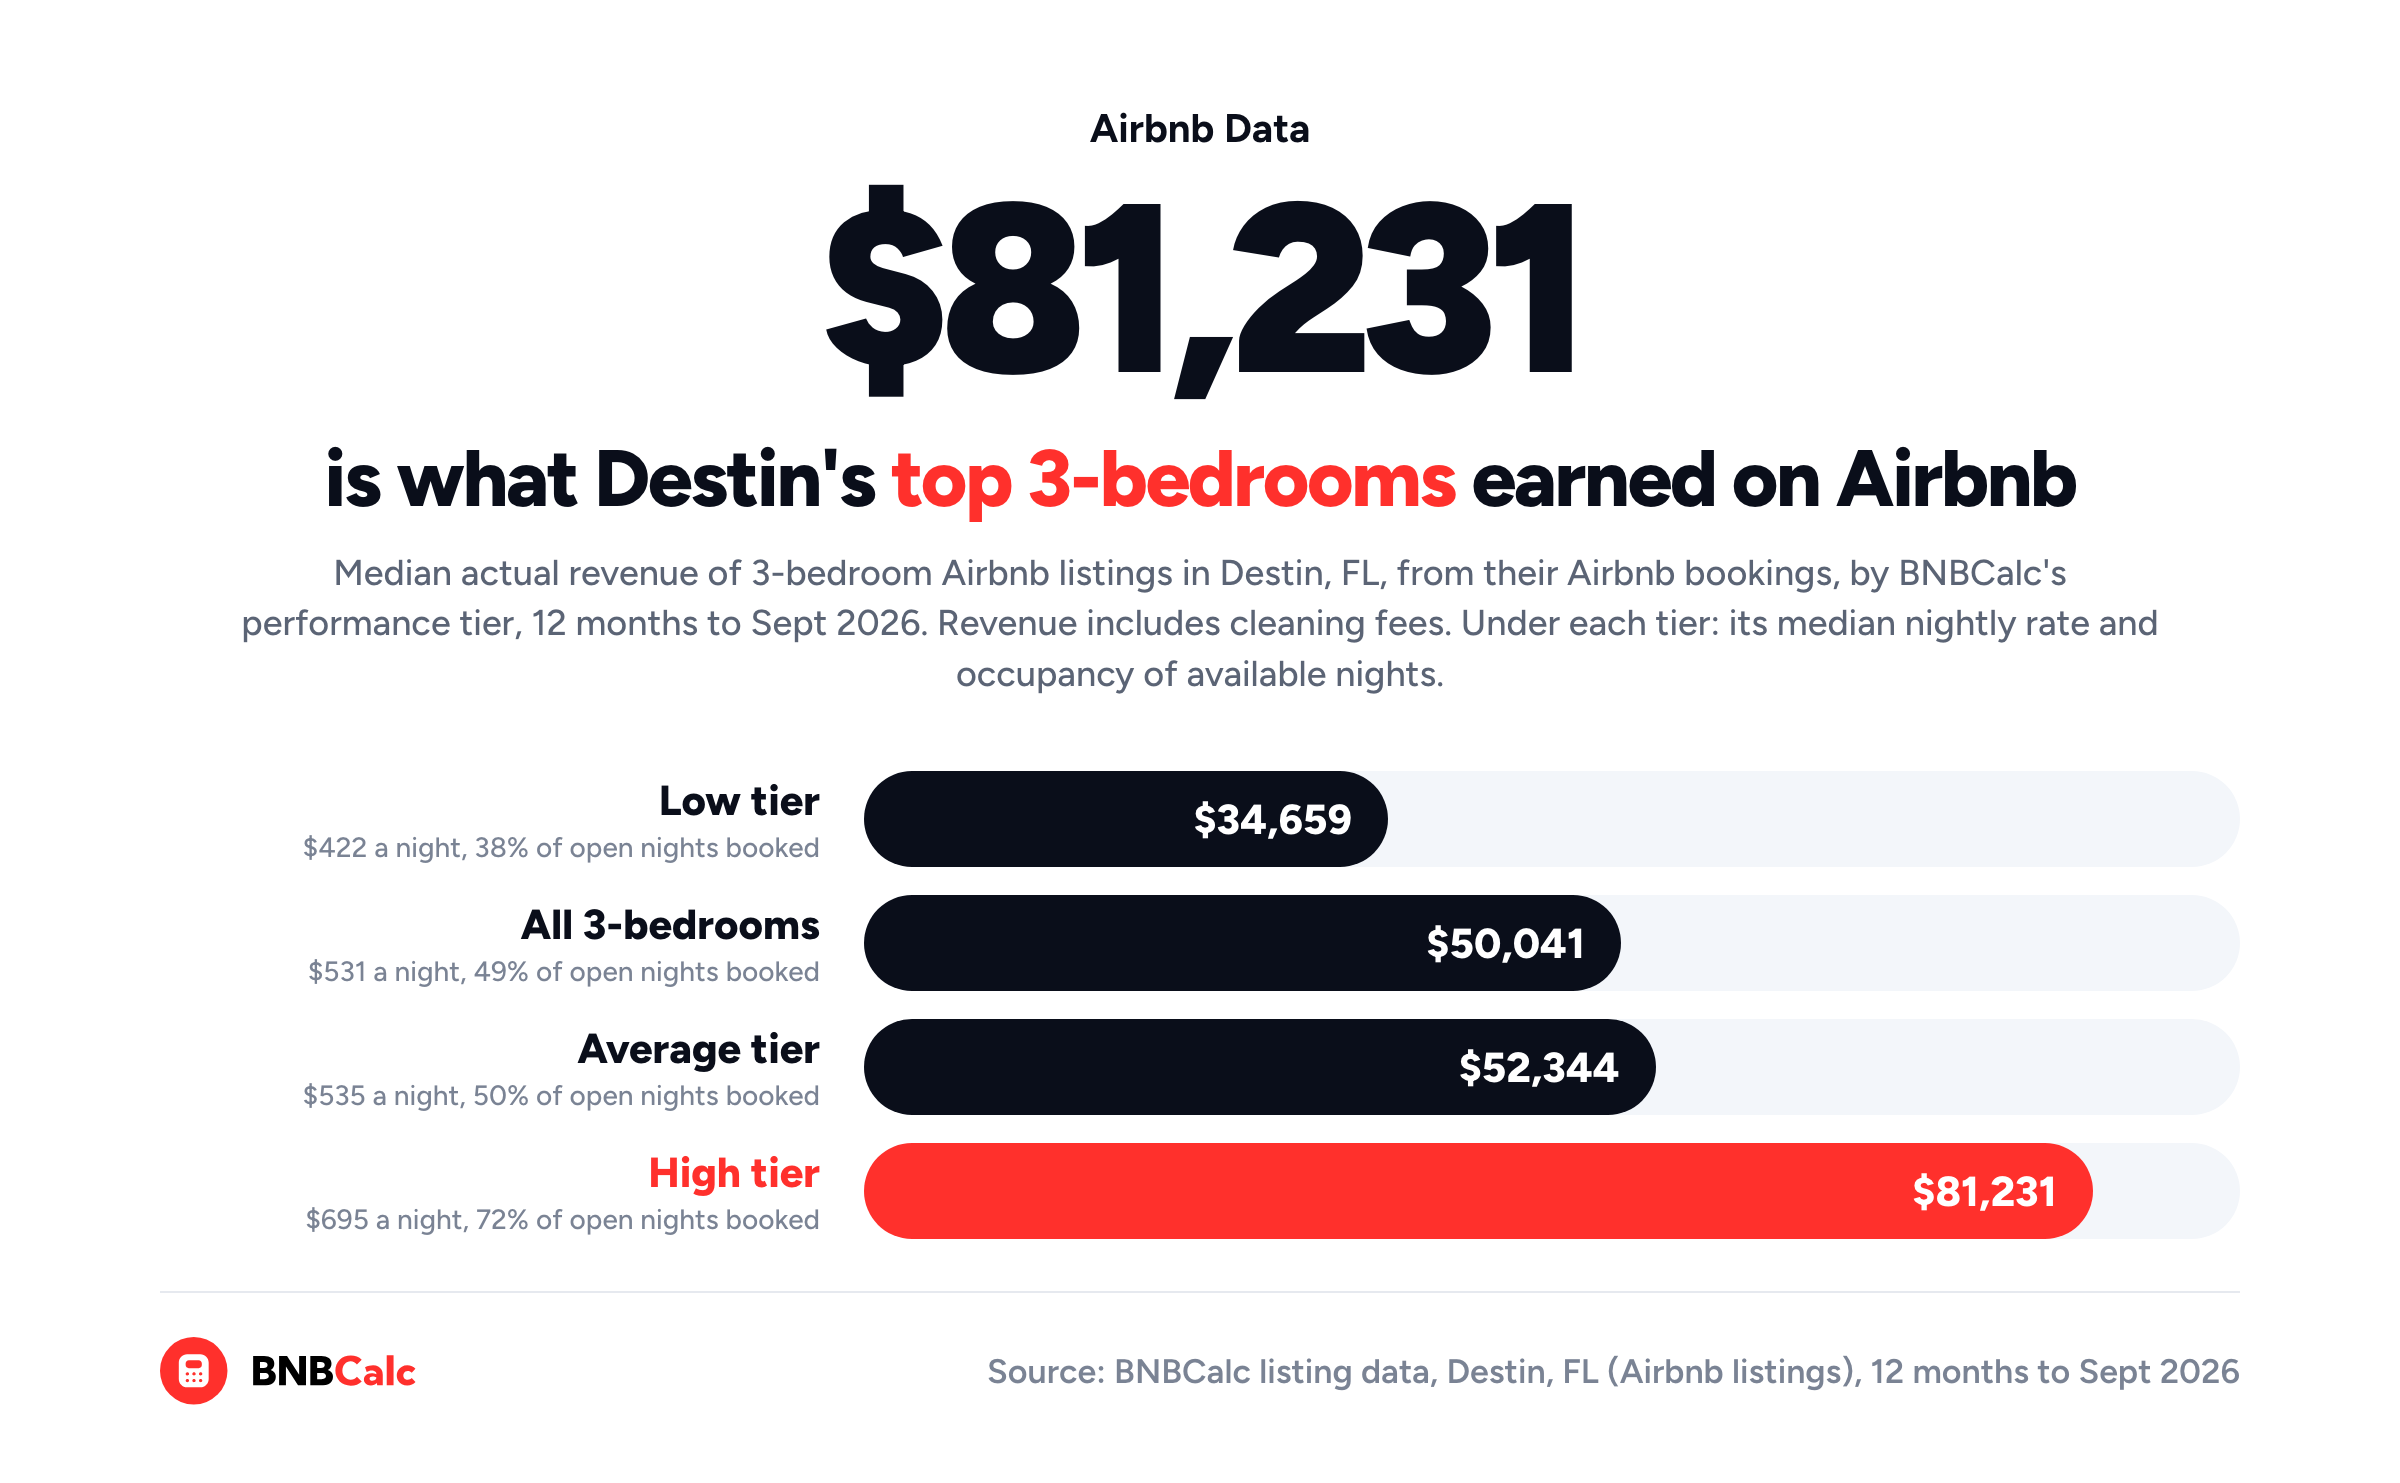
So what should you take from the tiers? Mostly that 55% gap between them, rather than a revenue target. Keep in mind these are medians of what individual Airbnb listings earned on Airbnb alone, and plenty of Destin's homes book on Vrbo too, where those nights don't count toward the Airbnb listing's revenue. That's one reason they sit well below the tier figures on the Marketwide Stats tab, which cover every platform and are built differently. For the revenue you'd plan a purchase on, run the address through the BNBCalc Calculator.
What Do Destin's Top-Performing 3-Bedrooms Have in Common?
What puts a Destin three-bedroom in the high tier, then? A pool won't do it on its own, since 92% of the high tier and 92% of the low tier have one. Hot tubs, on the other hand, show up far more often at the top: 68% of high-tier three-bedrooms have one, against 31% of the low tier.
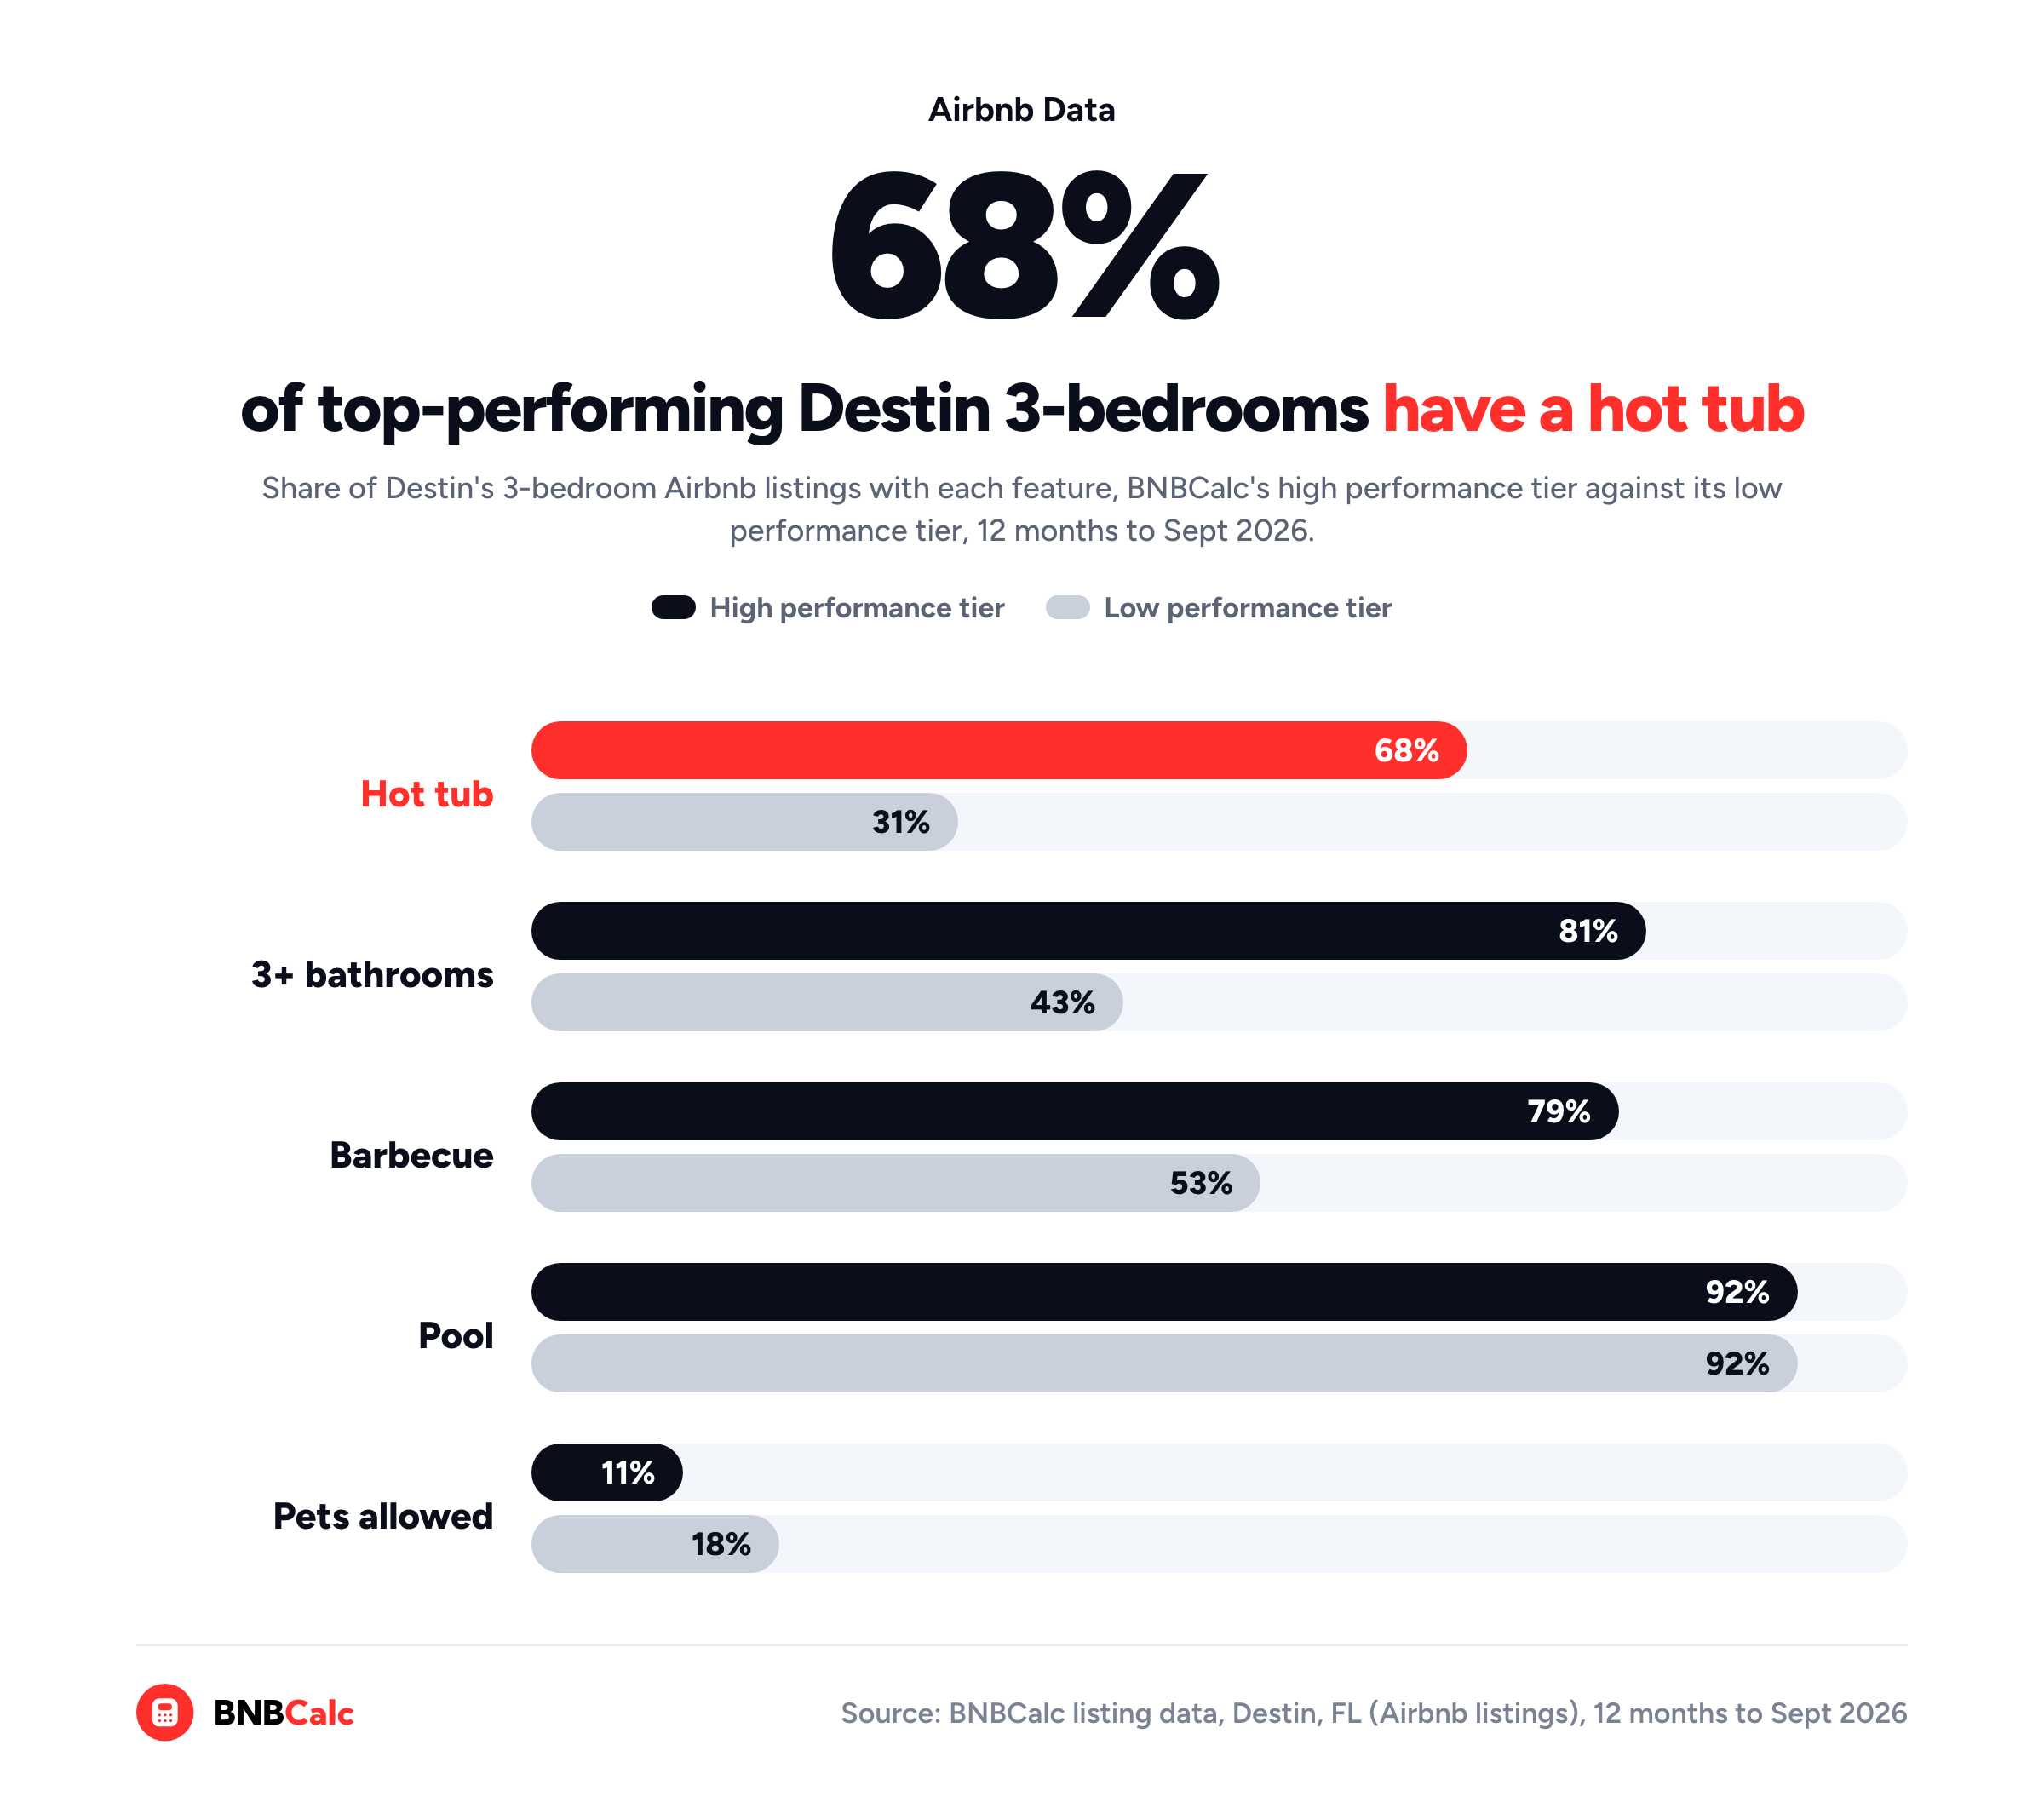
The same pattern shows up with a third bathroom, which 81% of the high tier has against 43% of the low tier, and with a barbecue, at 79% against 53%. Listings that allow pets go the other way, at 11% of the high tier and 18% of the low tier.
Ratings, meanwhile, barely separate the tiers. Among listings with at least 10 reviews, the high tier's median rating was 4.89 and the low tier's 4.87, so in Destin good reviews look like table stakes rather than the thing that lifts a listing to the top.
Those amenity shares are associations, of course, and they don't tell you what a hot tub adds on its own, because a home with one may have other things going for it, like a third bathroom or a better spot. That's why, before you budget for one, I'd check the Amenity revenue impact table in BNBCalc Markets.
For Destin three-bedrooms, that table estimates that, compared with similar listings, those with a hot tub earn about 7% more and those with a barbecue about 8% more, and it doesn't list a pool at all. That's the table's three-bedroom view, which you pick from its bedroom menu with a Markets plan. In short, a hot tub helps, yet it's only one of the things that set the high tier apart.
So, How Do You Run an Airbnb Competitor Analysis?
You find out who runs the listings like yours, benchmark them by performance tier, see what the top performers have that the rest don't, and then track the ones you'd compete with in a comp set. In Destin, that showed ten operators taking about half of what three-bedroom Airbnb listings earned, a high tier at a median $81,231 against $52,344 for the average tier, and hot tubs and third bathrooms far more common at the top.
To do the same for your own market, open it in BNBCalc Markets, then type the house's address into the search bar to run it through the BNBCalc Calculator.
In the end, the biggest operator in a market tells you who holds the most listings, not who runs them best, so the listings worth benchmarking against are the ones guests pick first, whoever happens to run them.
Frequently Asked Questions
What Are the Best Airbnb Tools for Competitor Analysis?
BNBCalc Markets covers the whole job in one place. Its Operators tab shows who runs a market's listings and what they earned, each listing's detail panel shows its actual revenue, nightly rate and occupancy, and its filters narrow the listings by performance tier and amenity. A comp set then keeps your competitors' averages next to the market's, and once you launch, BNBCalc's Listing Audit benchmarks your live listing against up to 50 nearby ones.
How Can I See How Much Other Airbnbs Make?
Open the market in BNBCalc Markets and click any listing. Its detail panel shows the listing's actual revenue over the past 12 months, along with its nights booked, nightly rate and how many days the host blocked. In BNBCalc's Destin data, for example, three-bedroom Airbnb listings had a median actual revenue of $50,041 over the 12 months to September 2026, and the high performance tier's median was $81,231.
How Do I Find the Professional Hosts in an Airbnb Market?
Use the Operators tab in BNBCalc Markets. It lists every host or management company with two or more listings in the market, and each operator's profile sets their occupancy and nightly rate against the market average. In BNBCalc's Destin data, professional hosts run a large share of three-bedroom Airbnb listings, yet only three of the ten biggest by number of listings have most of theirs in the high performance tier.
Can I Track Competitor Airbnb Listings Over Time?
Yes. Save them to a comp set in BNBCalc Markets, and the set's page will show their average revenue, occupancy, nightly rate, lead time and stay length against the market average. Its numbers refresh from BNBCalc's latest monthly data whenever you open it, and you can export the set to CSV each month to keep a record.
Can I Try Airbnb Competitor Analysis for Free?
Yes. BNBCalc Markets keeps one market, Broken Bow, Oklahoma, fully open to everyone, so you can try the operator, tier and amenity steps there before you pay. For any other market, or to save a comp set, you can start a 7-day free trial with full access. Without Markets, other markets still show operator names and listing counts, but their revenue figures are masked.
BNBCalc Markets Pricing and Free Trial
When you're ready to benchmark a market of your own, BNBCalc Markets costs $79 a month or $399 a year as of October 2026. It includes the full BNBCalc Calculator, so you can size up the competition and then analyze a specific house on the same account.
If you'd like to try it first, you can run two property analyses free, or start a 7-day free trial with full access.
Airbnb Tax Deduction Calculator
Paying too much in taxes? We have the perfect solution. Simulate an Airbnb home purchase below.
Purchase Price
$450K
Structure Value
70%
Apply Trump's Tax Cut (Bonus Depreciation)
Depreciation
$117,695
Interest
$21,600
Tax
$6,750
Year 1 Deduction
$146,045
Want to claim this deduction? Get a free cost segregation benefit analysis from CSA Partners — no obligation.
Get Full Analysis