#1
7 tracked markets
Source: BNBCalc market metadata · Reviewed by Parker Place, CTO of BNBCalc.com · Data updated October 21, 2026
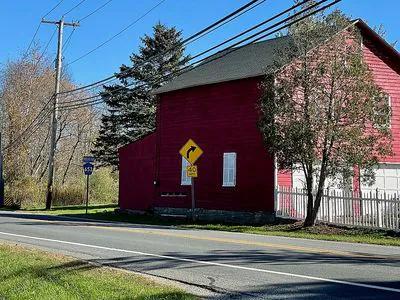
Millville is the top New Jersey short-term rental market across Airbnb and Vrbo by gross yield. Average-tier listings in Millville have median annual room-revenue potential of $44,399 and gross yield of 14.8%, with 42% occupancy at an average daily rate of $253. Millville has 165 average active listings.
Top gross yield
14.8%
Millville
Median gross yield
9.1%
7 markets with yield data
Median annual room potential
$42.9K
Median across market-level medians
Tracked markets
7
Statewide market coverage
Filter market rankings
Default rankings show all bedrooms at the average performance tier.
Bedroom count
Performance tier
#1

#2

#3

#4

#5
#6

#7
Every market below links to its full BNBCalc market page. Rankings use gross yield first, then annual revenue when yield is missing.
Average active listings is the average number of Airbnb and Vrbo listings active in a market each month over the last 12 months. It counts every performance tier, so it doesn't change when you pick a tier, and it's the same figure you'll see on that market's page. It isn't broken out by bedroom count, so the column shows a dash when you filter by bedrooms.
| Rank | Market | Gross yield | Median annual room potential | Monthly room potential | ADR | Occupancy | Average active listings | Median home value |
|---|---|---|---|---|---|---|---|---|
| #1 | Millville | 14.8% | $44,399 | $3,700 | $253 | 42% | 165 | $287,953 |
| #2 | Wawayanda State Park | 12.2% | $36,453 | $3,038 | $326 | 35% | 430 | $326,842 |
| #3 | Trenton | 9.6% | $39,096 | $3,258 | $268 | 39% | 435 | $417,680 |
| #4 | Atlantic City | 9.1% | $35,481 | $2,957 | $318 | 33% | 3,110 | $339,475 |
| #5 | Newark | 8.8% | $42,909 | $3,576 | $239 | 48% | 7,032 | $483,377 |
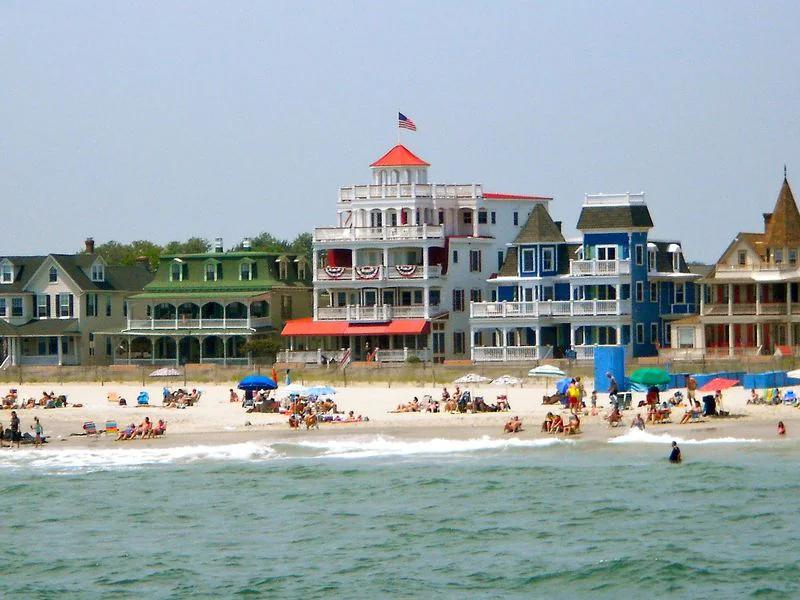
| #6 | Cape May | 8.6% | $45,945 | $3,829 | $426 | 33% | 3,566 | $596,070 |
| #7 | Jersey Shore | 6.5% | $48,379 | $4,032 | $442 | 34% | 3,468 | $626,016 |
Markets are ranked by the median of each eligible home’s annual room-revenue potential divided by its ZIP- and bedroom-matched home value. Cleaning income is excluded. Gross yield is before expenses, financing, taxes, and local rules.
Revenue uses the same matched homes as yield and excludes estimated cleaning income. Monthly potential is annual potential divided by 12.
ADR is the average booked nightly rate. It includes cleaning fees, which are bundled into the nightly rate, and excludes other guest fees.
Occupancy is adjusted occupancy of bookable nights, excluding host-blocked nights.
Gross yield is the median of individual home yields, rather than a ratio of the displayed medians.