
Kostenlose Sofortanalyse
Airbnb-Umsatz für jede Adresse oder Stadt anzeigen
Most Airbnb hosts set their nightly rate by gut feeling, a competitor glance, or whatever the platform suggests — then wonder why their calendar looks full but their bank account doesn't.
Pricing a short-term rental well isn't intuition. It's data. And the hosts and investors who treat Airbnb pricing factors as a measurable system — not a guessing game — consistently outperform the market on revenue per available room. Here's what the numbers actually say.
What Actually Drives Airbnb Pricing: A Data Overview
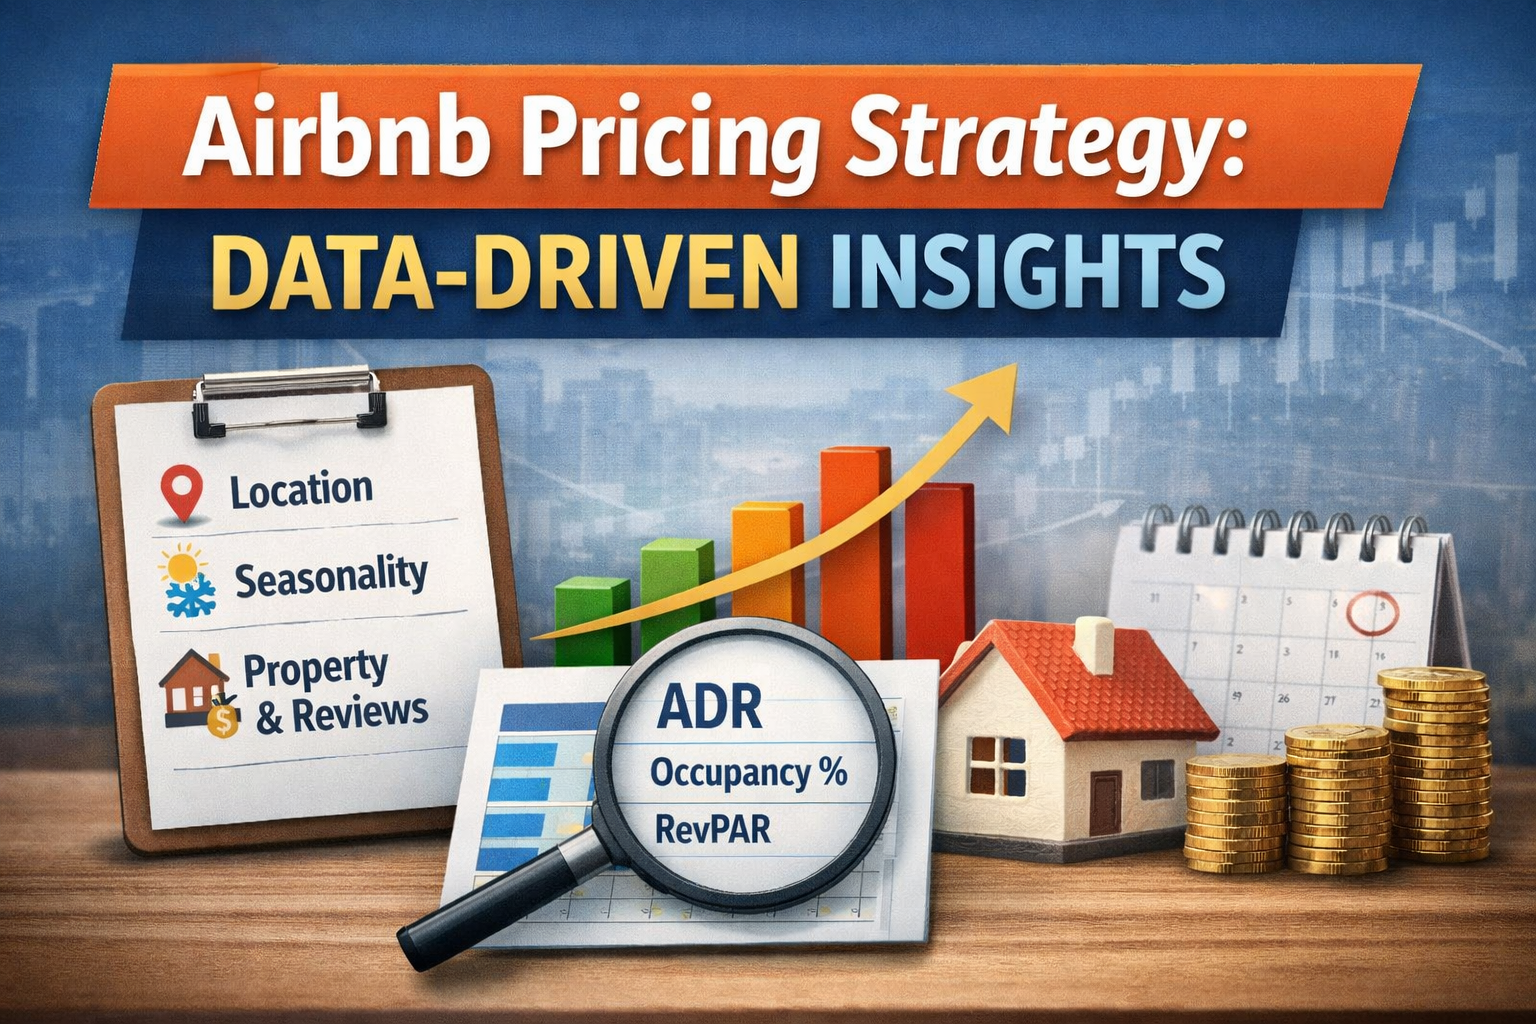
Airbnb pricing factors fall into five categories: location, seasonality, property characteristics, listing quality, and market benchmarking. Every nightly rate you set is either accounting for all five or leaving money on the table.
Why Anecdotal Pricing Fails Investors
Setting rates based on what "feels right" or mirroring a single competitor's price ignores the variables that actually move bookings. A property that looks identical to yours on the surface might have a different review score, bedroom count, or cancellation policy — each of which shifts its competitive position meaningfully.
Anecdotal pricing also fails to capture timing. A rate that's correct on a Tuesday in March is wrong the moment a regional conference gets announced for that same weekend.
How to Read STR Market Data
STR market data gives you three core signals: Average Daily Rate (ADR), occupancy rate, and Revenue Per Available Night (RevPAR). Together, they tell you whether a market rewards high rates with lower occupancy, or lower rates with volume — and which approach generates more total revenue.
Reading this data at the market level first, then filtering down to your property type and bedroom count, gives you a realistic baseline. Rental income analysis that skips the comp-set filter is nearly worthless — you need apples-to-apples comparisons. If you're still evaluating which markets to target, the best cities for Airbnb investing in 2026 offers a data-driven starting point.
Location-Based Pricing Factors
Where your property sits determines its revenue ceiling more than almost any other factor. Location sets the floor on what guests will pay and the ceiling on what the market can bear.
Urban vs. Suburban vs. Rural Demand Patterns
Urban markets tend to command higher ADRs but also face more regulation, higher acquisition costs, and seasonality tied to business travel. Suburban properties often see steadier year-round occupancy driven by families, relocations, and weekend getaways.
Rural and destination properties — cabins, lakefront homes, mountain retreats — show the widest pricing spreads. Peak weekends can run 3–4x the off-season nightly rate, making vacation rental pricing strategy far more calendar-dependent than in urban settings.
Proximity to Demand Drivers (Events, Attractions, Airports)
Properties within 15 minutes of a major airport, convention center, university, or theme park consistently show higher baseline ADR and occupancy. According to 2025 STR data, listings within one mile of a major demand driver average 12–18% higher RevPAR than comparable properties two miles out.
Event proximity matters too — but it cuts both ways. A property near a stadium commands a premium on game weekends, but guests searching mid-week may perceive the area as noisy or inconvenient. Know your demand driver and price accordingly.
Neighborhood-Level Comp Analysis
Market-level data is a starting point, not a strategy. Short-term rental revenue optimization requires zooming in to the neighborhood — or even the street — to find your real comp set. A beachfront block and a block three streets back are not the same market.
Run a comp analysis using properties that match your bedroom count, property type, and amenities within a tight geographic radius. That's the benchmark your pricing should respond to.
Seasonal and Calendar Demand
Seasonality is the most predictable Airbnb pricing factor — and the most underused by hosts who set a flat rate and leave it.
Peak vs. Off-Season Pricing Spreads
The spread between peak and off-season pricing varies dramatically by market. Beach markets in the Southeast see peak summer ADRs running 60–90% above winter rates. Mountain markets flip that pattern — ski season commands premium rates that drop sharply in mud season.
Understanding your market's seasonal curve lets you plan rate floors and ceilings in advance rather than reacting after demand drops. Your vacation rental pricing strategy should map the full 52-week calendar before you list. For a deeper look at how seasonality plays out across different property types, short-term rental seasonality patterns are worth understanding before you finalize your annual rate structure.
Local Event Impact on Nightly Rates
A single large event — a music festival, a college graduation weekend, a championship game — can spike local STR demand by 40–80% for a two-to-three-day window. Hosts who identify these events early and price accordingly capture that premium. Those who don't often get booked at their standard rate two weeks before the event, leaving the premium on the table.
Build a rolling calendar of local events, and check it monthly. Even smaller events — food festivals, marathons, corporate conferences — move demand enough to justify a rate adjustment. For tactical guidance on this, leveraging local events to boost bookings walks through a practical framework.
How Far in Advance Bookings Affect Price
Booking lead time is a real Airbnb pricing factor that most hosts ignore. A booking made 90 days out carries different price elasticity than one made three days before check-in. Last-minute bookings typically indicate either high demand (price up) or a calendar gap you need to fill (price down).
Dynamic pricing tools handle this automatically. Manually managed rates need a clear rule: raise price for distant dates, reduce for close-in gaps that aren't filling.
Property-Level Factors That Move the Needle
Two properties in the same zip code can have a $100/night ADR gap — and it usually comes down to what the property offers, not where it sits.
Bedroom Count and Revenue Scaling
Revenue doesn't scale linearly with bedroom count. A 2-bedroom property doesn't earn twice what a 1-bedroom earns — it typically earns 1.4–1.6x, because ADR increases more slowly than the nightly rate guests expect per bedroom. However, 3- and 4-bedroom properties often show a steeper jump because they capture the group travel segment, which has fewer competing options.
Rental estimate calculators are the fastest way to model revenue by bedroom count before you invest — they let you compare expected returns at each property size without guessing.
Amenities with Measurable Rate Premiums (Pools, Hot Tubs, Parking)
Not every amenity justifies its cost, but several show consistent rate premiums in STR market data:
- Private pool: 15–25% ADR premium in warm-weather markets
- Hot tub: 10–15% premium, especially in mountain and rural markets
- Dedicated parking: 8–12% premium in urban and high-density areas
- Pet-friendly policy: 5–10% occupancy lift, often with a pet fee on top
- EV charging: Emerging premium, particularly in coastal California and Pacific Northwest markets
Amenities that don't show measurable premiums — smart TVs beyond a basic setup, coffee pod machines, branded toiletries — are guest-satisfaction items, not pricing levers.
Review Score Impact on Pricing Power
A listing with a 4.8+ star rating commands meaningfully higher pricing power than one at 4.5. This isn't platform algorithm theory — it's guest behavior. Guests filter by rating, and higher-rated properties get booked first, which means hosts can charge more without losing occupancy.
The relationship between listing optimization and pricing power is direct: a cleaner listing with better photos and a higher review score lets you hold rate when lower-rated comps have to discount to fill their calendars.
Platform and Listing Optimization Factors
Your listing is a sales page. The data on what converts — and what doesn't — should drive how you build it.
How Listing Quality Affects Search Ranking and Conversion
Airbnb's search algorithm weights factors including review score, acceptance rate, response time, and booking conversion. A listing that ranks higher gets more views. More views means more bookings at your current rate — which means you never need to discount to fill. The research on Airbnb listing optimization is clear: professional photos and complete listings measurably outperform amateur ones on both click-through and conversion.
Listing quality is a pricing factor because it determines whether your rate holds or has to drop to generate bookings.
Minimum Stay Settings and Their Revenue Trade-Offs
Minimum stay requirements are one of the most misunderstood short-term rental revenue optimization levers. A 3-night minimum sounds like it protects RevPAR — and on peak weekends it does. But applied flat across the calendar, it creates calendar gaps that never fill.
The data-supported approach: use longer minimums (3–5 nights) for high-demand periods and loosen them (1–2 nights) for shoulder and off-season dates. A dynamic minimum stay rule fills more nights while still capturing the premium on peak dates.
Instant Book and Its Effect on Occupancy
Enabling Instant Book consistently increases booking volume, particularly for price-sensitive travelers who shop multiple listings and book the first one that removes friction. A short-term rental industry report from 2024 found that Instant Book listings show 10–20% higher occupancy on average compared to request-to-book listings in the same market.
The trade-off is less control over who books. Most experienced hosts mitigate this with guest requirements (verified ID, positive reviews) rather than turning Instant Book off entirely.
Dynamic Pricing: The Data-Driven Approach
Airbnb dynamic pricing removes the most common pricing mistake: setting a rate and forgetting it.
How Dynamic Pricing Tools Set Rates
Dynamic pricing tools pull live market data — competitor rates, search volume, local events, historical booking pace — and adjust your nightly rate in real time. They're not guessing; they're responding to actual supply and demand signals in your specific market.
Tools like PriceLabs, Wheelhouse, and Beyond use proprietary algorithms that improve as they accumulate data on your property's individual performance patterns. For a detailed comparison, the PriceLabs vs. Wheelhouse breakdown covers the key differences between the two leading tools.
Balancing Occupancy Rate vs. Nightly Rate for Maximum RevPAR
The core tension in Airbnb dynamic pricing is occupancy rate vs. nightly rate. Optimizing for occupancy alone fills every night but often at rates below market. Optimizing for ADR alone can leave significant calendar gaps.
RevPAR — revenue per available night — is the metric that resolves this tension. A property earning $150/night at 85% occupancy ($127.50 RevPAR) outperforms one earning $200/night at 60% occupancy ($120 RevPAR). Always measure success on RevPAR, not ADR or occupancy alone.
When to Override Automated Pricing
Dynamic pricing tools are not infallible. Override them when:
- You have local knowledge the tool doesn't — a new development, a recurring local event the algorithm hasn't indexed, or a neighborhood shift
- Your calendar shows anomalous gaps — if a date block isn't filling at the suggested rate, a manual review is faster than waiting for the algorithm to correct
- You're protecting a rate floor — never let automation price below your cost basis. Set hard minimums the tool can't breach.
Using Market Data to Set Your Pricing Strategy
Data is only useful when it's actionable. Here's how to structure a vacation rental pricing strategy around the metrics that matter.
Key Metrics: ADR, Occupancy Rate, RevPAR
- ADR (Average Daily Rate): What the market charges per booked night
- Occupancy Rate: Percentage of available nights that are booked
- RevPAR (Revenue Per Available Night): ADR × occupancy rate — the single most important performance metric
Track all three. A rising ADR with falling occupancy is a warning sign. Rising RevPAR with stable occupancy is the goal.
Benchmarking Against Your Comp Set
Your comp set is the 10–20 properties that most closely match yours on bedroom count, property type, location, and amenities. Benchmark your ADR, occupancy, and RevPAR against them monthly.
If your occupancy is above the comp set average, your rate is likely too low. If your occupancy is below average, your rate may be too high — or your listing quality needs attention. This is the rental income analysis loop that separates data-driven operators from reactive ones.
How BNBCalc Surfaces Pricing Insights for Investors
BNBCalc is built specifically for this type of analysis. Enter any address and it pulls projected revenue, ADR, occupancy, and RevPAR benchmarks for that market — broken down by bedroom count and property type. For investors evaluating a deal, that's the difference between a confident underwrite and a guess.
Property managers use the same data to sharpen their pricing strategy before setting rates on a new listing or repricing an underperformer. Keeping up with property condition and cleanliness standards is equally part of the equation — a property that earns strong reviews holds its rate, and one that doesn't, can't.
Key Takeaways for STR Investors
- Airbnb pricing factors are measurable — location, seasonality, property type, amenities, listing quality, and market benchmarks each have quantifiable impact on revenue.
- RevPAR beats ADR as a success metric — a lower nightly rate at higher occupancy often outperforms a higher rate with gaps.
- Dynamic pricing is table stakes in 2026 — manual flat-rate pricing leaves money on the table in any competitive STR market.
- Your comp set is your real benchmark — market-level data is context; property-level comp analysis is strategy.
- Listing quality is a pricing lever — higher-rated, better-optimized listings hold rate when competitors have to discount.
- Calendar management matters as much as rate — minimum stay settings, local event monitoring, and lead-time pricing rules are all revenue tools, not just calendar preferences.
The hosts and investors who treat pricing as an ongoing data discipline — not a one-time setup — are the ones consistently earning above-market returns. The tools exist. The data is available. The question is whether you're using it.
Frequently Asked Questions
What are the most important Airbnb pricing factors? The five biggest factors are location and proximity to demand drivers, seasonality and local events, property characteristics (bedroom count and amenities), listing quality and review score, and how your rate compares to your direct comp set. RevPAR — not ADR alone — is the best single metric to measure how well your pricing is working.
How does dynamic pricing work for vacation rentals? Dynamic pricing tools pull real-time market data including competitor rates, local demand signals, events, and booking pace to automatically adjust your nightly rate. They optimize for RevPAR by raising rates when demand spikes and lowering them to fill gaps — without requiring manual monitoring. Most hosts using dynamic pricing see measurable RevPAR improvement within the first 60–90 days.
Should I optimize for occupancy rate or nightly rate? Optimize for RevPAR, which accounts for both. A high ADR with low occupancy often generates less total revenue than a moderate ADR with strong occupancy. Run the RevPAR math on any pricing decision: multiply your nightly rate by your projected occupancy rate and compare the result across different scenarios.
What amenities add the most to Airbnb nightly rates? Private pools (15–25% premium in warm markets), hot tubs (10–15% in mountain/rural markets), and dedicated parking (8–12% in urban areas) show the most consistent rate premiums in STR market data. Pet-friendly policies add occupancy lift plus fee revenue. Amenities like smart TVs and premium coffee equipment improve guest satisfaction but don't meaningfully move nightly rates.
How do I find my real comp set for pricing benchmarking? Filter for properties that match your bedroom count, property type, amenities, and location within a tight geographic radius — typically under two miles in urban areas, slightly broader in rural markets. Aim for 10–20 properties. Track their ADR, occupancy, and RevPAR monthly. Tools like BNBCalc surface this data automatically for any address, making comp-set benchmarking faster than manual research.
Airbnb Tax Deduction Calculator
Paying too much in taxes? We have the perfect solution. Simulate an Airbnb home purchase below.
Purchase Price
$450K
Structure Value
70%
Apply Trump's Tax Cut (Bonus Depreciation)
Depreciation
$117,695
Interest
$21,600
Tax
$6,750
Year 1 Deduction
$146,045
Want to claim this deduction? Get a free cost segregation benefit analysis from CSA Partners — no obligation.
Get Full Analysis