
Free instant analysis
Reveal Airbnb revenue for any address or city
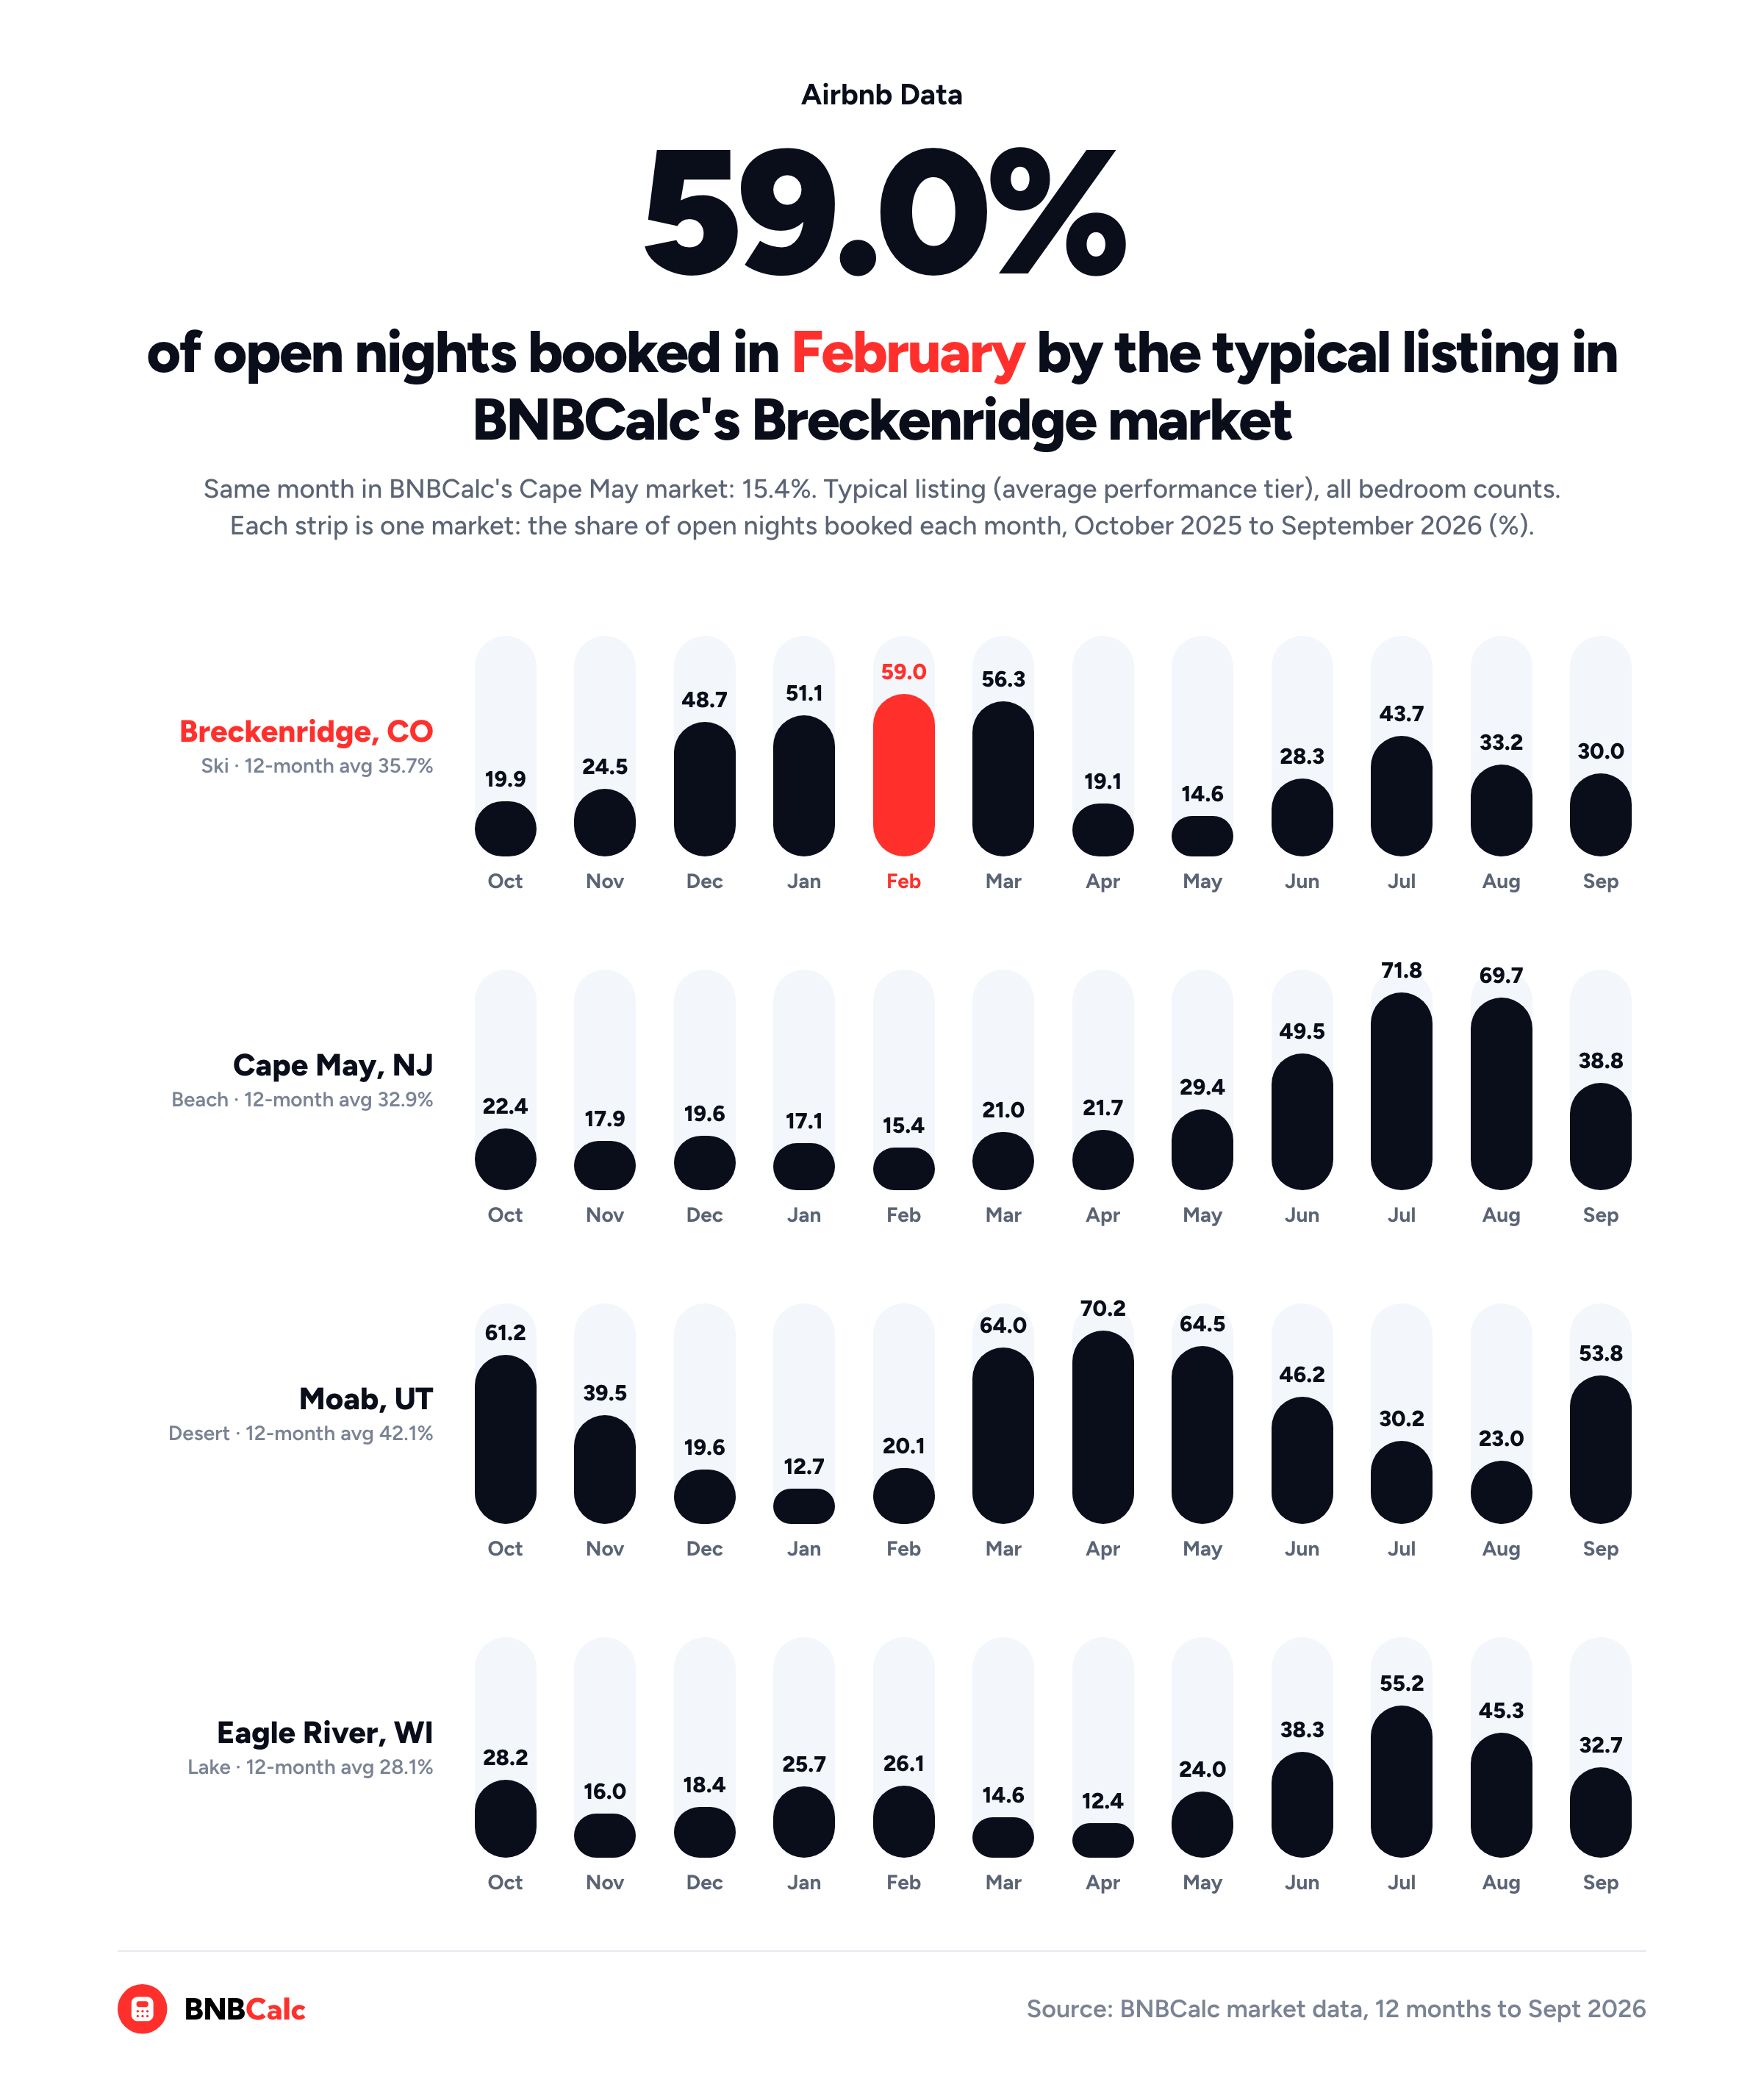
Which months will carry an Airbnb, and which ones will you have to ride out? Well, that depends on the market far more than a yearly average lets on. When I pulled the months for two markets in BNBCalc Markets, the typical listing in its Breckenridge, Colorado market booked 59.0% of its open nights in February 2026, while the typical listing in its Cape May, New Jersey market booked just 15.4%.
By July, the two had swapped. Cape May was at 71.8% and Breckenridge at 43.7%, yet their 12-month averages sat about three points apart, at 35.7% for Breckenridge and 32.9% for Cape May, so if you'd only compared the yearly figures, you'd have called them the same kind of market.
A market's months are worth reading before you buy, since your mortgage payment doesn't shrink in the slow ones. I'll start with where BNBCalc Markets shows them, then read four markets with very different years, and finish with how the BNBCalc Calculator counts the slow months in its estimate.
Where Can You Find Airbnb Seasonality Data by Market?
Open any market in BNBCalc Markets and go to its Marketwide Stats tab, where the two cards you want are Occupancy rate and Avg daily rate.
Each card shows a 12-month average with a small chart under it, and since the solid line on that chart is the last 12 months, you can hover it to read each month's figure.
Occupancy on that card counts booked nights against the nights a host left open, so blocked dates don't drag it down. Airbnb's own performance data defines it the same way, as "the number of nights booked divided by total nights available to be booked." The nightly rate, meanwhile, is what guests actually paid per booked night, cleaning fee included.
Both cards start on the typical listing across every bedroom count, which is what BNBCalc calls the average performance tier.
However, a Markets plan lets you switch them to another performance tier or to your bedroom count, and you'll want both. To see how the cards work first, open Broken Bow, Oklahoma, which is unlocked for everyone.
The data behind the cards covers Airbnb, Vrbo and Booking.com listings and refreshes monthly. For how occupancy works on a single property, see our guide to estimating Airbnb occupancy.
How Do You Read an Airbnb Market's Peak and Slow Months?
With both cards open, I'd work through five questions that a yearly average can't answer.
- When are the busy and slow months? Find where the occupancy line peaks and where it bottoms out, and how far apart they sit. In a strongly seasonal market, few months land anywhere near the 12-month average.
- Does the nightly rate move with them? Check the same months on the Avg daily rate card. If the rate climbs with occupancy, the busy months bring more nights and pricier ones, while a flat rate means the season shows up mostly in nights booked.
- How long does the slow stretch run? Some markets have one season and a long quiet spell, while others have two seasons with short gaps. The longer the quiet spell, the more months you'll cover the mortgage with little coming in, so make sure your cash reserve can carry it.
- Do the best listings fill the slow months? Set the performance selector to High. If even the top performers barely book those months, that's the market, but if they hold up far better than the typical listing, a strong listing can win some of it back.
- What does your size look like? Switch All beds to the bedroom count you're buying, because a four-bedroom's year doesn't always match a one-bedroom's.
What Does Airbnb Seasonality Look Like in Different Markets?
To see those questions at work, I pulled four US markets from BNBCalc Markets: a ski market in Colorado, a beach market in New Jersey, a desert market in Utah and a lake market in northern Wisconsin. Each one had a very different year over the 12 months to September 2026.
| Market | Busy season | Slow season | 12-month average |
|---|---|---|---|
| Breckenridge, CO (ski) | January to March, 51.1% to 59.0% at $595 to $646 a night | October, then April and May, 14.6% to 19.9% at $263 to $338 | 35.7% at $424 |
| Cape May, NJ (beach) | July and August, 69.7% to 71.8% at $549 to $571 | October to April, 15.4% to 22.4% at $327 to $418 | 32.9% at $426 |
| Moab, UT (desert) | March to May, then September and October, 53.8% to 70.2% at $362 to $428 | December to February, then July and August, 12.7% to 30.2% at $196 to $307 | 42.1% at $314 |
| Eagle River, WI (lake) | June to August, 38.3% to 55.2% at $331 to $350 | November and December, then March and April, 12.4% to 18.4% at $225 to $275 | 28.1% at $290 |
Each row runs from the busy season to the slow one, and then to the yearly figure that averages all 12 months. What struck me is how little that last column tells you. Breckenridge and Cape May sit about three points apart on occupancy and two dollars apart on rate, yet their busy seasons fall at opposite ends of the year.
Let's take a quick break for what a market's name covers, since three of these four reach well past their town. A BNBCalc market is a named area with a boundary, such as a city, region or resort area, so its figures can include the towns around it.
For example, BNBCalc's listing data puts about half of the Breckenridge market's listings in Breckenridge's 80424 ZIP code, and most of the rest around Keystone, Dillon, Frisco and Silverthorne. Cape May's market is similar, with about three in ten listings in Cape May's 08204 ZIP code and about four in ten around Wildwood, North Wildwood and Wildwood Crest. Meanwhile, only about one in seven of the Eagle River market's listings are in the city's 54521 ZIP code.
So make sure to check where a market's listings sit on its Listings tab map before you treat its months as one town's. Ok. Back to the months, starting with Breckenridge.
When Is Breckenridge's Peak Airbnb Season?
Winter, by a wide margin. From January through March, the typical listing in BNBCalc's Breckenridge market booked 51.1% to 59.0% of its open nights, at $595 to $646 a night, and December wasn't far behind at 48.7%.
Then April and May dropped to 19.1% and 14.6%. A smaller summer season followed, peaking at 43.7% in July, which still sat below every month from January to March.
The rate climbed too. February's $646 was about two and a half times October's $263, so in Breckenridge the busy months bring more nights and pricier ones.
About one in five of the market's listings offers ski-in/ski-out access, according to BNBCalc's listing data. If I were buying there, I'd make sure the numbers can carry April and May, the market's two slowest months.
When Is Cape May's Peak Airbnb Season?
July and August, and little else. The typical listing in BNBCalc's Cape May market booked 71.8% of its open nights in July and 69.7% in August. By contrast, every month from October through April stayed between 15.4% and 22.4%, with February the slowest.
June (49.5%) and September (38.8%) sat in between as shoulder months, while the nightly rate peaked at $571 in July, about 75% above March's $327.
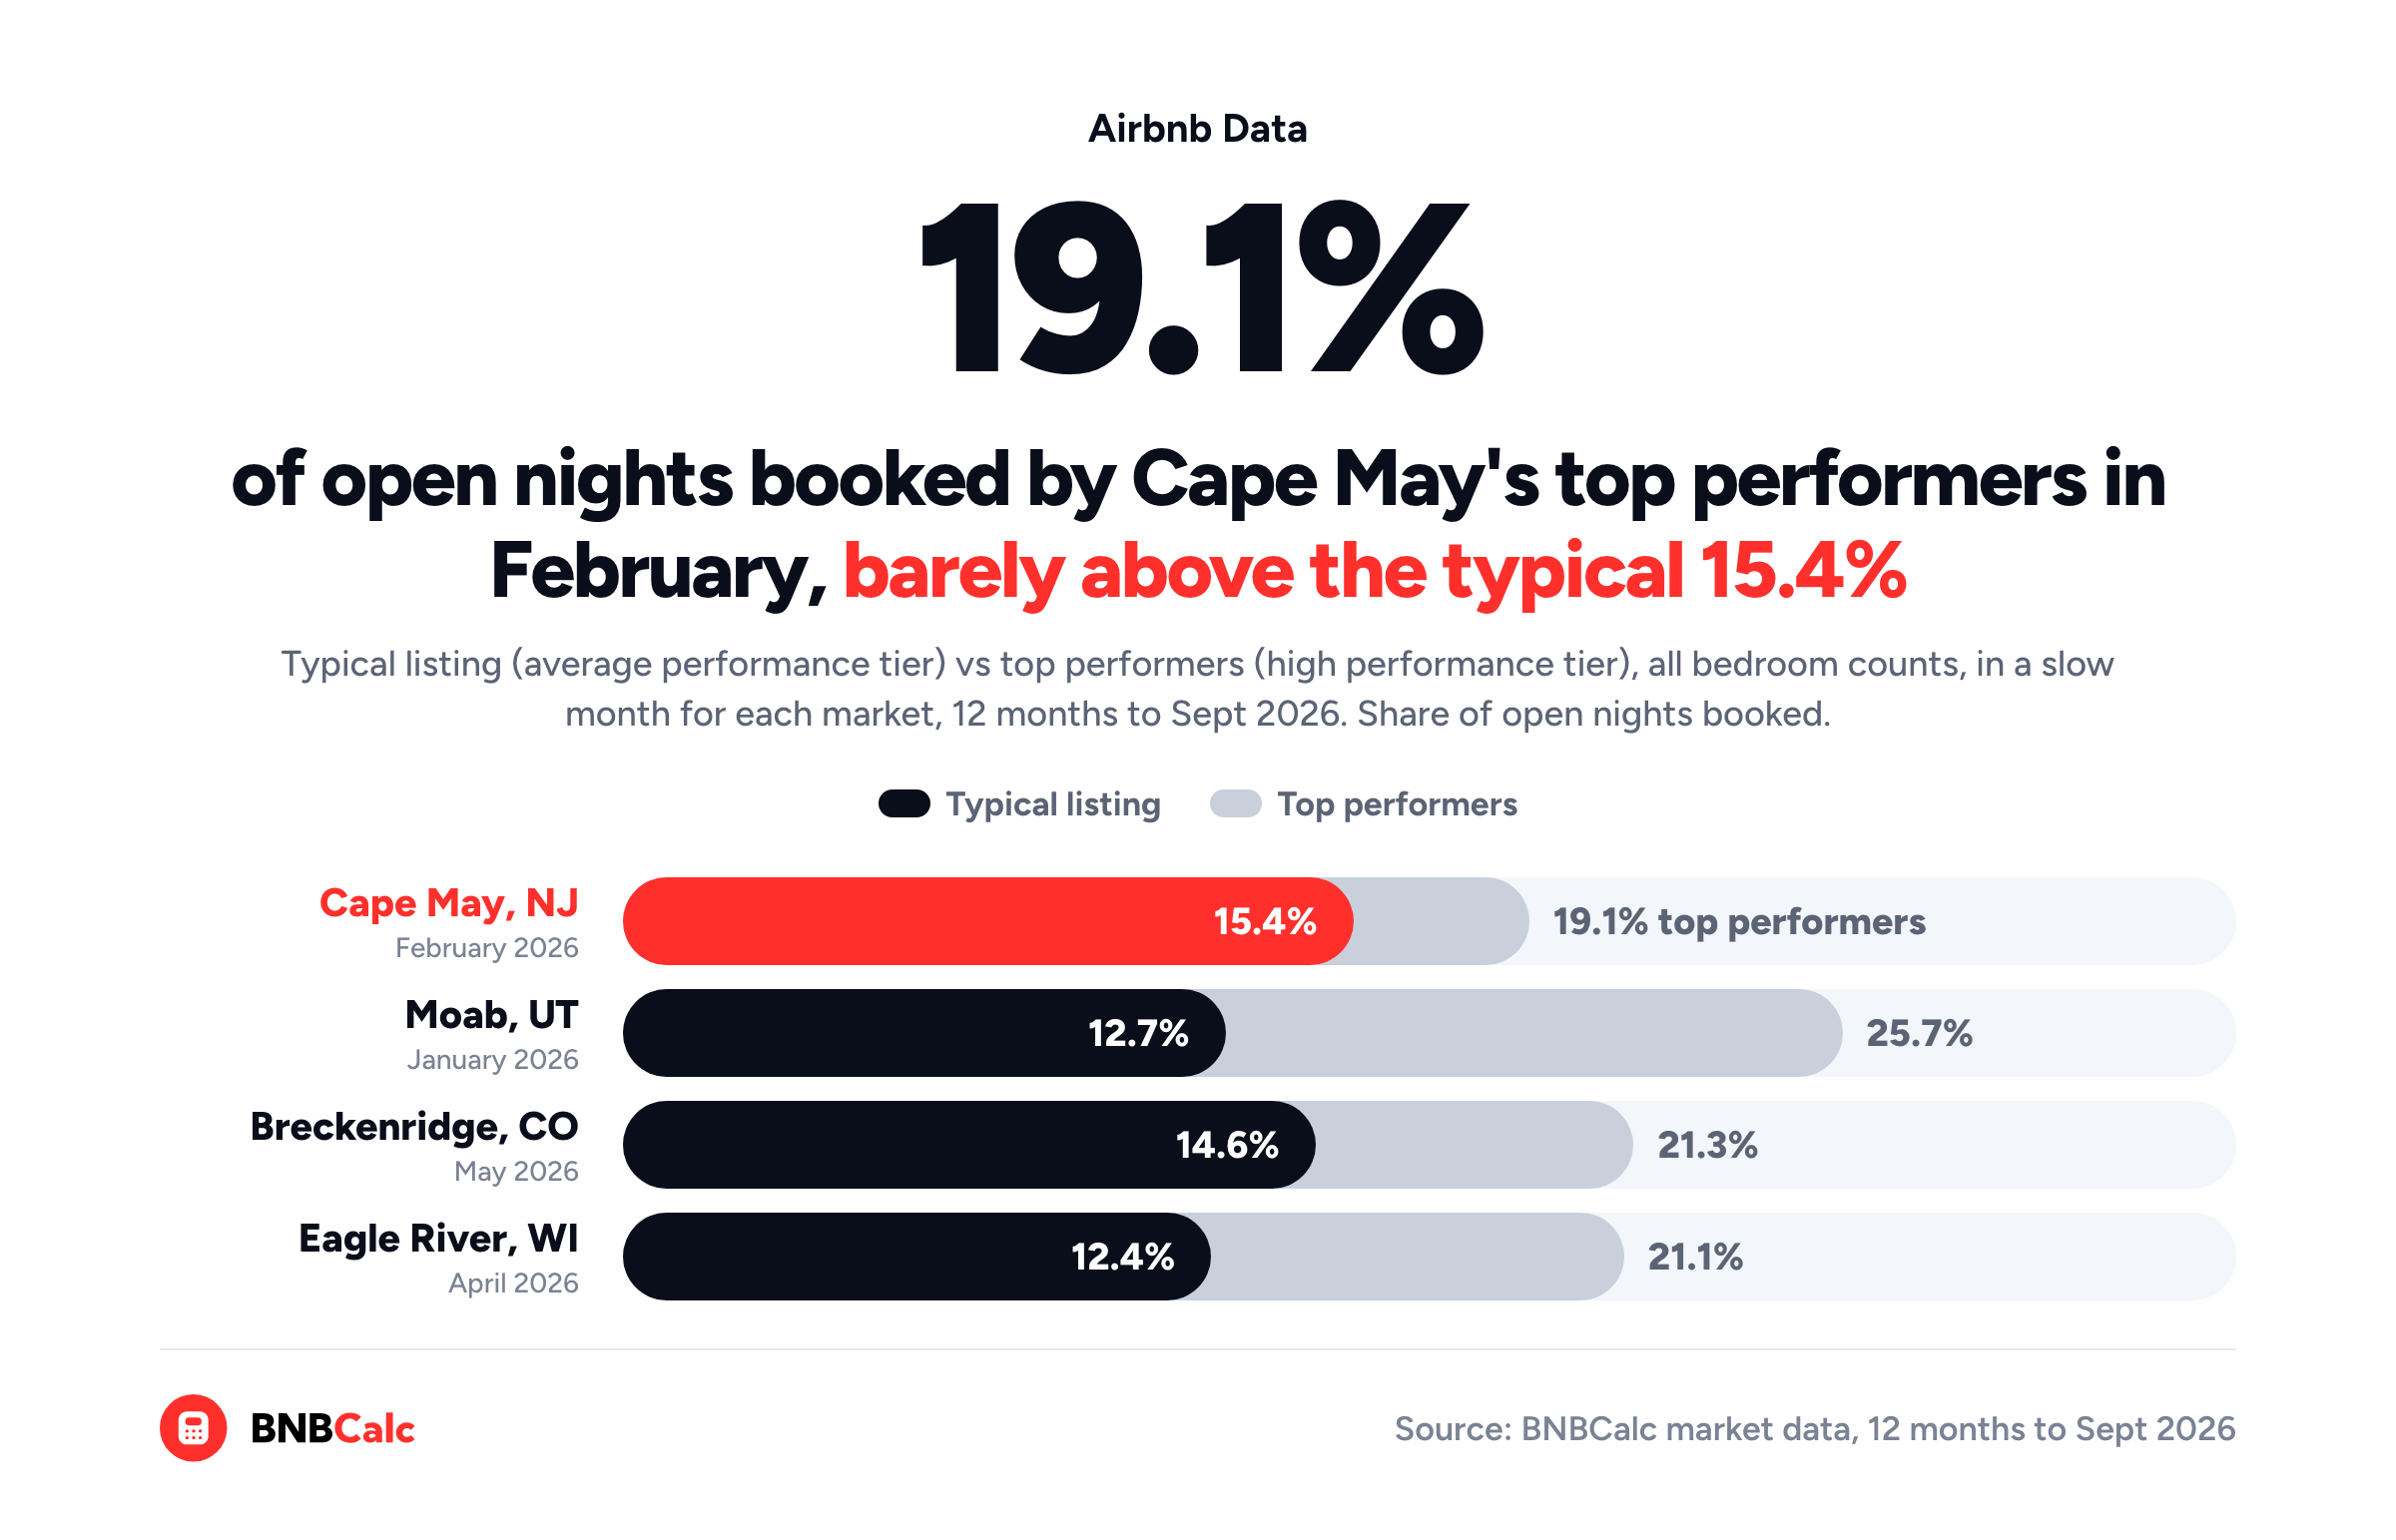
Now switch the performance selector to High, and you'll see the slow winter hits the whole market. Even Cape May's top performers booked only 18.2% of their open nights in January and 19.1% in February.
What Are the Busiest Months for an Airbnb in Moab?
Spring and fall, which is where a desert market can surprise you. The typical listing in BNBCalc's Moab market booked 64.0% to 70.2% of its open nights from March through May, and 53.8% to 61.2% in September and October, at $362 to $428 a night.
Winter, on the other hand, was slow, with December through February at 12.7% to 20.1% and $196 to $214 a night, and January the slowest month of all. Yet summer slowed too, with July at 30.2% and August at 23.0%, at $307 and $272 a night.
That pattern matches what the National Park Service says about Arches National Park, five miles north of town. Its Arches weather page calls spring and fall "the temperate (and most popular) seasons" and warns that summer temperatures often exceed 100 degrees.
By contrast with Cape May, Moab's top performers kept a real share of the winter. They booked 25.7% of their open nights in January, about twice the typical listing's 12.7%, so I'd read Moab's winter as one a strong listing can partly win back.
Is Eagle River, Wisconsin a Year-Round Airbnb Market?
Not quite, but it does have more than one season. About two in three of the listings in BNBCalc's Eagle River market offer lake access, according to its listing data, and summer is the main event. In July, the typical listing booked 55.2% of its open nights at $348 a night.
Even so, January and February held at 25.7% and 26.1%, well above November and December (16.0% and 18.4%) and March and April (14.6% and 12.4%). April was the slowest month of the year.
The rate moves far less, staying between $225 and $350 a night all year. In other words, Eagle River's season shows up mostly in how many nights you book.
I can see that winter bump in BNBCalc's data, but not what drives it. So before you count on winter income there, ask a local property manager what fills those weeks.
Across all four markets, the gap between typical and top-performing listings in a slow month shows how much of the off-season a strong listing can win back.
How Does the BNBCalc Calculator Account for Slow Months?
Those market months tell you what to expect before you have an address. Once you've got one, the BNBCalc Calculator folds the slow months into its annual estimate, because it builds that estimate from comparable listings' full-year figures.
Each comp brings a full year of figures with it. That's either the revenue the comp earned over the past 12 months or, for comps from BNBCalc's own listing data, a full-year figure built from its nightly rate and the occupancy of its open nights, blended with nearby listings.
A comp that's been live less than a year shows Revenue (Annualized) instead, meaning its months so far scaled up to a year. I'd lean on the comps with a full year behind them, since their numbers cover every season, and you can untick any comp you'd rather leave out.
The report's Seasonality card helps with the cash side. Its Profit tab draws your monthly break-even, meaning your monthly running costs plus your mortgage and taxes, as a dashed line. Since most of that line, the mortgage, property tax and fixed bills, comes due whether guests book or not, hold it up against the slow months you found on the Occupancy rate card in BNBCalc Markets. Then make sure your cash reserve can carry the house through the longest quiet stretch before you make an offer.
So, How Do You Read Airbnb Seasonality by Market?
Read the months, not the average. That means finding a market's busy and slow seasons on the Occupancy rate card in BNBCalc Markets, checking the nightly rate for the same months, then switching to top performers and to your bedroom count. When I did that for the 12 months to September 2026, it turned up four different years: Breckenridge's winter, Cape May's two summer months, Moab's spring and fall, and Eagle River's summer with a smaller winter season.
Once you've found a house, run it through the BNBCalc Calculator, whose annual estimate already counts the slow months, and use the break-even line on its Seasonality card to plan the cash you'll need for the quiet stretch.
A yearly average tells you how much a place earns. The months tell you whether you can hold on long enough to collect it.
Frequently Asked Questions
What Is the Slowest Month for an Airbnb?
It depends on the market, which is why BNBCalc Markets charts occupancy month by month for each one. Over the 12 months to September 2026, BNBCalc's data shows the typical listing in its Cape May market had its slowest month in February, at 15.4% of open nights booked, while Moab's was January at 12.7% and Eagle River's was April at 12.4%. In Breckenridge, April and May were the slowest pair, at 19.1% and 14.6%.
Where Can You Find Monthly Airbnb Occupancy Data for a Market?
In BNBCalc Markets. Open a market, go to Marketwide Stats, and hover the solid line on the Occupancy rate card's mini chart to read each of the last 12 months, then do the same on the Avg daily rate card for the nightly rate. With a Markets plan, you can switch both cards to a bedroom count or a performance tier. BNBCalc's data covers Airbnb, Vrbo and Booking.com listings and refreshes monthly.
Do Airbnb Nightly Rates Change by Season?
It depends on the market, and BNBCalc Markets' Avg daily rate card shows by how much, month by month. Over the 12 months to September 2026, the typical listing in BNBCalc's Breckenridge market averaged $646 a night in February and $263 in October, while Eagle River's stayed between $225 and $350 all year. BNBCalc's nightly rates are what guests paid per booked night, cleaning fees included.
Does the BNBCalc Calculator Account for Seasonality?
Yes, in its annual estimate. The BNBCalc Calculator builds that estimate from comparable listings' full-year figures, so comps with a year of bookings behind them bring their slow months in with their busy ones. Its Seasonality card adds a cash-flow planning view with your monthly break-even line, while a market's busy and slow months themselves are on the Occupancy rate and Avg daily rate cards in BNBCalc Markets.
Is a Seasonal Airbnb Market a Bad Investment?
Not on its own, and BNBCalc Markets shows why: the typical listing in its Moab market grossed $64,351 over the 12 months to September 2026, even though it booked just 12.7% of its open nights in January. Check a market's slow months on its Occupancy rate card, then run the address through the BNBCalc Calculator, whose annual estimate already includes them. What matters is whether the busy months cover the slow ones, and whether you can carry the house in between.
BNBCalc Markets Pricing and Free Trial
When you're ready to read a market's months for yourself, BNBCalc Markets is $79 a month or $399 a year as of October 2026, and it includes the full BNBCalc Calculator, which is $30 a month or $199 a year on its own.
If you'd like to try it first, you can run two property analyses free, or start a 7-day free trial with full access.
Airbnb Tax Deduction Calculator
Paying too much in taxes? We have the perfect solution. Simulate an Airbnb home purchase below.
Purchase Price
$450K
Structure Value
70%
Apply Trump's Tax Cut (Bonus Depreciation)
Depreciation
$117,695
Interest
$21,600
Tax
$6,750
Year 1 Deduction
$146,045
Want to claim this deduction? Get a free cost segregation benefit analysis from CSA Partners — no obligation.
Get Full Analysis