
Free instant analysis
Reveal Airbnb revenue for any address or city
How does Airbnb decide which listings show up first, and how much of the listing optimization advice you hear actually holds up? Well, the same few claims turn up almost everywhere: professional photos add $2,500 a year, your cover photo moves bookings by 25 to 30 percent, there are thirteen ranking factors, and wishlist saves matter.
So we went looking for where they come from, starting with what Airbnb itself publishes about search and then the peer-reviewed research. Some of it holds up. Some of it traces back to figures we couldn't match to any published method, repeated until they sounded like common knowledge. Even the most rigorous academic paper on listing performance works from data that's more than a decade old, studies one city and is easy to misread.
We wrote this because we got tired of citing numbers we couldn't trace, and because if you're about to spend time and money fixing a listing, you deserve to know which claims hold up and which ones don't.
How Does Airbnb Rank Listings in Search?
Airbnb doesn't publish its formula, but its help page on how search results work says more than most guides give it credit for. The algorithm considers many factors, and four of them heavily influence where a listing appears: quality, popularity, price and, for homes, location. It also builds in variety, so guests see listings from different hosts, with different characteristics and a range of prices.
Each of the four gets a short definition there, and quality is the broadest: it covers your photos and videos, guest ratings and reviews, how you and your guests communicate on the platform and the listing's own characteristics, along with customer service and cancellation information and, for homes, amenities. Popularity, meanwhile, comes from how guests engage with the listing, such as how often they save it to a wishlist, book it or message you. And price means your total price and how it compares with other listings in the area for the same dates, with Airbnb saying that listings priced below comparable ones tend to rank higher.
Then there's what you control as a host. The same page says that opening more dates, allowing more flexible stay lengths, adjusting your price or offering discounts, adding great photos, a detailed description and the amenities guests look for, and the hospitality behind the Superhost criteria (few cancellations, quick responses, good ratings) can all help, and that listings guests can book instantly may rank higher. Keep in mind that it personalizes results too, so if a guest's past bookings share certain characteristics, listings with those characteristics may rank higher for that guest.
What the page won't give you is a weight for any of it, and it says Airbnb's ranking algorithms "will evolve over time." So if a guide hands you exact percentages for Airbnb's ranking factors, it's worth asking where they came from. Airbnb's engineers, on the other hand, have published a fair amount about how the ranker works.
What Do Airbnb's Own Engineers Say About Ranking?
Most listing advice skips this part, but Airbnb's search ranking team publishes papers, with results from A/B tests on real search traffic.
In Learning To Rank Diversely, the team describes moving away from scoring each listing's booking probability on its own and toward ranking the results page as a whole, so that it holds a more diverse set of listings. In the online A/B test, bookings rose 0.29% and gross booking value 0.8%, with almost the entire gain coming from people booking on Airbnb for the first time. In plain English, if your listing looks too similar to everything else on the page, being individually strong may not be enough to keep it near the top.
A 2025 follow-up from the same team, Beyond Pairwise Learning-To-Rank, measures its improvements in offline and online experiments at Airbnb. It also says booking is the main objective but not the only one, and uses the 5-star ratings guests leave after a stay as its example of another. A separate paper, Learning to Rank for Maps at Airbnb, explains that list results and map pins had used the same ranking since both views launched, until the team found that some of the assumptions behind list ranking break down for maps and rebuilt ranking for the map view.
So the factor lists you'll see in listing guides, thirteen factors in one popular version, are best read as a map of the signal categories Airbnb weighs rather than as the ranker itself, which is a learned model that keeps changing and treats list and map results differently. A list like that is still the practical way to work on a listing, as long as you don't expect it to match the model one for one.
Do Wishlist Saves Help Your Airbnb Ranking?
Yes, up to a point. Airbnb's help page counts how often guests save a listing to their wishlist toward its popularity, alongside how often they book it and message you. Its engineers' write-up on embedding-based retrieval, though, describes training a model that picks which homes to consider for a search, with the booked home as the positive example and, as negatives, homes the guest saw or even wishlisted but didn't book. So a save that turns into a booking is the signal that helps you most, while a save that never converts teaches that model your listing was a close-but-not-quite option for that search.
How Much of an Airbnb's Revenue Comes Down to the Listing Itself?
Ranking gets a guest to your listing, but it doesn't tell you how much the listing itself decides what you earn. The most methodologically serious study of Airbnb listing performance we could find is a multilevel hedonic analysis of Airbnb listing prices and revenue by researchers at McGill University, published in Regional Studies, Regional Science in 2019. It uses 386,153 listing-month observations from New York City between 2014 and 2016, which is a real dataset and a real regression, not a blog post with a bar chart.
The headline finding most operators have never heard: in the model, differences between listings accounted for 79.8 percent of the variation in nightly price, but only 32.1 percent of the variation in monthly revenue.
Sit with that for a second. It means the unit itself largely sets what you can charge per night, while what it earns moves around a lot more. Be careful how you read the other two-thirds, though. Most of it is variation within the same listing from one month to the next that the paper doesn't attribute to the property or the neighborhood, such as a host who only lists the place for part of a month, so it isn't proof that copy and photos drive two-thirds of revenue.
The same paper does point at things you control. Holding the rest of the model constant, listings with Instant Book switched on earned 14.2% more in monthly revenue at 1.8% lower nightly prices, and Superhost status went with 15.1% more. Those are associations from one city's data rather than proof that flipping a switch adds 14%, yet they line up with what Airbnb's help page says about Instant Book and the Superhost criteria, and they come from the one paper hardly anyone in hosting circles cites.
Does an Extra Bathroom Earn More Than an Extra Bedroom?
The McGill paper also reports per-marginal-unit coefficients for things like bedroom count and bathroom count, holding everything else constant. When we first read this, one number jumped out: adding a bathroom looked like it increased revenue slightly more than adding a bedroom (+14.8 percent versus +11.0 percent per unit).
We almost shipped that as a finding. Then we checked it against our own data and realized we would've been wrong in a way that matters.
The McGill coefficient answers a very specific question: if you took the exact same listing and added one bathroom, what would happen? That's not the question an investor is asking. An investor is asking whether a 5BR earns more than a 3BR in the same market, which is a totally different calculation that sweeps in square footage, lot size, group capacity, ADR tier, management sophistication, pool presence, and about twenty other things correlated with bedroom count.
Both things can be true. Per-unit, bathrooms are competitive with bedrooms in a 2016 NYC apartment sample. In aggregate, bigger homes earn far more in total revenue, because square footage, group capacity and nearly everything else scale with bedroom count.
The lesson isn't about bathrooms. The lesson is that regression coefficients from one paper don't transfer cleanly into operator intuition, and when they conflict you should trust the bigger, more recent, more relevant dataset. Which is awkward to say about a peer-reviewed paper, but it's also true.
Which Cover Photo Gets an Airbnb Listing Booked?
So what can you change after closing? Photos are the obvious place to start, and the most careful study of cover photos we could find is a 2023 paper in the International Journal of Research in Marketing, Image features and demand in the sharing economy. It looked at the image Airbnb shows in search results, using New York City and San Francisco listings over a 16-night year-end holiday period, and its model accounts for property and host characteristics.
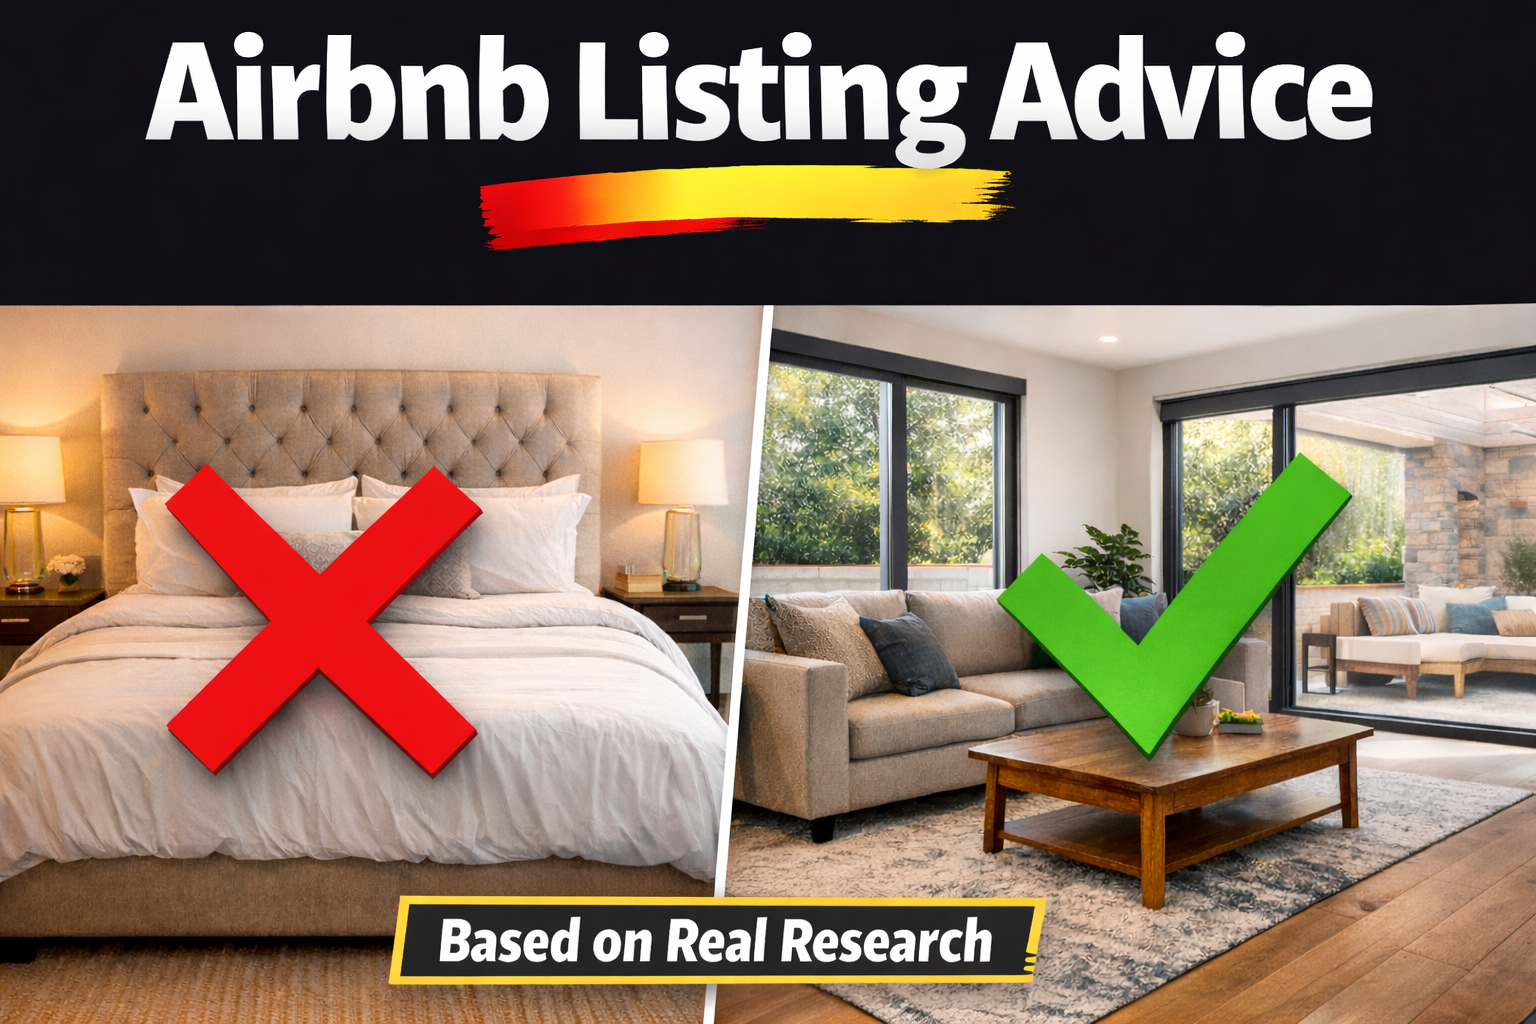
Two findings matter. Content beats aesthetics, meaning what's in the cover photo moved the booking rate more than its clarity, brightness or contrast did. And a living room cover helped while a bedroom cover hurt: covers that featured the living room and showed more interior design raised the booking rate, while featuring a bedroom lowered it.
There's a useful caveat, though. A 2023 Management Science study of photo layout found that the cover image has a significantly larger impact than the photos after it, which agrees on what matters most, but in its model a high-quality bedroom cover led to the largest increase in demand. The same study estimated that a listing switching to its best photo layout (which photos it leads with, and in what order) on its own would get 11.0% more bookings on average. So get the cover right first and the order behind it next, but don't treat "never a bedroom" as settled, since the two studies disagree on it.
Does Your Airbnb Listing Description Affect Bookings?
Photos aren't the only thing guests weigh before they book, either. For the description, our advice comes from experience rather than from a study: write like someone who knows the area, not like a hotel brochure.
Generic superlatives ("luxurious," "stunning," "world-class amenities") don't give a guest anything to picture, while specifics ("we lived on this block for eight years," "the bakery two doors down opens at 6") show them what the stay will be like. In our experience, five-star reviews tend to name specific details, while lukewarm ones stay vague.
What we haven't found is a clean test of the formatting conventions most listing guides teach, such as amenity-stacked titles, short summaries with a review quote, wishlist prompts and bracket-style photo captions. They come from hosts who've run a lot of listings rather than from peer-reviewed studies, which doesn't make them wrong. It just means your own guests are the better test, since their reviews tell you which details they noticed and which ones they wish you'd mentioned.
Where Do the Popular Airbnb Photo Numbers Come From?
That brings us back to the photo figures you'll see quoted most often: professional photos add $2,521 a year, a better cover photo lifts your booking rate by 25 to 30 percent, and 24 to 30 photos is the ideal range. They get repeated across hosting blogs, usually without a link to the study behind them.
We tried to find that study itself, meaning the method rather than the summaries: the sample size, the comparison group and the statistical tests behind the numbers. We couldn't find one published, so we can't tell you what those figures measure or whether they'd hold for your listing, and we'd treat the exact numbers as unconfirmed until someone publishes the method.
The direction holds up, though. A 2022 Management Science study found that Airbnb properties with photos taken by Airbnb's own photographers had 8.98% higher occupancy than properties with photos the host took, and both of the cover photo studies we covered found that what the cover shows changes bookings. So better photos are worth investing in. Just don't plan around a specific dollar figure or photo count, since we couldn't find where those came from.
If you know where the method behind those figures is published, tell us and we'll update this section.
Should Your Airbnb Cover Photo Be a Collage?
One of the oldest debates in short-term rental marketing is whether to use a single hero photo or a collage that shows the property, the amenities and the brand in one image.
For an Airbnb listing, though, it's mostly a settled question, since I can't see a design-first company like Airbnb rewarding a barely readable collage, especially on a phone, where four to six images stuffed into one frame look crowded. Next time, open yours on your phone and your computer before you decide.
Three reasons the collage loses.
Airbnb crops it. Airbnb's photo guide says it automatically crops photos into squares to fit its search results and your listing, so a four-panel collage gets squeezed into a square thumbnail where every element (logo, text, accent line, hero) shrinks below legibility, especially on a phone.
Airbnb already does the collage for you. Its photo tour help page says your first five photos are displayed prominently on your listing, with the first one shown large in search. Building a collage yourself repeats that work, and does it worse, because you're compressing into one frame what the platform already shows across five.
Where Airbnb spells out a rule, it's single photos. Its photo requirements for Experiences ask for "single photos, not a collage." The home-listing guides we found don't say it in those words, but everything they say about cropping and the cover photo points the same way.
The debate resolves to a single question: where is this asset going to live? If it has to earn a click on Airbnb, use a single strong photo. If it's going on Instagram, use a carousel. The skill of STR marketing is matching the asset to the channel, not picking a universal winner.
How Can You Check Your Airbnb Listing Against These Factors?
The fastest way is BNBCalc's Listing Optimizer, which is called Listing Audit inside the app. You paste your public Airbnb link, and BNBCalc reads the listing, its photos, up to 100 guest reviews and up to 50 nearby listings, then grades the photos, title, description, amenities, guest reviews, booking rules and host profile. That covers most of the ranking signals Airbnb's help page puts in your hands, from your photos and reviews to booking settings like Instant Book, while your nightly rate shows up beside nearby listings as context and never counts toward the grade.
You get back the fixes in order, each with the reason and the evidence behind it: three title options, a rewritten description, a photo order with captions and the quick wins to make first. It usually takes 2 to 4 minutes. As of October 2026, one audit is $19, or $60 for five, as a one-time payment, and each one includes two reruns of the same listing, so you can see how it grades after you've made the changes. Keep in mind that it doesn't connect to your Airbnb account or property management software, and it doesn't edit or price the listing, so the changes are yours to make.
If you'd rather work through it by hand, start with what the research agrees on: the cover photo and the four after it, then the description, your amenity list against nearby listings, your reviews and your booking settings. The Help Center's guide to the Listing Audit shows what each page of the report covers, if you want to see what you'd get before you run one.
What Does the Research Say About Airbnb Listing Optimization?
Airbnb's ranking leans on quality, popularity, price and location, and its engineers rank mainly for bookings while also weighing how the stay goes. Inside that, the research points to a few things worth your time:
- The property largely sets your nightly rate, while revenue moves much more, and in the McGill data Instant Book and Superhost status went with about 14% to 15% more monthly revenue.
- Your cover photo carries more weight than the rest of the gallery, and what it shows matters more than how polished it is.
- Wishlist saves count toward popularity, but a save that turns into a booking is the signal that helps most.
- We couldn't find a published method behind the popular dollar and percentage figures for photos, and Airbnb doesn't publish weights for its ranking factors.
The quickest way to see where your own listing falls short on the parts you control is to run it through BNBCalc's Listing Optimizer.
Most of what you'll read about listing optimization is practitioner consensus, which isn't the same as being wrong. It just means the best evidence for your listing is still the guests who book it, and the ones who looked and booked somewhere else.
Airbnb Tax Deduction Calculator
Paying too much in taxes? We have the perfect solution. Simulate an Airbnb home purchase below.
Purchase Price
$450K
Structure Value
70%
Apply Trump's Tax Cut (Bonus Depreciation)
Depreciation
$117,695
Interest
$21,600
Tax
$6,750
Year 1 Deduction
$146,045
Want to claim this deduction? Get a free cost segregation benefit analysis from CSA Partners — no obligation.
Get Full Analysis