
Free instant analysis
Reveal Airbnb revenue for any address or city
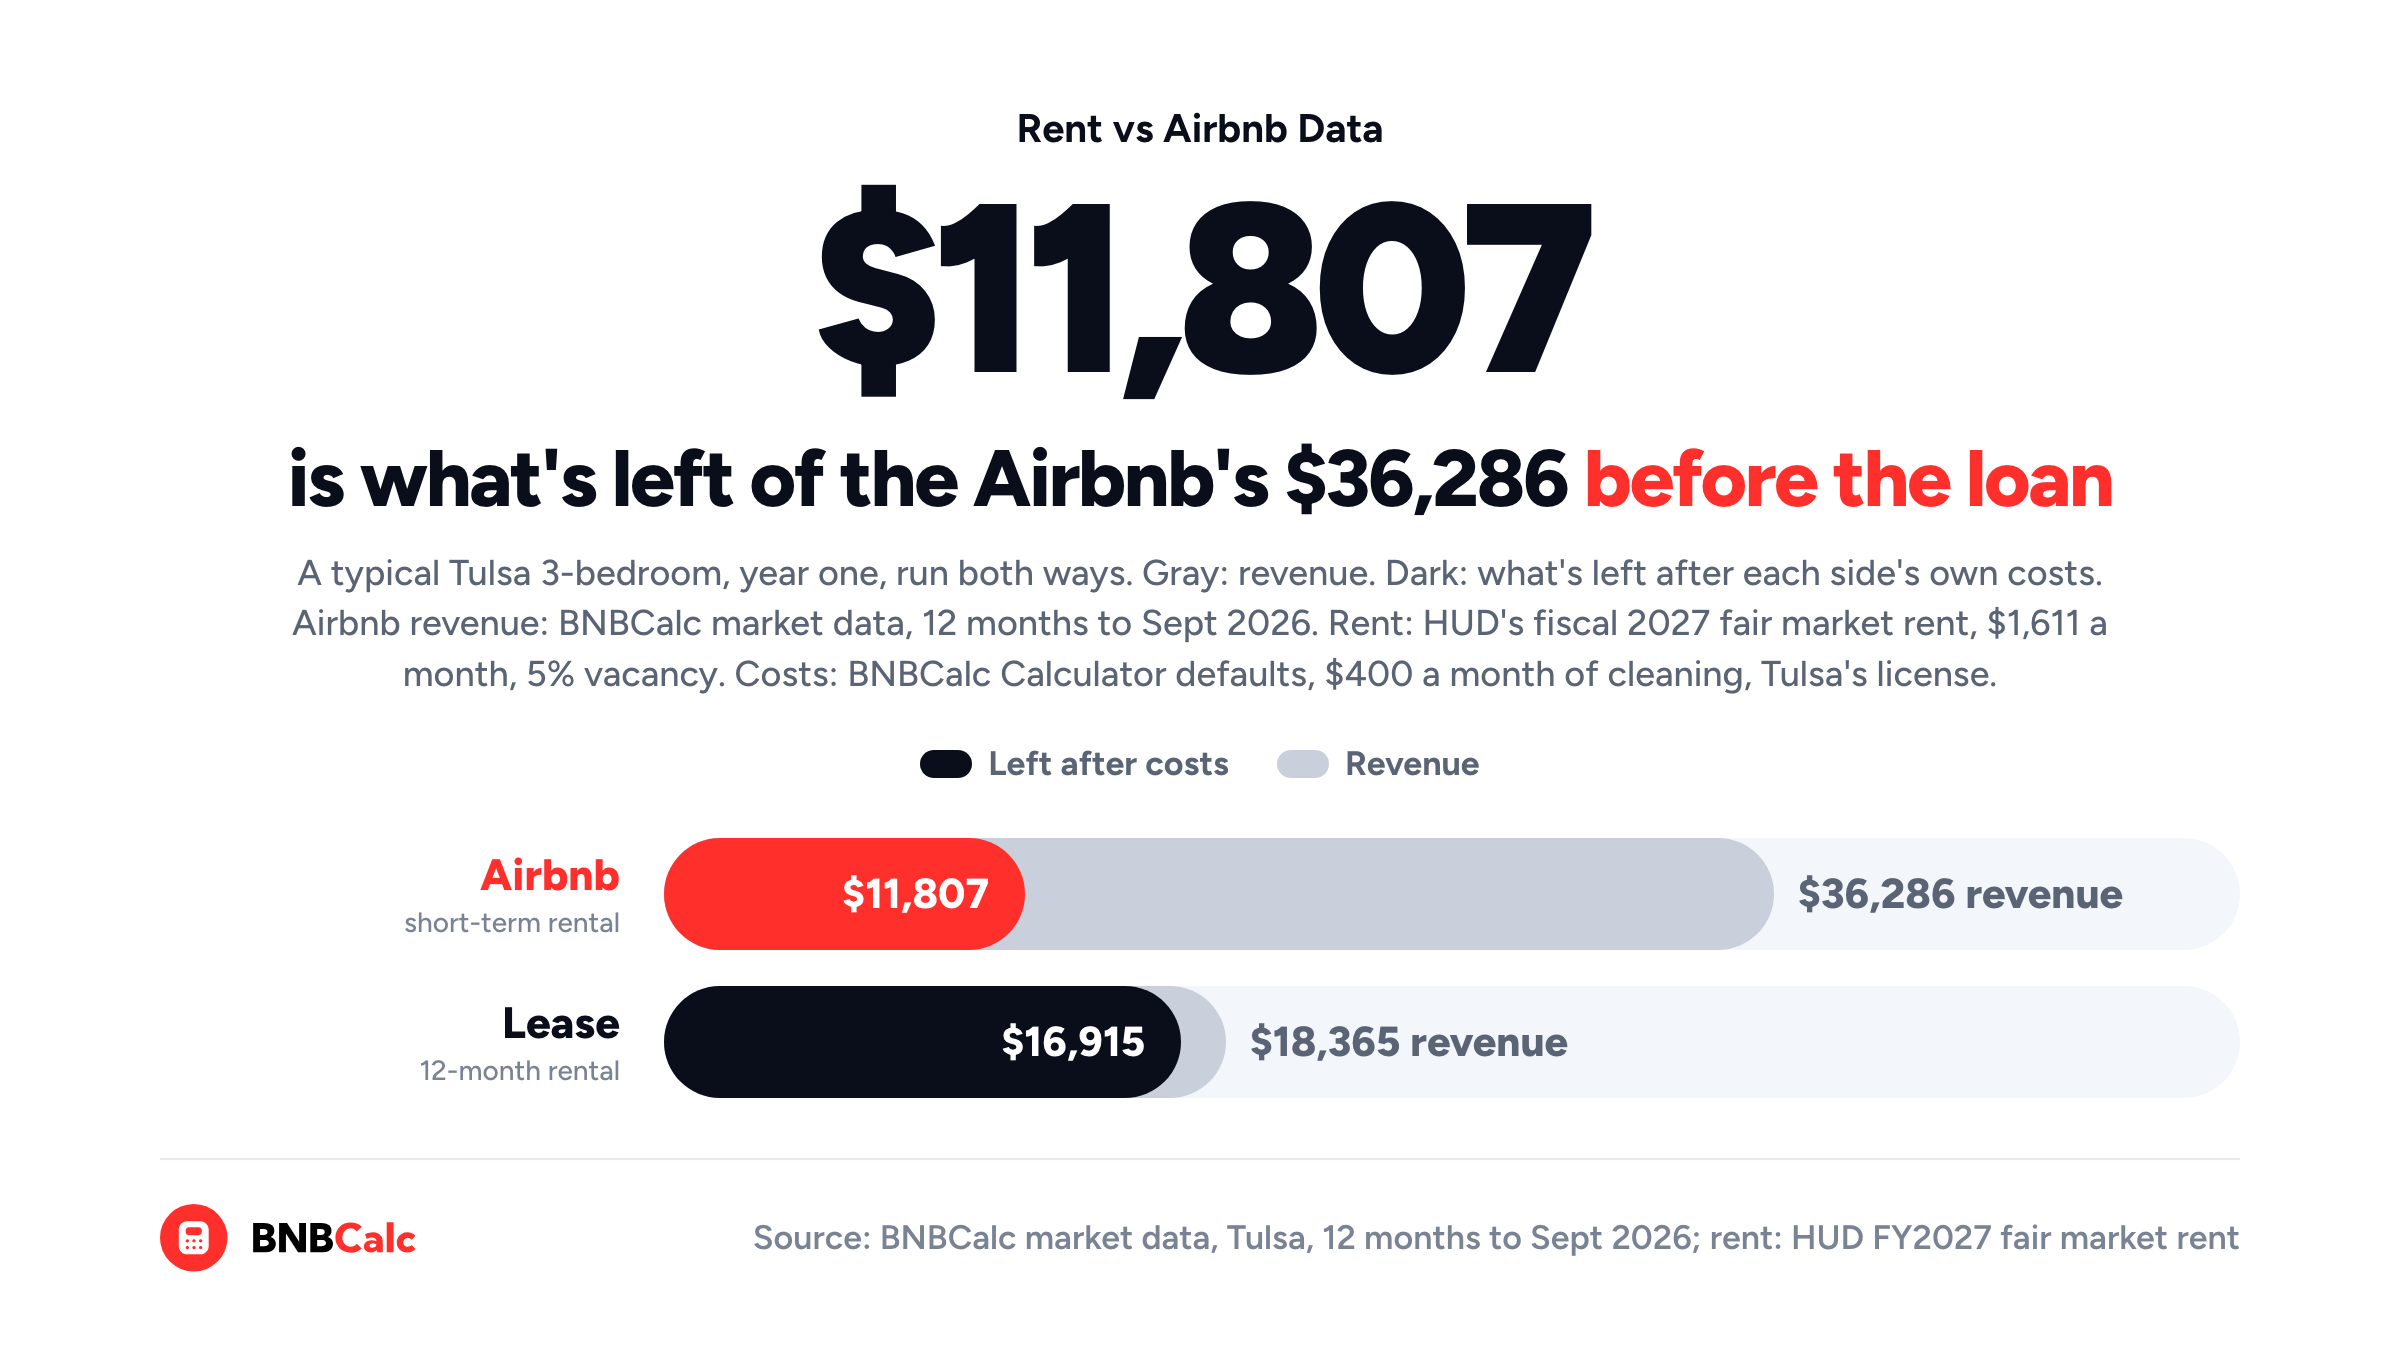
Should you put your property on a 12-month lease or list it on Airbnb, and how do you compare the two on the same house? Well, give both the same loan and compare what's left, not what comes in. In BNBCalc's Tulsa, Oklahoma market data, a typical three-bedroom grossed $36,286 on Airbnb over the 12 months to September 2026, about twice what a lease at HUD's fair market rent brings in. Once illustrative costs and the same loan came out, though, the lease kept $2,136 and the Airbnb lost $2,972.
An Airbnb carries costs a lease never does, like the host fee, a cleaner, the utilities and the furniture, so a gross twice as big can still leave you with less. It isn't a verdict on Airbnb in Tulsa, either, since a listing that earns about a fifth more than typical flips the result.
The BNBCalc Calculator puts both versions of a house side by side, so I'll start there, then run that Tulsa three-bedroom both ways by hand and work out its break-even rent.
How to Compare Rent vs Airbnb in the BNBCalc Calculator
If you've got an address or a Zillow link, the BNBCalc Calculator does most of the comparison for you. Every Buy analysis opens with two cards, Short Term Rental and Long Term Rental, each showing a letter grade, a cash-on-cash return and a cap rate, and clicking either one switches the whole report to that version of the house.
The short-term side builds revenue from up to 50 comparable listings nearby, and on a US property, its AI Underwriter can keep the closest matches and explain each pick. Then the Calculator takes out Airbnb's fee, cleaning and the running costs line by line.
The long-term side swaps in a revenue card built from monthly rent and vacancy instead. If it's a US home, that card lists the rent estimates it used (labeled Zillow and RentRange where it has them), a local vacancy and rent-growth line, and HUD's Section 8 rent for that bedroom count and ZIP code. Then, under it, a Long Term Rental Comparables table lists nearby rentals with their listed rent, size and distance.
What makes the comparison fair is the loan.
Both views read the same price, down payment, rate and term, so Mortgage & Taxes is identical on both cards, and the gap between their Profit (Cash Flow) lines is the gap between the two strategies.
How to Compare Long-Term and Short-Term Rental Income Step by Step
Walking the steps by hand once is still worth it, since that's how you check the Calculator's work and see where the two sides split.
Step 1: Check That You Can Rent It Short Term
Make sure the house can legally rent short term before you compare anything, because a cap or a ban on nightly stays settles the question first. In Tulsa, the city's short-term rental page says short-term rentals are allowed in all zoning districts as long as you hold a $375 license before you advertise, and the license expires every June 30. BNBCalc's Tulsa regulation guide covers the taxes and the rest, including Broken Arrow, which runs its own ordinance.
Where the listings sit matters for the numbers, too, because BNBCalc's Tulsa market covers a region. A little over half its listings sit inside Tulsa's city limits, and the rest are spread across suburbs like Broken Arrow, smaller towns and rural areas out to Lake Eufaula, so check where the comps are before you treat a market figure as the city's.
Step 2: Build Each Side's Revenue
On the short-term side, revenue comes from comps, and once you've optimized the report with the comps you trust, its estimate is your baseline. You can also pick the set yourself with Select comps, or type a number you already have, like the house's booking history, into Manual revenue input.
On the long-term side, revenue is 12 months of rent, less vacancy. The card fills in the rent for you, using the high end of RentRange's range when there's no Zillow figure, so check it against the long-term comps and set the Monthly rent amount and Vacancy Rate (%) sliders to match. Vacancy starts at 5% and switches to local data where the card has it.
For example, $1,611 a month at 5% vacancy is $1,611 × 12 × 0.95 = $18,365 a year, and that's the long-term card's revenue line.
Step 3: Take Out the Costs Only One Side Pays
Most of the Airbnb's extra income goes to costs a lease doesn't have. Airbnb's service-fee page says most hosts on its single fee pay 15.5%, the Calculator's default, and after that come your cleaner, utilities you pay instead of a tenant, supplies, insurance and upkeep, plus, in Tulsa, the license in the Permits line.
The long-term side is much leaner. Its defaults take 1.5% of the rent for leasing, 3% for insurance and 3% for repairs, or 7.5% in all, and its Tenant pays all utilities switch starts on, so utilities stay at $0.
Your time is the biggest difference of all. Running an Airbnb yourself means guest messages, turnovers and reviews all year, while a tenant on a 12-month lease needs far less of you. Both sides start the manager's fee at 0%, so if you'd hire help, set the Property Management Fee under Management on each one.
Step 4: Put the Same Loan on Both and Compare Cash Flow
With each side's costs in, compare the Profit (Cash Flow) lines first, since that's the money you'd keep in year one.
Keep in mind that the two cards count your cash differently. For one, the short-term card adds closing costs and furnishing to the down payment, and its cash-on-cash return includes a year of revenue growth at the 3% Revenue Appreciation default. The long-term card, by contrast, divides by the down payment plus any long-term furnishing you enter, with no growth added. That's why I'd compare dollars before percentages, and our guide to calculating Airbnb ROI covers the short-term returns in full.
Furnishing is a real upfront difference, too. At the Calculator's defaults of $2,000 a bedroom, $250 a bathroom and $2,000 a living space, a three-bed, two-bath house needs about $8,500 before the first guest arrives, while the long-term card's furnishing starts at $0.
Step 5: Work Out the Break-Even Rent
The quickest way to see which side a house favors is its break-even rent, meaning the monthly rent at which the lease earns exactly what the Airbnb does on the same loan. The loan cancels out, so all you need is the Airbnb's operating income and what each dollar of rent keeps in a year.
At 5% vacancy and the 7.5% the long-term defaults take, each $1 of monthly rent is worth 12 × ($1 - $0.05 - $0.075) = $10.50 a year. So an Airbnb with $11,807 of operating income breaks even with a lease at $11,807 ÷ $10.50 = $1,124 a month.
Above that, the lease wins on cash flow. Below it, the Airbnb does.
Is Airbnb or Renting More Profitable for a 3-Bedroom in Tulsa?
Now let's put one house through all five steps. Say you buy a typical Tulsa three-bedroom for an illustrative $231,438, and it earns $36,286 on Airbnb, what the typical listing (BNBCalc's average performance tier) earned over the 12 months to September 2026.
Since there's no specific address, I've typed that revenue into Manual revenue input and kept the Calculator's US defaults for every cost except cleaning, the license and the loan.
On the lease side, I've used $1,611 a month, HUD's fiscal 2027 fair market rent for a Tulsa-metro three-bedroom, in effect since October 1, 2026. HUD defines its fair market rents as estimates of the 40th-percentile gross rent for standard-quality units, which covers rent plus utilities, while the tenant in this example pays the utilities on top. That makes $1,611 a reference point rather than a quote for one house, which is exactly what the break-even rent is for.
The Inputs
| Input | Short Term Rental | Long Term Rental | Source |
|---|---|---|---|
| Purchase price | $231,438 | $231,438 | Illustrative |
| Revenue | $36,286 a year, cleaning included | $1,611 a month, 5% vacancy | BNBCalc typical listing; HUD rent (illustrative); default vacancy |
| Airbnb fee | 15.5% | None | Calculator default |
| Cleaning | $400 a month on average | None | Illustrative |
| Utilities | $440 a month | $0, tenant pays | Calculator defaults |
| Insurance, upkeep and supplies | $700 a month | 3% of rent each for insurance and repairs | Calculator defaults |
| License or leasing | $375 a year, Tulsa's license | 1.5% of rent | City of Tulsa; Calculator default |
| Lodging tax | 0%, Airbnb collects Tulsa's 5% from guests | None | Airbnb's Oklahoma tax page |
| Loan and property tax | 25% down, 30-year fixed at 6.00%, 0.99% tax | Same | The Calculator's default rate, and 25% down is illustrative (Freddie Mac's survey average was 7.40% on October 15, 2026); default tax rate |
| Cash invested | Down payment, 3% closing, $8,500 furnishing | Down payment | How each card counts it |
Read each row across. Most of the short-term rows are costs the lease doesn't carry at all, while the loan row is identical on both sides, and that's what lets you compare the bottom lines.
The Results
| Line | Short Term Rental | Long Term Rental |
|---|---|---|
| Revenue | $36,286 | $18,365 |
| Operating expenses | -$24,479 | -$1,450 |
| Operating income | $11,807 | $16,915 |
| Mortgage & Taxes | -$14,779 | -$14,779 |
| Profit (Cash Flow) | -$2,972 | $2,136 |
| Cash Investment | $73,303 | $57,860 |
| Cash on Cash | -2.6% | 3.7% |
On the short-term side, operating expenses are the $5,624 fee, $4,800 of cleaning, $13,680 of utilities, insurance, upkeep and supplies, and the $375 license. The lease's are a $290 leasing fee plus $580 each for insurance and repairs, and both sides then pay $12,488 of loan payments ($1,040.69 a month on $173,578) plus $2,291 of property tax, the $14,779 of Mortgage & Taxes in the table.
So where does the gap come from? The Airbnb grosses about twice what the lease does, yet it keeps only $32.54 of every $100 before the loan, while the lease keeps $92.10. After the same loan, the lease is $5,108 a year ahead, and its cash-on-cash return beats the Airbnb's even with $1,089 of revenue growth added to the Airbnb's side.
The break-even rent backs that up. It's $1,124 a month, about 30% below HUD's figure, so the lease stays ahead even if the house rents for well under $1,611.
When Does Airbnb Beat Renting?
Flip the question around, and the Airbnb's bar is its break-even revenue, the gross at which its cash flow matches the lease's $2,136. Since the Calculator scales cleaning and Airbnb's fee with revenue, that's $43,454 a year, about 20% more than the typical Tulsa three-bedroom earned.
That bar is within reach for a strong listing. Tulsa's top-performing three-bedrooms averaged $65,691 over the same 12 months, and at that revenue the same house and loan would leave about $17,985 of cash flow, more than eight times what the lease keeps.
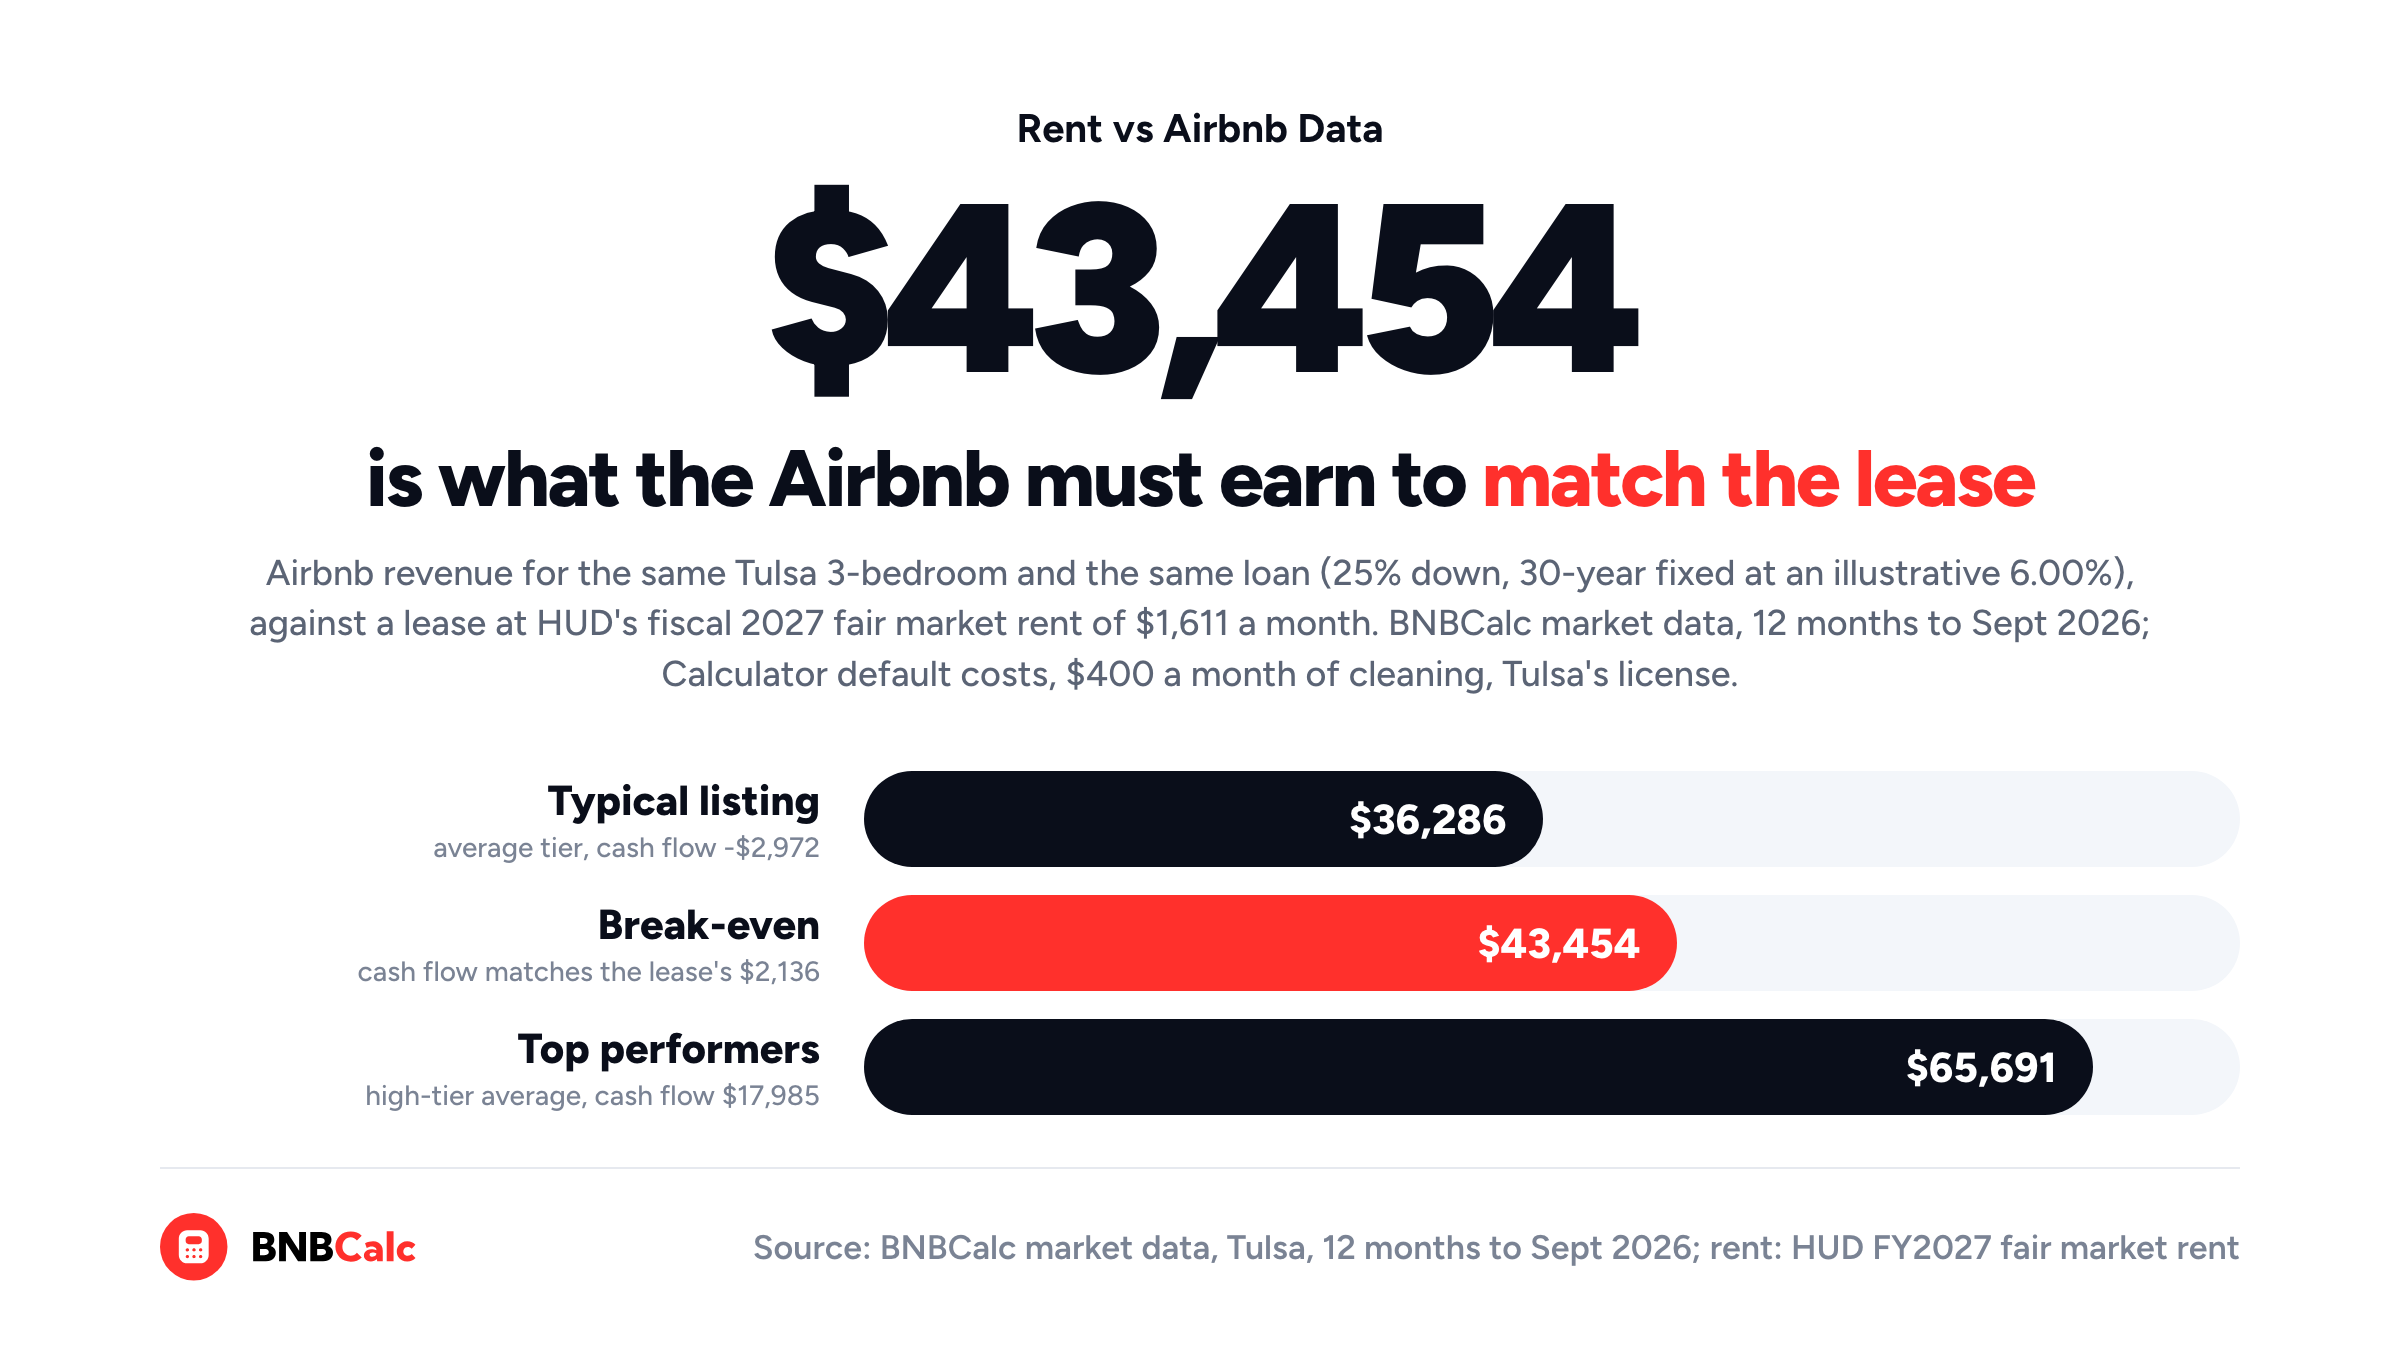
In other words, the real question is whether this house can out-earn a typical listing. To answer it before you buy, set a market's Rev. Performance filter to High in BNBCalc Markets and open a few detail panels to see what the top performers have in common.
Then check Amenity revenue impact. It estimates how much more listings with a given amenity earn, comparing similar listings, and Tulsa's all-bedroom view, the one anyone can see on the market page, puts a pool at +24%.
Fewer than one in ten Tulsa three-bedrooms in BNBCalc's listing data has a pool, too, so one would still set a house apart there.
How Taxes Differ When You Rent vs Airbnb
Both views include a US tax estimate built from mortgage interest, property tax and depreciation. The long-term one uses standard depreciation only, whereas the short-term one adds a bonus-depreciation estimate that assumes the house qualifies for short-term rental treatment, so confirm that with a CPA.
If you'd deduct short-term rental losses against your W-2 income, the IRS requires you to materially participate in running the property, and BNBCalc's Hours tracker keeps that record. Our guide to material participation rules explains the tests.
So, Is It Better to Rent or Airbnb Your Property?
It comes down to what the house can earn as an Airbnb once its costs are out. In BNBCalc's data, a typical Tulsa three-bedroom grossed $36,286 over the 12 months to September 2026, about twice what a lease at HUD's fair market rent brings in. Yet on the same loan, the lease kept $5,108 more, and the Airbnb only pulls ahead above $43,454 a year.
For your own address, run it through the BNBCalc Calculator, check the Long Term Rental card's rent against its long-term comps, give both sides the same loan, and compare the cash flow lines.
Gross income tells you who collects more, and it says very little about who keeps more. Whenever you weigh two ways to use the same asset, hold the financing fixed first, because the line that's identical on both sides is the one that makes the rest comparable.
Frequently Asked Questions
Is There a Rent vs Airbnb Calculator?
Yes. The BNBCalc Calculator shows a Short Term Rental card and a Long Term Rental card for the same address, so one analysis covers both. The long-term view builds revenue from rent and vacancy, with nearby long-term comparables on US homes, and both views share one loan, so their cash flow lines compare directly. You can run two property analyses free, or start a 7-day free trial with full access.
Is Airbnb More Profitable Than Renting?
Not always, and the BNBCalc Calculator shows why gross income isn't the test. In BNBCalc's data, a typical Tulsa three-bedroom grossed $36,286 on Airbnb over the 12 months to September 2026. Yet with the Calculator's default running costs, $400 a month of cleaning, Tulsa's license and 25% down at 6.00%, it lost $2,972 in year one, and any lease above $1,124 a month would've done better. A listing grossing over $43,454 would've beaten the lease instead.
How Do You Calculate the Break-Even Rent for an Airbnb?
In the BNBCalc Calculator, give both cards the same loan, then divide the Airbnb's operating income by what each dollar of monthly rent keeps in a year. At 5% vacancy and the Calculator's long-term defaults, which take 7.5% of rent, that's $10.50, so a typical Tulsa three-bedroom's $11,807 of Airbnb operating income breaks even with a lease at $1,124 a month.
Where Does BNBCalc's Long-Term Rent Estimate Come From?
For a US address, BNBCalc's Long Term Rental card shows up to two rent estimates, each labeled by its source, plus a local vacancy and rent-growth line and HUD's Section 8 rent for that bedroom count and ZIP code. The rent starts from the home's rent estimate, or the high end of RentRange's range when there's no Zillow figure, and the long-term comparables show what similar homes nearby are listed for, so you can set it to match.
BNBCalc Calculator Pricing and Free Analyses
When you've got a property you're deciding on, the BNBCalc Calculator costs $30 a month or $199 a year as of October 2026.
If you'd like to try it first, you can run two property analyses free, or start a 7-day free trial with full access.
And if you don't know where to invest yet, use BNBCalc Markets to compare US markets by gross yield and see what the individual listings in each one actually earned.
Airbnb Tax Deduction Calculator
Paying too much in taxes? We have the perfect solution. Simulate an Airbnb home purchase below.
Purchase Price
$450K
Structure Value
70%
Apply Trump's Tax Cut (Bonus Depreciation)
Depreciation
$117,695
Interest
$21,600
Tax
$6,750
Year 1 Deduction
$146,045
Want to claim this deduction? Get a free cost segregation benefit analysis from CSA Partners — no obligation.
Get Full Analysis