
Free instant analysis
Reveal Airbnb revenue for any address or city
How do you estimate occupancy for one specific property before you've even bought it? Well, you look at what comparable listings nearby booked on the nights their hosts left open. When I pulled BNBCalc's Cape Cod market data, the typical listing there booked 33.4% of those nights over the 12 months to September 2026, while top performers booked 40.1%.
That single number hides two things you'll want to know before you plan around it, though. Because it only counts open nights, it can sit well above the share of the year a house was booked, and it averages a year that ran from 18.2% in February to 67.2% in July.
I'll start with what the BNBCalc Calculator shows when you give it an address, including how it defines occupancy. Then I'll check that number by hand on Cape Cod, by season, bedroom count and performance tier, and finish with how to estimate a listing that hasn't launched yet.
How to Estimate Occupancy for a Property With the BNBCalc Calculator
The quickest way to estimate one house's occupancy is to give the BNBCalc Calculator its address or a Zillow link, along with its bedrooms, bathrooms and guest count. First, it pulls up to 50 comparable listings nearby and bases its estimate on them. For a US property, you can also run its AI Underwriter, which reviews each one's photos, layout and amenities against yours and keeps the closest matches, aiming for about five and never more than eight.
The revenue section then shows three headline numbers: annual revenue, the average daily rate and occupancy. That occupancy comes from the comps behind your estimate, and the Calculator counts it as the share of the year that's booked.
For comps from BNBCalc's own listing data, each one comes in on a full-year basis, built from its nightly rate and what it booked on the nights it was open, blended with nearby listings. In other words, the Calculator's occupancy is the share of a full year your house could book if it's open to guests every night. Its "How it's calculated" window says as much, describing the default estimate as one for a home "that's available year-round and well managed."
For a house you'll rent all year, that's the right baseline.
However, if you plan to block nights for your own stays, or close for part of the year, make sure to switch on Manual revenue input and type in the occupancy you expect. The daily rate stays put while the revenue recalculates, and so does everything built on it, from expenses to cash flow, so you can see what those blocked nights cost before you make an offer.
Further down the report, the Seasonality card draws your monthly break-even as a dashed line, which helps you plan the cash a slow stretch needs. To see which months actually run slow, check the market's Occupancy rate card in BNBCalc Markets, as I'll show below.
Still, an occupancy figure is only useful once you know which nights it's counting, so let's look at that next.
What Does an Airbnb Occupancy Rate Measure?
In BNBCalc Markets, an occupancy rate measures booked nights against the nights a host left open, so a night the host blocked never counts against a listing's occupancy. Airbnb's help page on performance data uses the same definition for hosts, "the number of nights booked divided by total nights available to be booked."
Counting only the open nights like that is a fair way to grade how well a listing sells the nights it offers. Yet it can't tell you how many nights it offers, and on Cape Cod, that's where occupancy and the share of the year a house was booked part ways.
When I pulled the three-bedroom homes from BNBCalc's Cape Cod listing data, the medians were 178 nights open to book over the 12 months to September 2026, 187 days blocked by the host, and 48% of the open nights booked. Measured against the whole year, the median was only 24.9%, which I've worked out as booked nights divided by 365. Just over half of those three-bedrooms were blocked for 180 days or more.
These are medians across individual listings, though, each over its own past 12 months, so they won't line up with the market-wide occupancy figures BNBCalc Markets shows for Cape Cod, which average 12 monthly values instead.
Take one of those three-bedrooms, a two-bath Airbnb that sleeps six. In BNBCalc Markets, its detail panel shows 50% occupancy of available nights, since guests booked an estimated 93 of the 185 nights it was open. However, its host blocked the other 180 nights, so it was booked for 25.5% of the year, about one night in four.
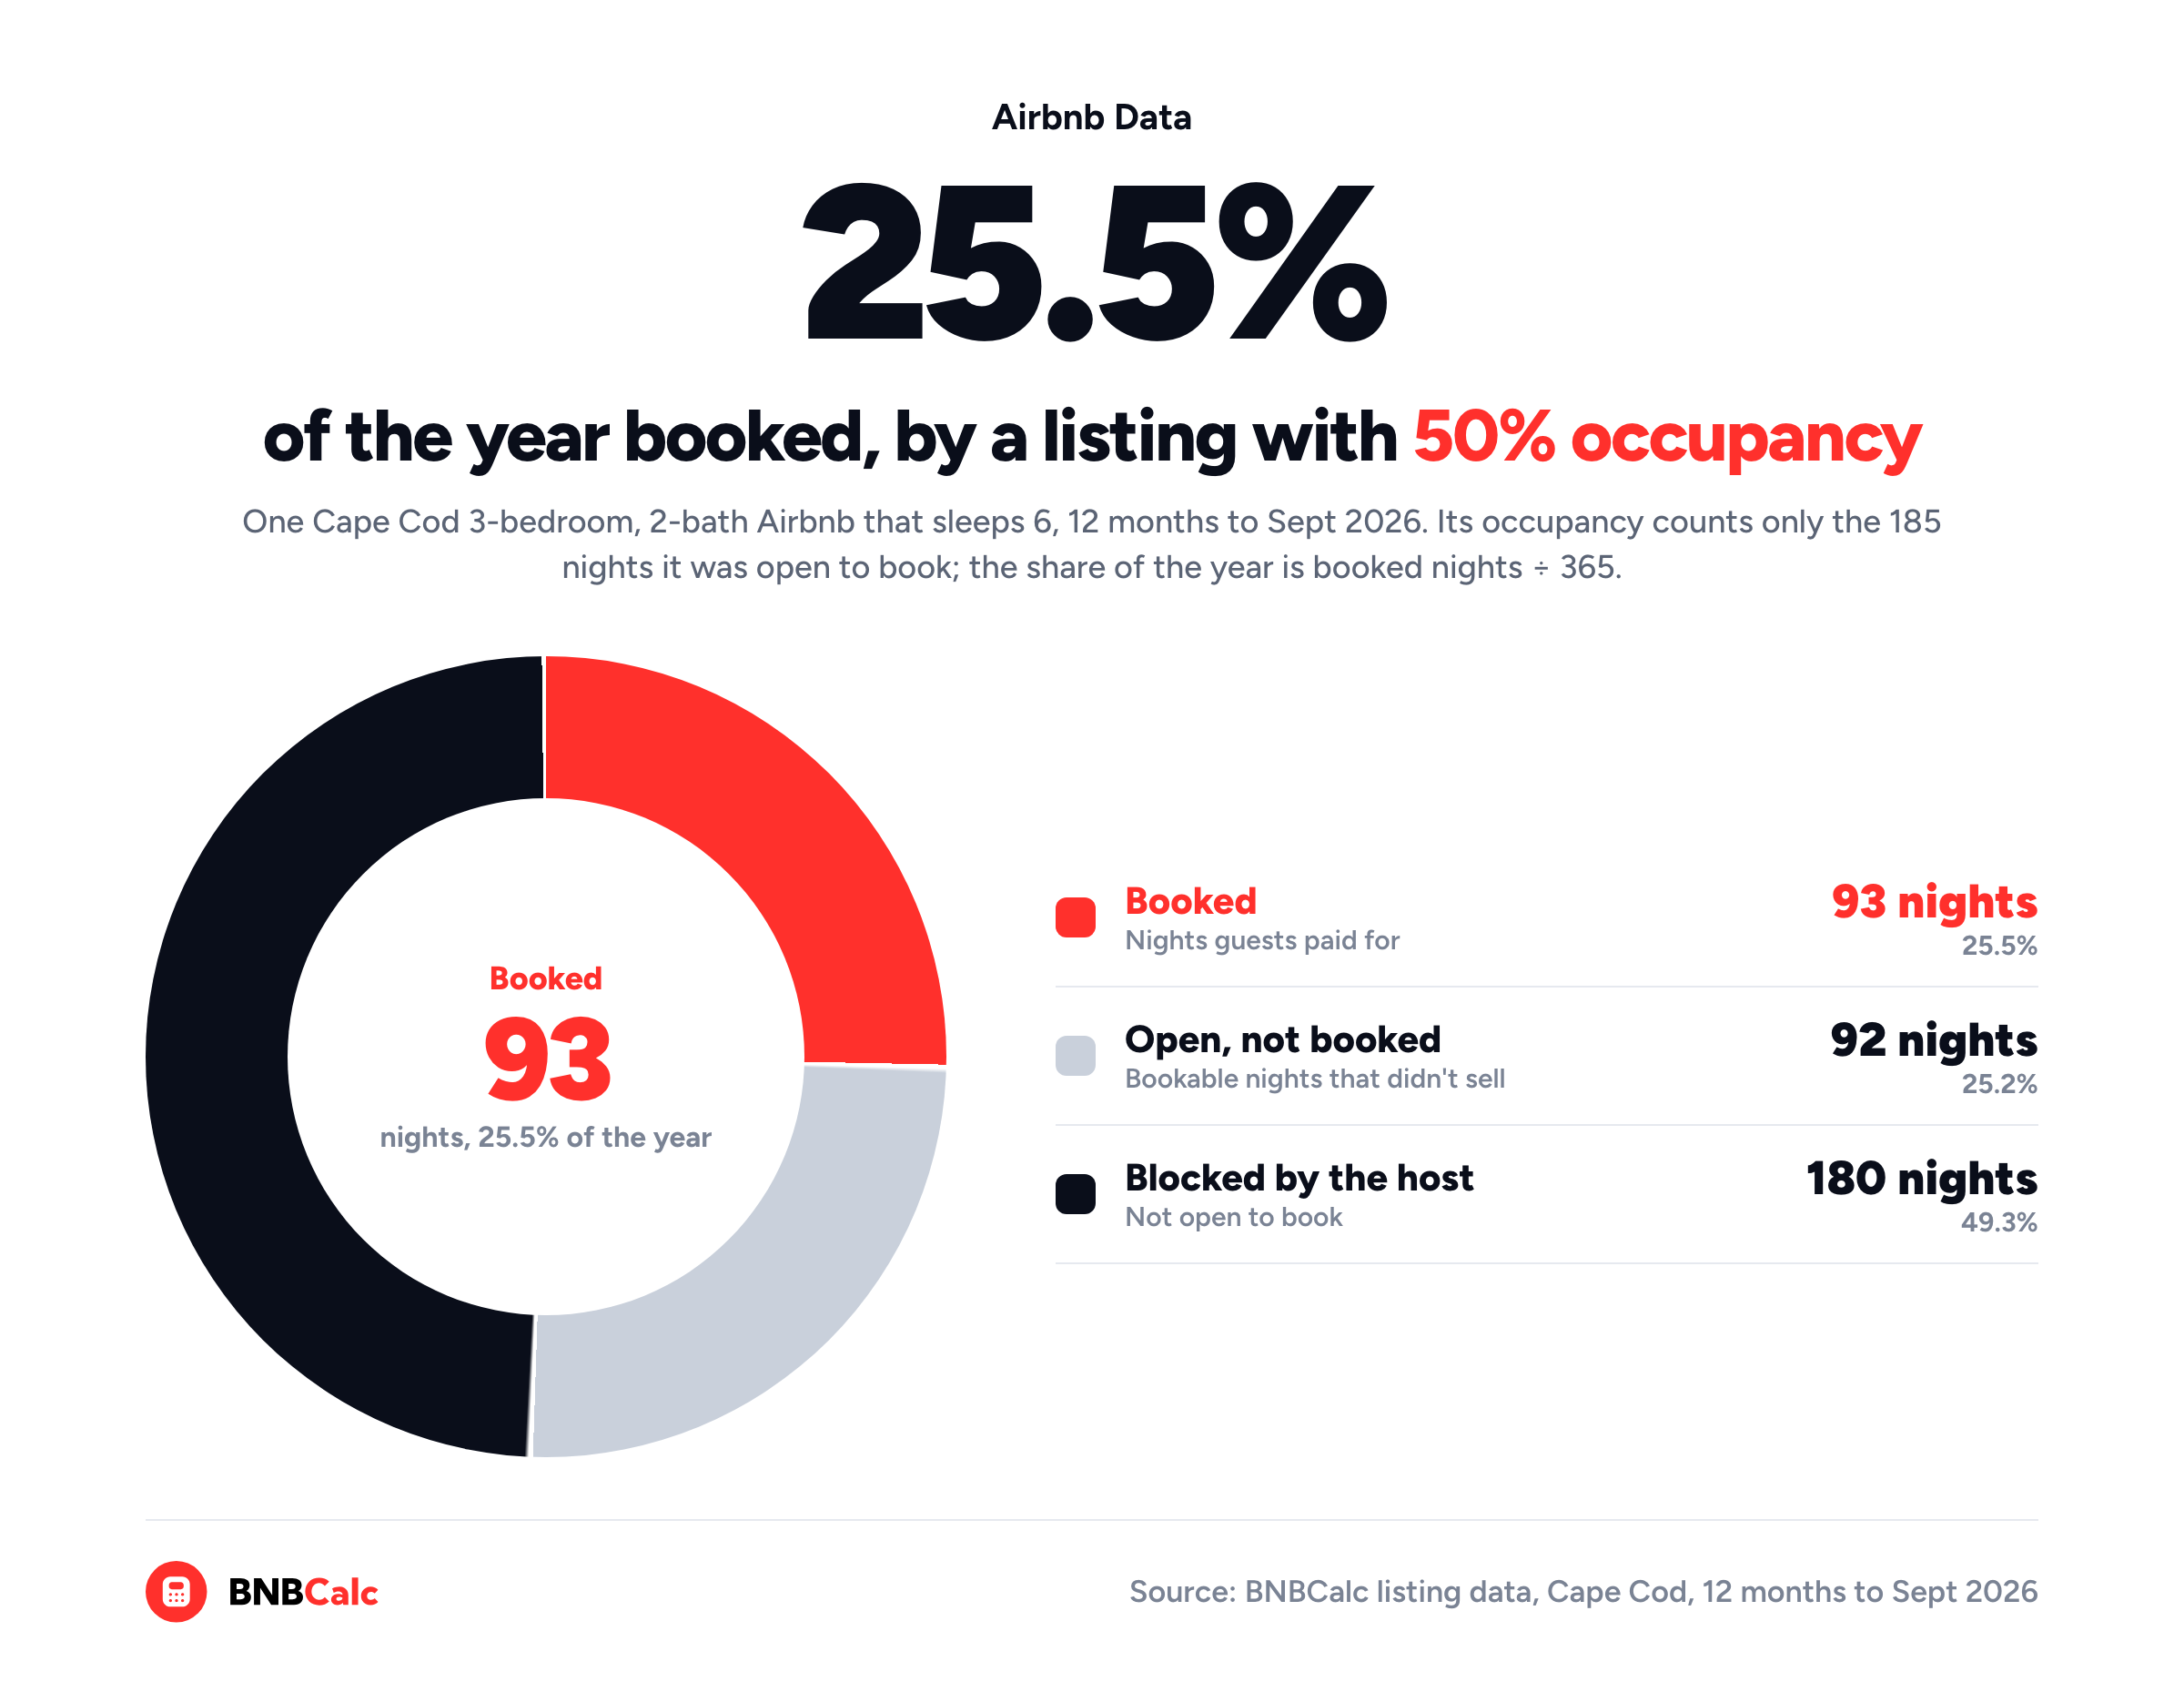
A blocked night could be the owner's own stay or a booking taken somewhere else, and the data can't say which, so I'd treat a heavily blocked listing as weak evidence. I walked through how to tell booked nights from blocked ones in our guide to running Airbnb comps. In BNBCalc Markets, each listing's detail panel shows its occupancy of available nights alongside the days its host blocked, both under Past 12 months.
Which one matters for your own estimate, then? Both of them. Occupancy tells you how well the open nights sell, while the nights you leave open decide how many can be booked at all, so you'll want to settle both before you trust a revenue figure.
Let's take a quick break for the tax side of blocked nights, in case some of yours will be your own vacations.
The 2025 edition of IRS Publication 527 says you use a rental as a home once your personal use runs past 14 days or "10% of the total days it is rented to others at a fair rental price," whichever is greater. When that happens and your rental expenses top your rental income, the publication says some or all of the excess "can't be used to offset income from other sources," so keep that in mind before you plan a long summer in the house yourself.
Ok. Back to the nights you'll book, because on Cape Cod some months book far better than others.
How Much Does Airbnb Occupancy Change by Season?
A lot, at least on Cape Cod.
BNBCalc Markets' Occupancy rate card charts it month by month for each market, and over the 12 months to September 2026, the typical Cape Cod listing booked between 18.2% and 21.6% of its open nights every month from November through March. Then it climbed to 45.9% in June and peaked at 67.2% in July and 66.6% in August, before easing back to 41.2% in September.
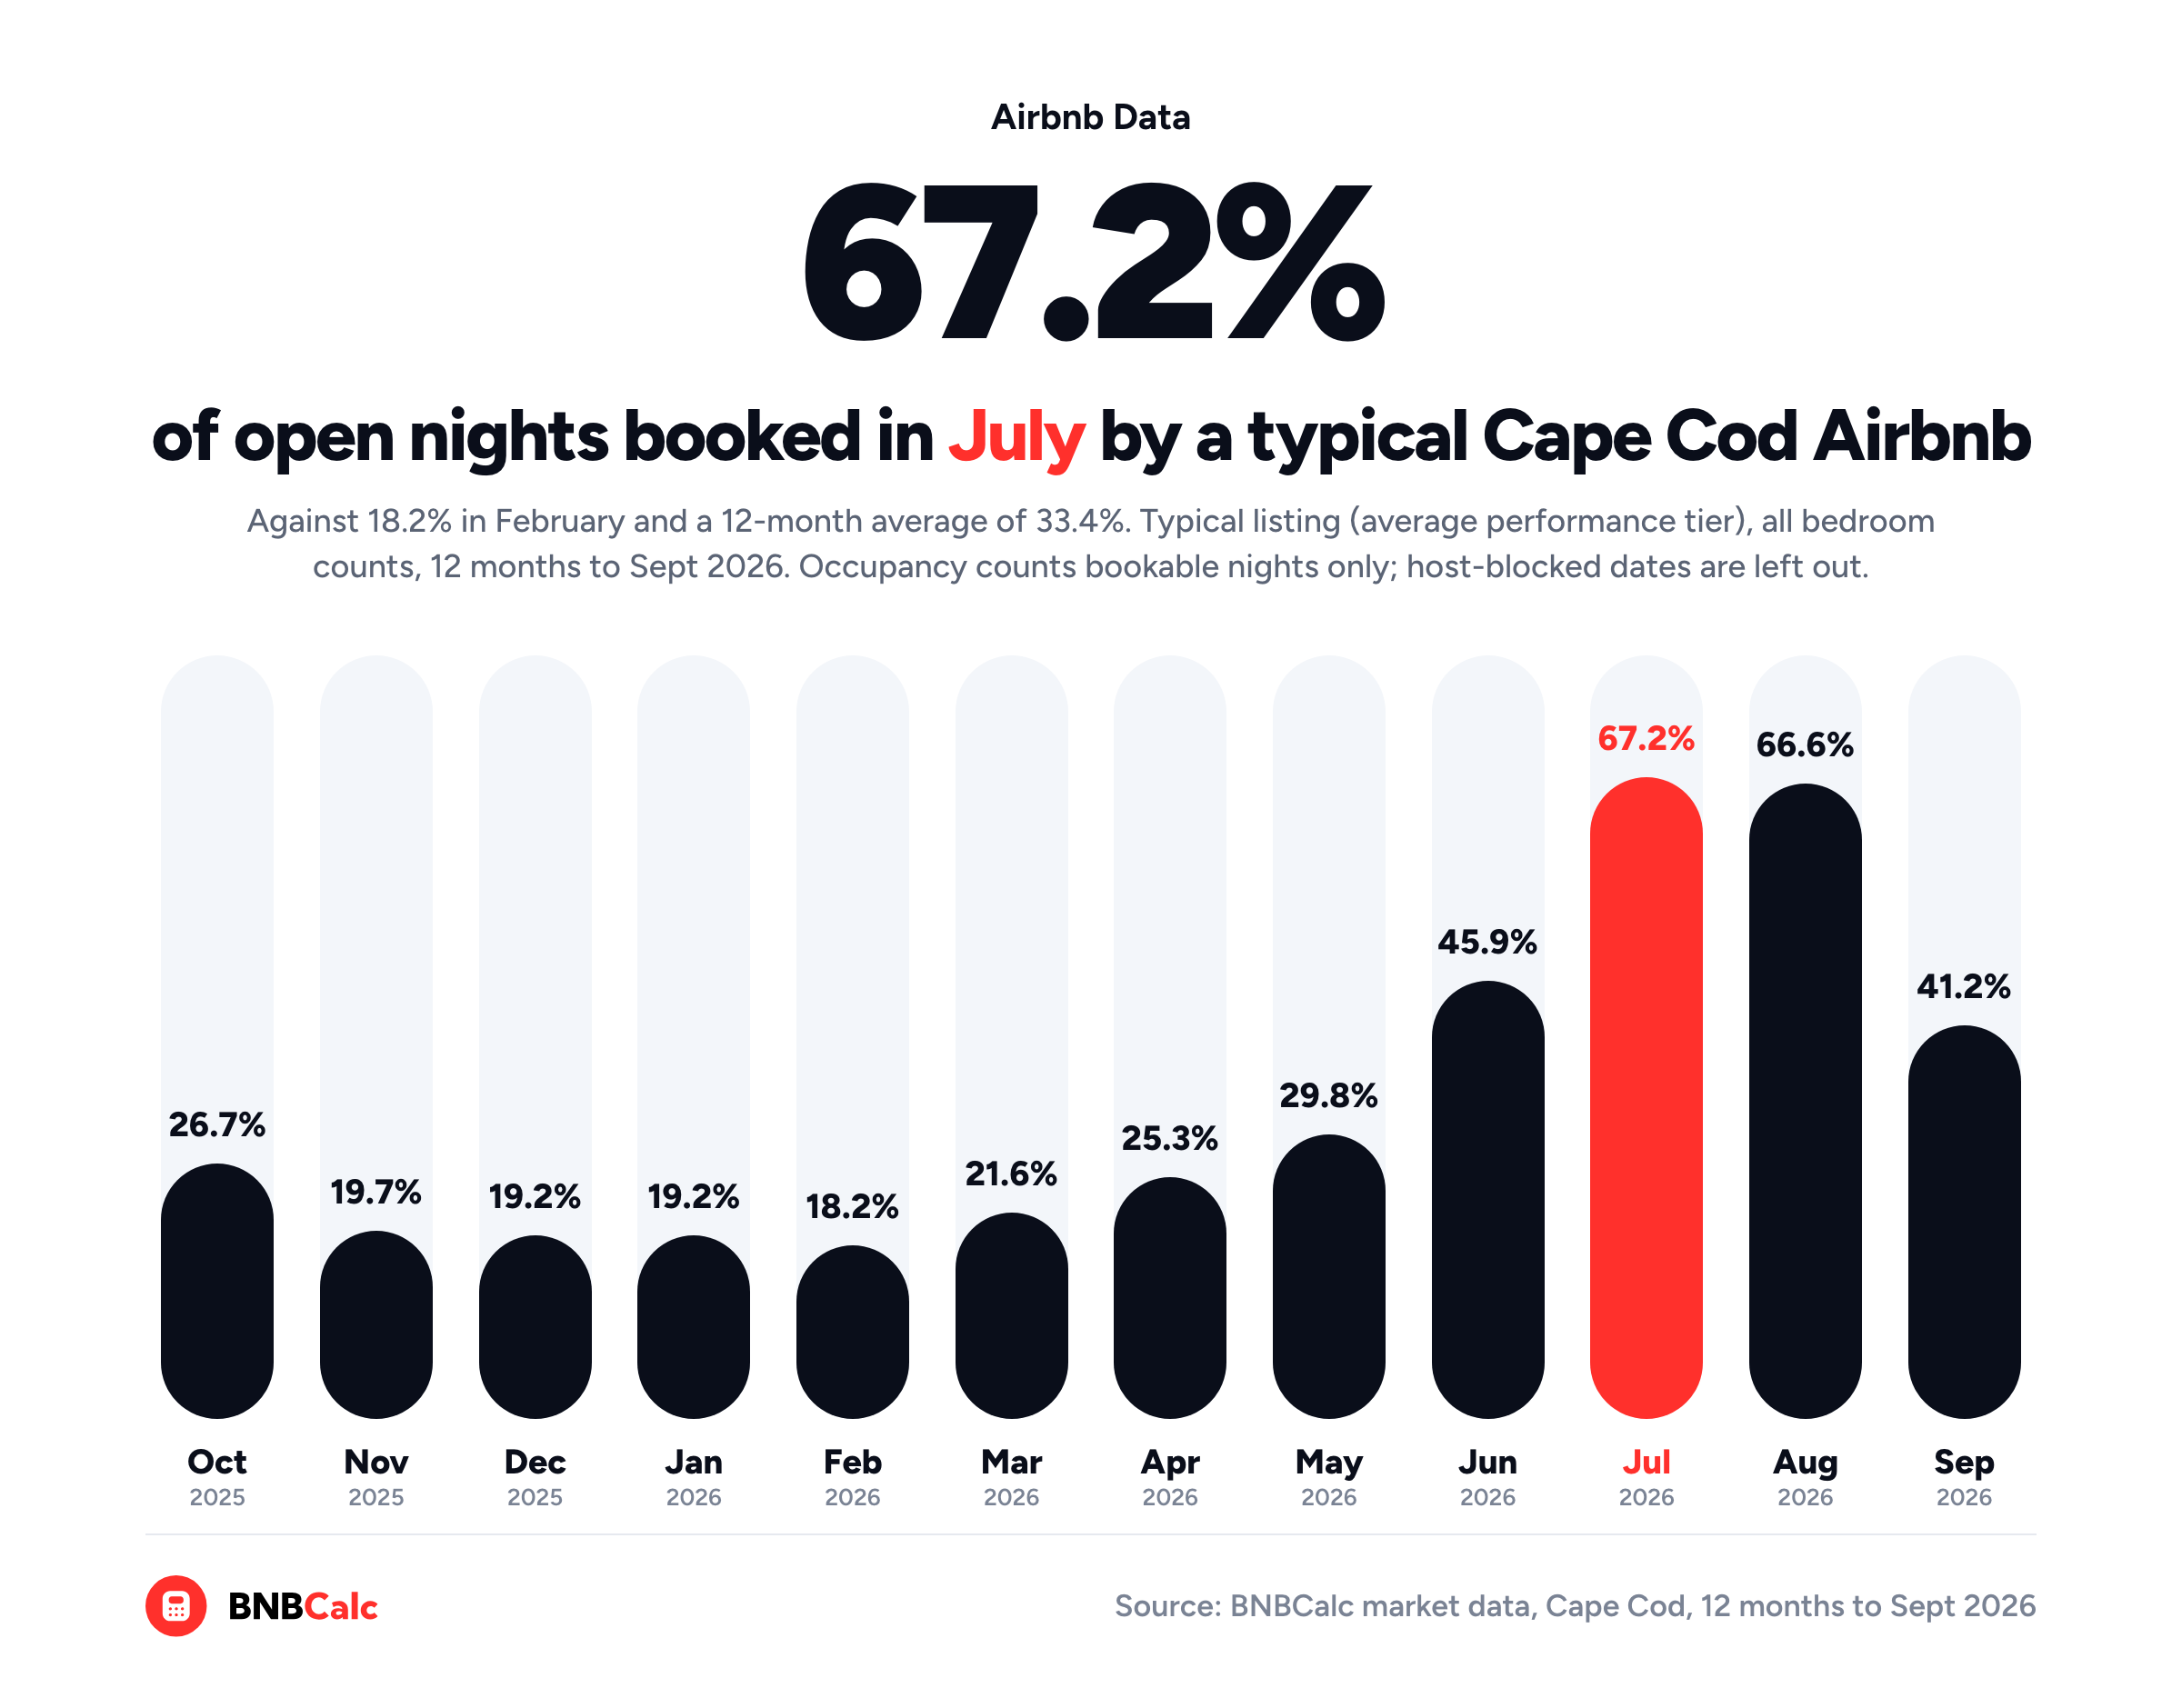
In other words, the 33.4% on the market's 12-month card averages two very different seasons together: a July and August that booked about two open nights in three, and a November-to-March stretch that booked about one in five.
A swing that wide is why which nights you block matters as much as how many you block. At the typical listing's July occupancy, a week left open would book about 4.7 nights (7 × 67.2%), while a week in February would book about 1.3 (7 × 18.2%).
If you plan to keep some weeks for yourself, take them from your market's slowest months, which on Cape Cod means the winter. Then switch on Manual revenue input in the Calculator and type in the occupancy you expect, so the analysis counts those weeks off.
Does Airbnb Occupancy Change With Bedroom Count?
Not by much on Cape Cod. When I split BNBCalc's Cape Cod market data by bedroom count, the typical listing at every size from one to four-plus bedrooms booked between 31.5% and 35.7% of its open nights over the 12 months to September 2026.
| Bedrooms | 12-month occupancy | February | July | Nightly rate |
|---|---|---|---|---|
| 1 | 33.3% | 18.8% | 62.5% | $269 |
| 2 | 35.7% | 20.9% | 67.9% | $370 |
| 3 | 34.6% | 18.6% | 69.8% | $511 |
| 4+ | 31.5% | 15.4% | 70.0% | $877 |
Source: BNBCalc market data, Cape Cod, typical listing (average performance tier) for each bedroom count, 12 months to September 2026. Nightly rates include cleaning fees.
Each row is one size, so reading down the 12-month column shows how little occupancy moves with bedroom count, while the nightly rate climbs from $269 for a one-bedroom to $877 for four or more. Even so, from one bedroom up, the bigger the home, the harder it swings through the year: homes with four or more bedrooms went from 15.4% of their open nights in February to 70.0% in July.
On Cape Cod, then, an extra bedroom mostly changes what each booked night pays rather than how many nights you'll book. Since that may not hold in every market, switch the All beds selector on the Marketwide Stats tab for the place you're looking at (it needs a Markets plan) before you assume a bigger house fills more nights.
What Occupancy Do Top-Performing Airbnbs Get?
On Cape Cod, occupancy varies far more with how well a listing performs than with how big it is.
BNBCalc sorts each market's listings into low, average and high performance tiers by revenue, and across all bedroom counts on Cape Cod, low performers booked 21.8% of their open nights over the 12 months to September 2026, the typical listing 33.4% and top performers 40.1%. All listings together averaged 26.8%, because that figure takes in the slow listings in the low tier too.
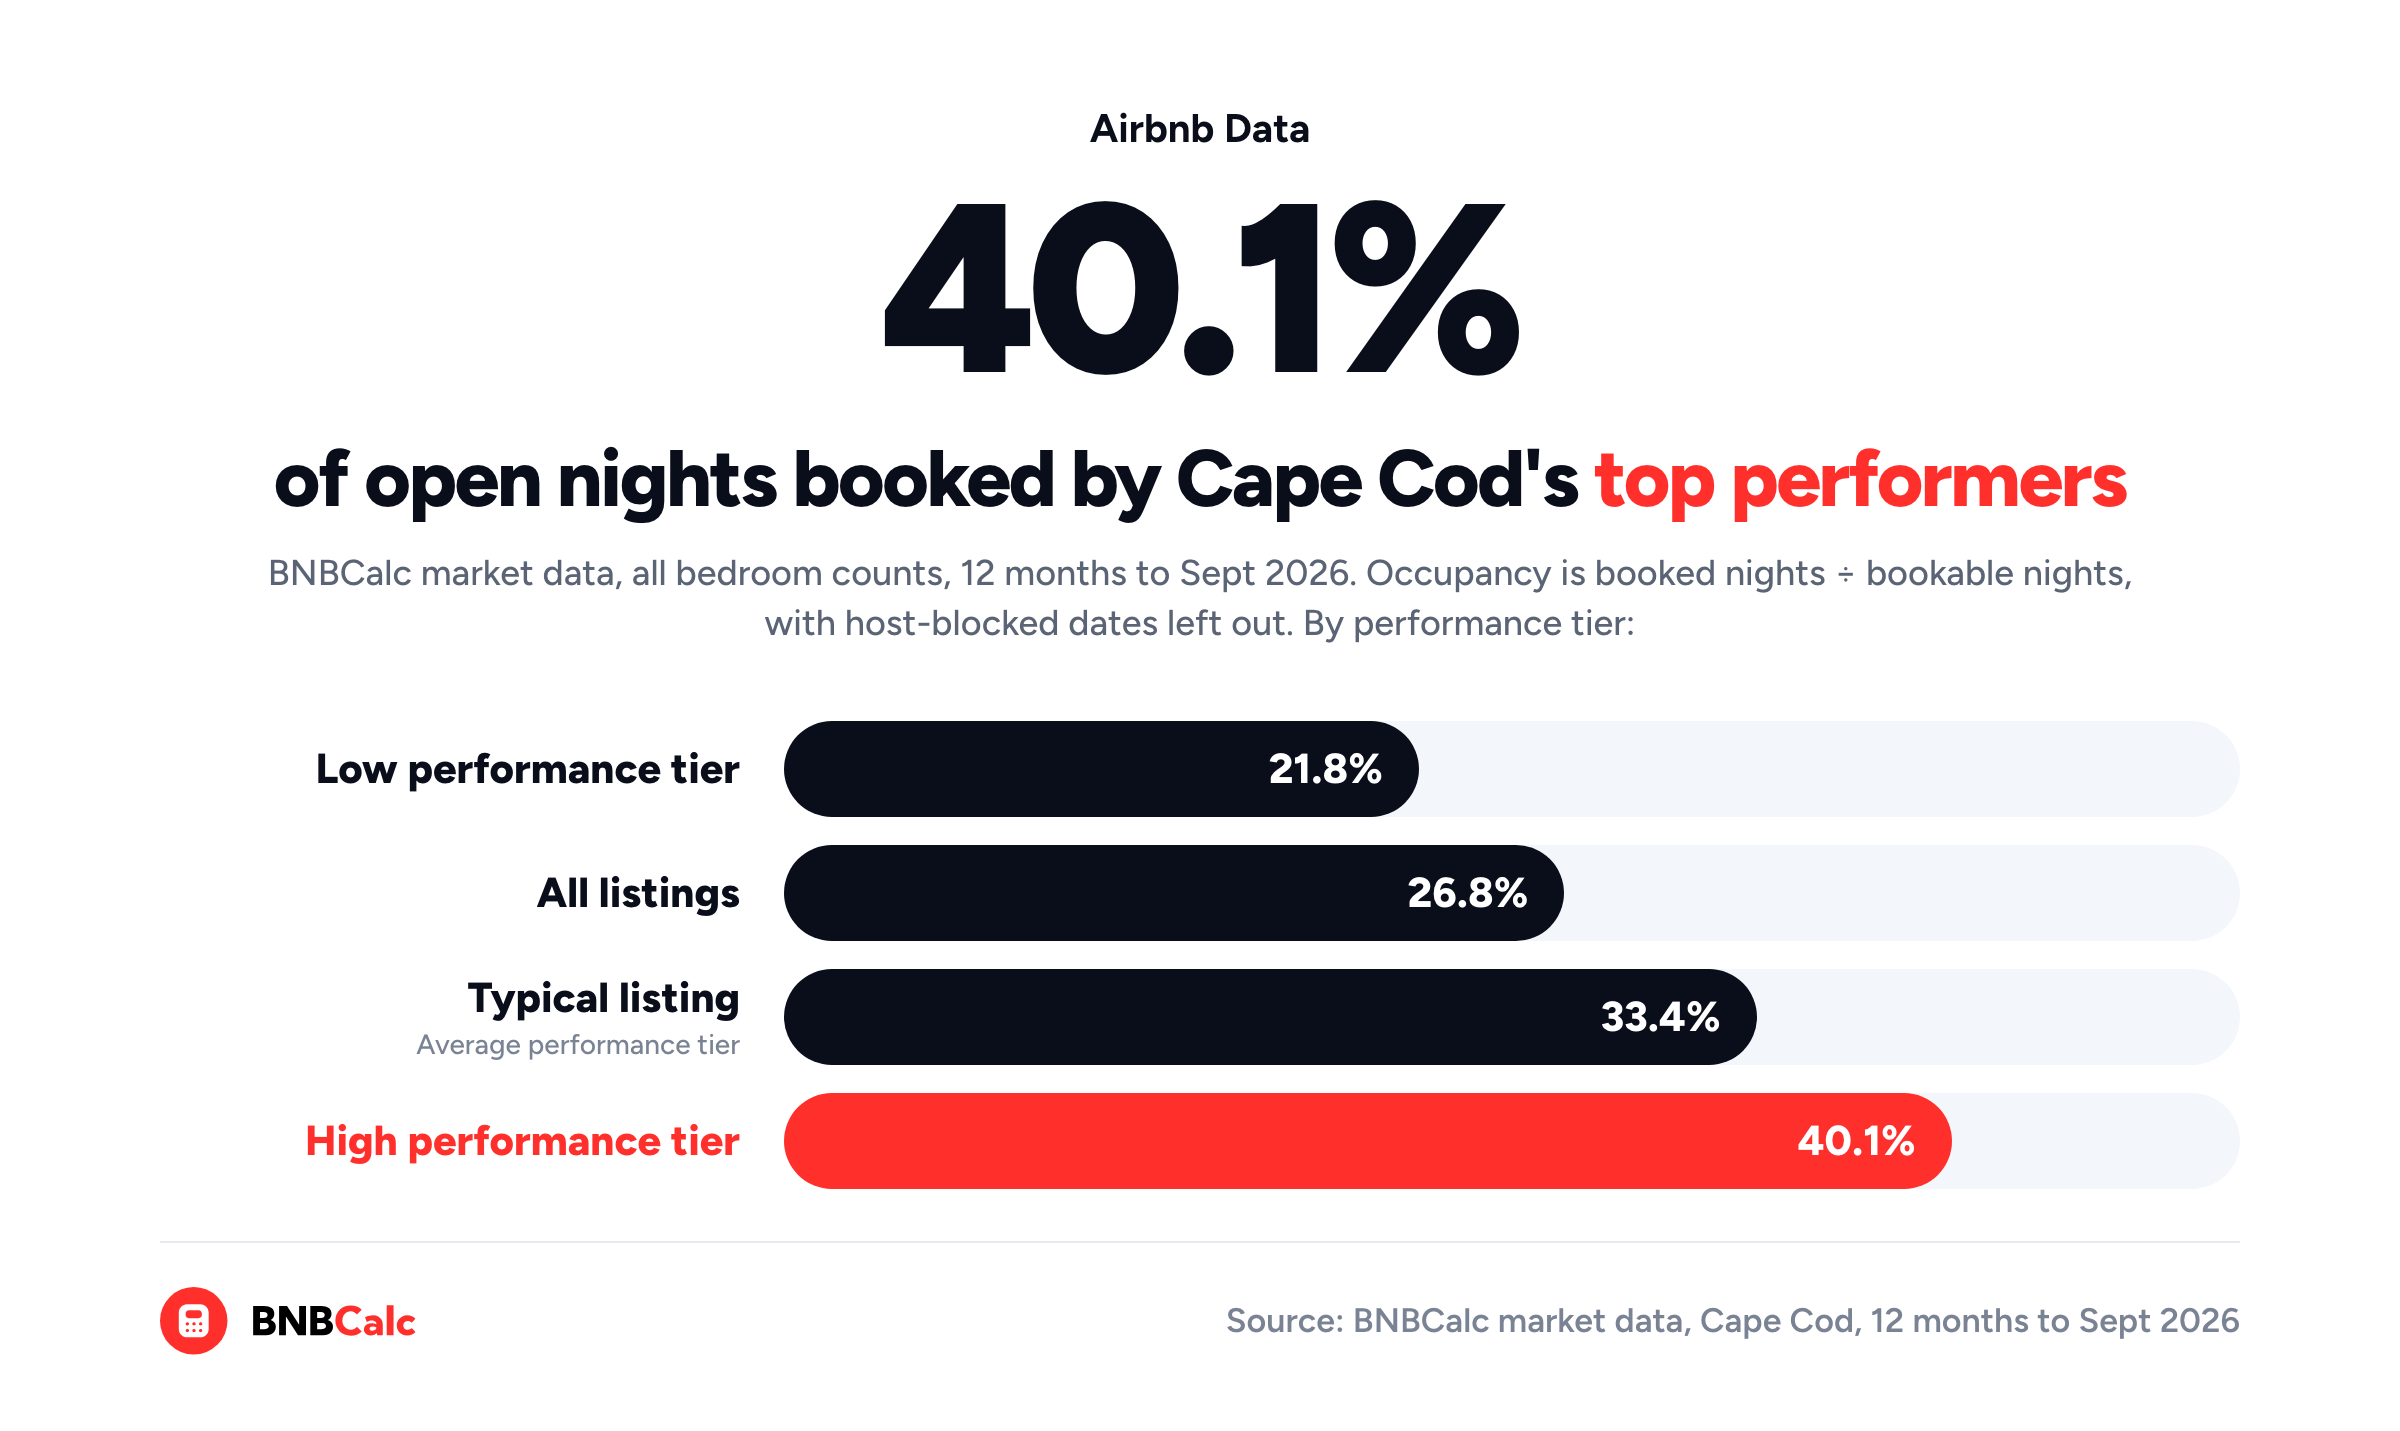
Top performers also charged more, $653 a night on average against $510 for the typical listing, so the gap between tiers shows up both in how many nights sell and in what each one sells for.
If you're sizing up a market before you have an address, the typical listing's occupancy is a fair target for a house you'll run well, and the top tier shows the headroom. To find some of it, BNBCalc Markets' Amenity revenue impact estimates how much more listings with a given amenity earn in that market, comparing similar listings, and the Calculator's amenity card shows the same kind of estimate for your bedroom count.
How Do You Estimate Occupancy for a New Airbnb Listing?
The same way you'd estimate any other house: from what comparable listings nearby booked, because a listing that hasn't launched yet has no booking record of its own. The BNBCalc Calculator works from the address and the comps around it, so it doesn't need one. What it can't tell you is how your own first months will go once you launch, so rather than guess, I'd check two things before you plan around its occupancy.
The first is what listings with a longer track record booked in your market. To find them, set BNBCalc Markets' Listing age filter to 1+ year or 2+ years, and if you have a Markets plan, open each one's detail panel to see its occupancy of available nights and how long it's been listed.
Then there's timing. If a Cape Cod house goes live in the fall, it opens straight into the slowest stretch of the year, so its first summer is the better part of a year away, and you'll want enough cash on hand to carry it until then.
To get those first bookings moving, Airbnb's new listing promotion lets you apply a 20% discount to your next three bookings. It's open to listings with fewer than three bookings, and only with Smart Pricing turned off, at least on the terms Airbnb showed in October 2026.
So, How Do You Estimate Airbnb Occupancy for a Specific Property?
You start from what comparable listings booked on the nights they were open, which on Cape Cod meant 33.4% for the typical listing and 40.1% for top performers over the 12 months to September 2026. Then you check what that number leaves out: how many nights your house will be open, which months those nights fall in, and where your listing is likely to land among its competition.
The BNBCalc Calculator does the first part from an address, and on a US property, you can run AI Underwriter to pick the closest comps. Once you've optimized the report, use its occupancy as your baseline, and if you'll block nights for yourself, type your own occupancy in to see what it does to your cash flow.
However you get there, an occupancy rate only tells you how well the open nights sold, while it's the nights you book that pay the bills, so make sure you count those too.
Frequently Asked Questions
How Do You Calculate Airbnb Occupancy Rate?
BNBCalc Markets calculates it as the share of bookable nights that guests booked, leaving host-blocked dates out. For example, a Cape Cod three-bedroom in BNBCalc's listing data that was open 185 nights and booked an estimated 93 of them shows 50% occupancy, while it was booked for only 25.5% of the year. The BNBCalc Calculator, meanwhile, shows occupancy as the share of a year your house could book if it's open to guests every night, built from comparable listings nearby.
What Is a Good Occupancy Rate for an Airbnb?
Compare it with the performance tiers in BNBCalc Markets for your own market and bedroom count, since a strong rate in one market can be a weak one in another. On Cape Cod, BNBCalc's data shows low performers booked 21.8% of their open nights over the 12 months to September 2026, the typical listing 33.4% and top performers 40.1%. Since tiers are ranked by revenue, make sure to read occupancy alongside the nightly rate.
Is There a Free Airbnb Occupancy Rate Calculator?
Yes. The BNBCalc Calculator lets you run two property analyses free, or start a 7-day free trial with full access. Give it an address and it pulls up to 50 comparable listings nearby, then shows the property's annual revenue, average daily rate and occupancy, and for a US property its AI Underwriter can narrow the comps to the closest matches.
Do Blocked Nights Lower Your Airbnb Occupancy Rate?
No. BNBCalc Markets leaves host-blocked dates out of occupancy, on its market stats and in each listing's detail panel, so blocking doesn't lower the rate, but it does cut the nights you can book. BNBCalc's Cape Cod listing data shows the median three-bedroom was blocked by its host for 187 days over the 12 months to September 2026, which left it booked for 24.9% of the year despite booking 48% of its open nights.
How Much Does Airbnb Occupancy Drop in the Off-Season?
It depends on the market, which is why BNBCalc Markets charts occupancy month by month for each one. On Cape Cod, BNBCalc's data shows the typical listing booked 67.2% of its open nights in July 2026 but 18.2% in February, and it stayed below 22% every month from November 2025 through March 2026.
BNBCalc Calculator Pricing and Free Analyses
When you've got a property in mind, the BNBCalc Calculator costs $30 a month or $199 a year as of October 2026.
If you'd like to try it first, you can run two property analyses free, or start a 7-day free trial with full access.
If you don't know where to invest yet, use BNBCalc Markets to compare US markets by gross yield and see how each one's occupancy moves month by month.
Airbnb Tax Deduction Calculator
Paying too much in taxes? We have the perfect solution. Simulate an Airbnb home purchase below.
Purchase Price
$450K
Structure Value
70%
Apply Trump's Tax Cut (Bonus Depreciation)
Depreciation
$117,695
Interest
$21,600
Tax
$6,750
Year 1 Deduction
$146,045
Want to claim this deduction? Get a free cost segregation benefit analysis from CSA Partners — no obligation.
Get Full Analysis