
Free instant analysis
Reveal Airbnb revenue for any address or city
How do you project an Airbnb's cash flow month by month, when the bookings come in waves but the mortgage doesn't? Well, you start from the year, then split it across the busy and slow months your market has. When I pulled BNBCalc's data for its Emerald Isle, North Carolina market, the typical three-bedroom grossed $55,656 over the 12 months to September 2026, yet it booked just 15.5% of its open nights in January, against 78.8% in July.
A swing that wide is why dividing the year by 12 can mislead you. With illustrative costs, a loan and my own split of the year, the example house I'll walk through clears about $424 in an average month. Each slow month, however, runs about $1,688 short, so the slow season alone leaves you roughly $8,400 down before summer pays it back.
I'll start with the year in the BNBCalc Calculator, build the months in five steps, then size the cash reserve for that Emerald Isle three-bedroom's slow season.
How to Project Airbnb Cash Flow Month by Month, Step by Step
Start with the BNBCalc Calculator, because it does the whole year for you.
Give it an address or a Zillow link, and it estimates revenue from comparable listings nearby, fills in your operating expenses, adds your loan payments and property tax as Mortgage & Taxes, and shows what's left as Profit (Cash Flow). And if you switch its Profit box from 1y to 1m, you'll see that year as an average month.
Its Seasonality card adds a planning view on top, since its Profit tab draws your break-even as a dashed line, meaning a month of operating expenses plus a month of Mortgage & Taxes, or what an average month costs you. The rest of this method is about which months land under that line, and how far.
Step 1: Start From the Year in the BNBCalc Calculator
Run the address first, because every month you build later has to add back up to this year. The Calculator's Estimate with AI button can also suggest property-specific costs, like insurance and utilities, with a source for each.
Once you've optimized the report, with the comps you trust and the house's bedrooms, bathrooms and guests filled in, use its annual figures as your baseline. If you already own the house, switch on Manual revenue input and type in its own booking history instead.
Step 2: Split Your Costs Into Fixed and Variable
Next, sort every cost by one question: does it move with bookings?
The Calculator already sorts them that way, since it sets Airbnb's fee, cleaning, any management fee and any lodging tax you pay yourself as a percentage of revenue, and everything else, the loan included, as a fixed monthly amount.
The variable costs fall in a slow month. Airbnb's single service fee takes 15.5% of each booking out of most hosts' payouts, and Airbnb is moving every home host onto it, so half the bookings means half the fee. Cleaning works the same way, because fewer stays mean fewer turnovers.
The fixed costs don't.
Your loan payment, property tax, insurance, utilities and upkeep come due every month, full calendar or empty. Where you know your heating or cooling bills climb, put the bigger number in those months.
Don't forget to check how your tax and insurance get paid. With an escrow account, the Consumer Financial Protection Bureau says you pay through your lender every month "instead of having to pay a big bill once or twice a year." If you pay them yourself, put each bill in the month it's due.
Step 3: Work Out the Bookings Each Month Needs to Break Even
With your costs split, break-even is one line of math. Divide the month's fixed costs by the share of each booked dollar you keep after the variable ones, and you've got the bookings that month needs to cover itself.
That figure isn't quite the Calculator's dashed line, which counts the fee and cleaning at an average month's level, so treat the line as the quick check and your own break-even as the month-by-month one.
For the other checks before an offer, like DSCR, see BNBCalc's guide to analyzing an Airbnb investment property.
Step 4: Find the Busy and Slow Months in BNBCalc Markets
So which months will land under your break-even? In BNBCalc Markets, open your market's Marketwide Stats tab and hover the solid line on the Occupancy rate and Avg daily rate cards to read each of the last 12 months. Occupancy there counts booked nights against the nights a host left open, and the rate is what guests paid per booked night, cleaning fees included.
In most markets, you can see both cards without a plan, though they're set to the typical listing across every bedroom count, so you'll want a Markets plan to switch them to your bedroom count or the top performers. Then sort the months into busy, shoulder and slow. Most of all, count how many slow months run back to back.
Step 5: Spread the Year Across the Months
Now give each month its share of the year. If you own the house, its booking history is the best guide. If you don't, pick a weight for each season, like twice an average month for the busy ones and well under one for the slow ones. Make sure the 12 weights add up to 12, so the months add back to the Calculator's year, and I'd be harsher on the slow months than feels comfortable.
Put each month's bookings in the month guests stay, too. For most stays of 27 nights or less, Airbnb starts your payout by the end of the business day after check-in, so a summer booking made in February pays you in summer.
Finally, subtract each month's variable and fixed costs from its bookings, then keep a running total from the month you close. Its lowest point is the cash you'll need.
What Does Month-by-Month Cash Flow Look Like for an Emerald Isle Airbnb?
Say you buy a typical three-bedroom in BNBCalc's Emerald Isle market for an illustrative $367,371. The $55,656 the typical three-bedroom grossed over the 12 months to September 2026 comes from BNBCalc's market data, cleaning fees included and before Airbnb's fee.
Keep in mind that a BNBCalc market is a named area with a boundary, so it reaches past the town. BNBCalc's listing data puts about a third of this market's listings in Emerald Isle's 28594 ZIP code and about three in ten in 28512, around Atlantic Beach and Pine Knoll Shores.
I've also assumed the house is legal to rent short term all year. In North Carolina, the real rules mostly sit in local zoning, so you'd check Emerald Isle's before a real purchase.
Everything else is illustrative. For the running costs, I've used the Calculator's defaults, $440 a month for utilities and $700 for insurance and upkeep, while cleaning averages $400 a month and property tax is its default 0.99% of the price. On a beach house, you'll want real insurance quotes, too.
As for the loan, it's 25% down on a 30-year fixed at the Calculator's default 6.00% rate, against Freddie Mac's survey average of 7.40% as of October 15, 2026. And since Airbnb collects North Carolina's local occupancy taxes from guests, they're left out.
| Line | Year one | How it's figured |
|---|---|---|
| Gross bookings | $55,656 | BNBCalc typical three-bedroom, 12 months to Sept 2026, cleaning included |
| Airbnb host fee | -$8,627 | 15.5% of gross bookings |
| Cleaning | -$4,800 | $400 a month on average (illustrative) |
| Running costs | -$13,680 | $1,140 a month at the Calculator's defaults (illustrative) |
| Operating income | $28,549 | Gross bookings minus the three lines above |
| Mortgage & Taxes | -$23,460 | $19,823 of loan payments ($1,651.93 a month on $275,528) + $3,637 property tax |
| Cash flow | $5,089 | Operating income minus Mortgage & Taxes |
Read the table top to bottom, the way the Calculator's Profit box does.
The house keeps $5,089 a year. That's about $424 a month on average, which looks steady until you split the costs.
The fixed ones come to $3,095 a month: $1,140 of running costs, a $1,651.93 loan payment and $303 of property tax. The variable ones take 24.12% of whatever you book, Airbnb's 15.5% plus cleaning at 8.62%, which is $400 in an average month of $4,638.
So you keep 75.88% of each month's bookings, and your break-even is $3,095 ÷ 0.7588 = $4,079. In other words, any month that books less than about 88% of an average month loses money.
BNBCalc Markets shows which months are most at risk. For Emerald Isle's typical three-bedroom (the bedroom view needs a Markets plan), June through August booked 55.1% to 78.8% of open nights at $415 to $480 a night, while November through March booked 15.5% to 27.5% at $202 to $263. April, May, September and October sat in between, at 34.7% to 45.8%.
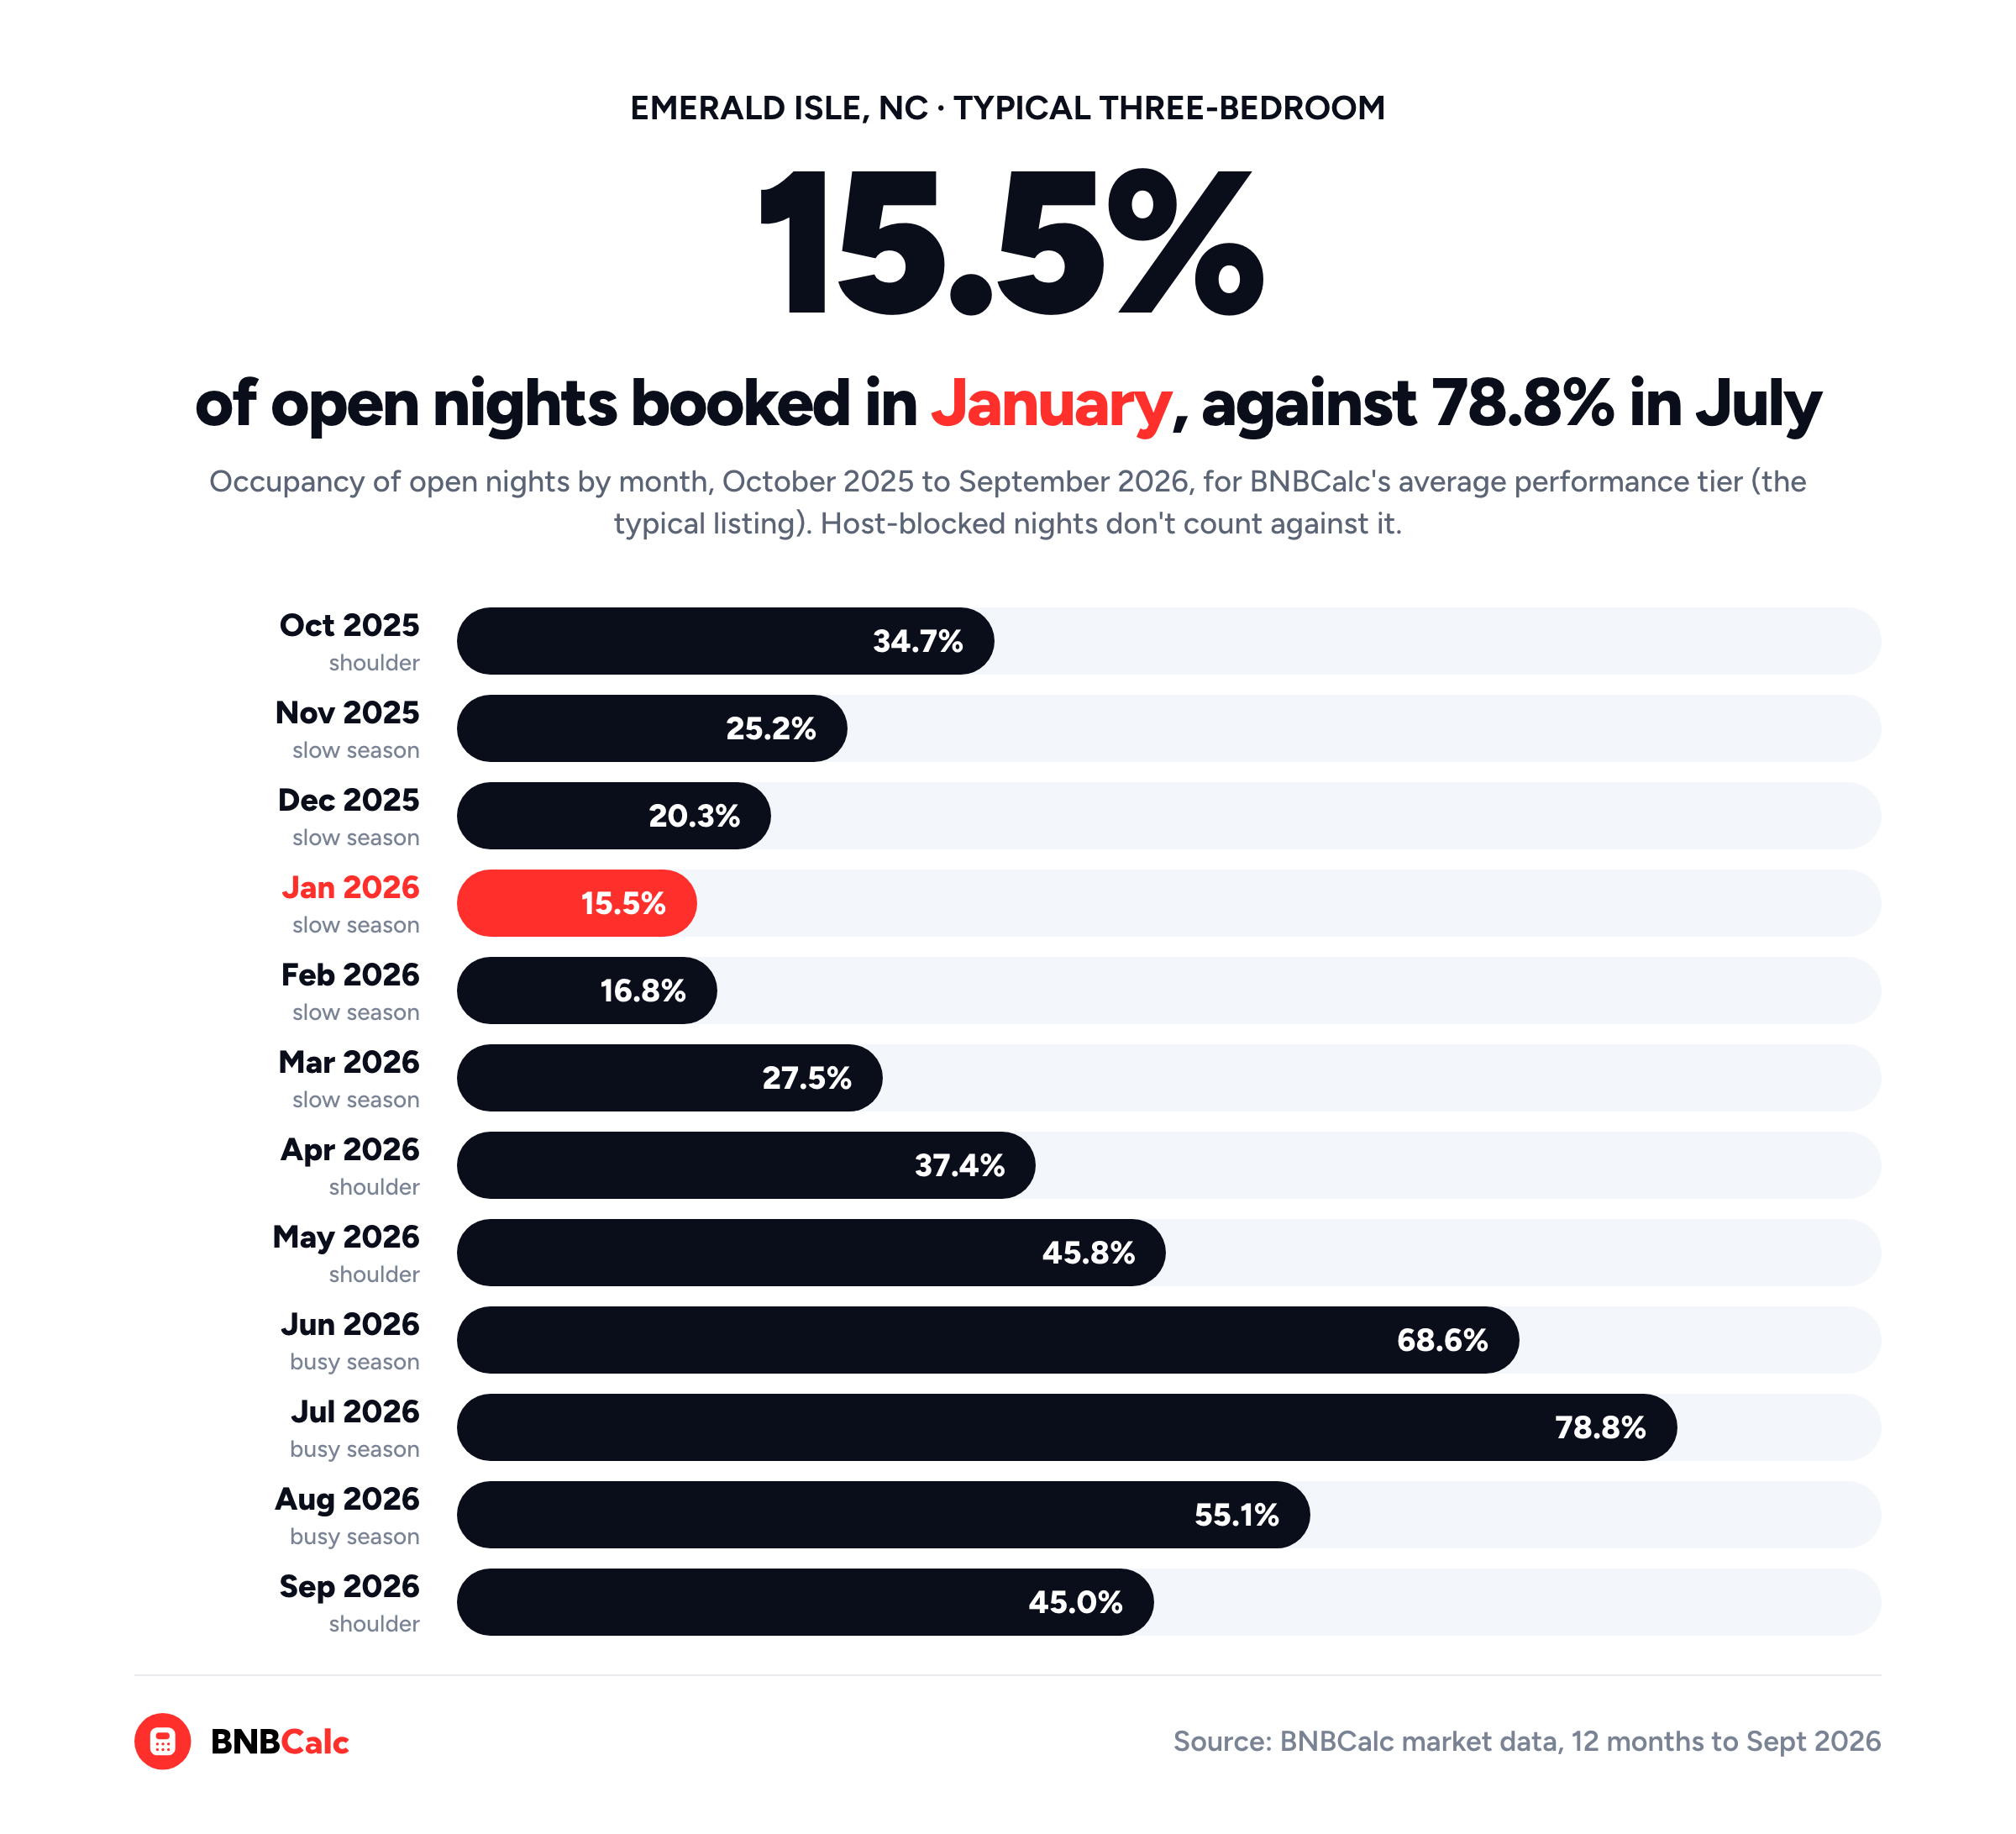
The cards tell you which months are slow, but how much each one books is your own estimate.
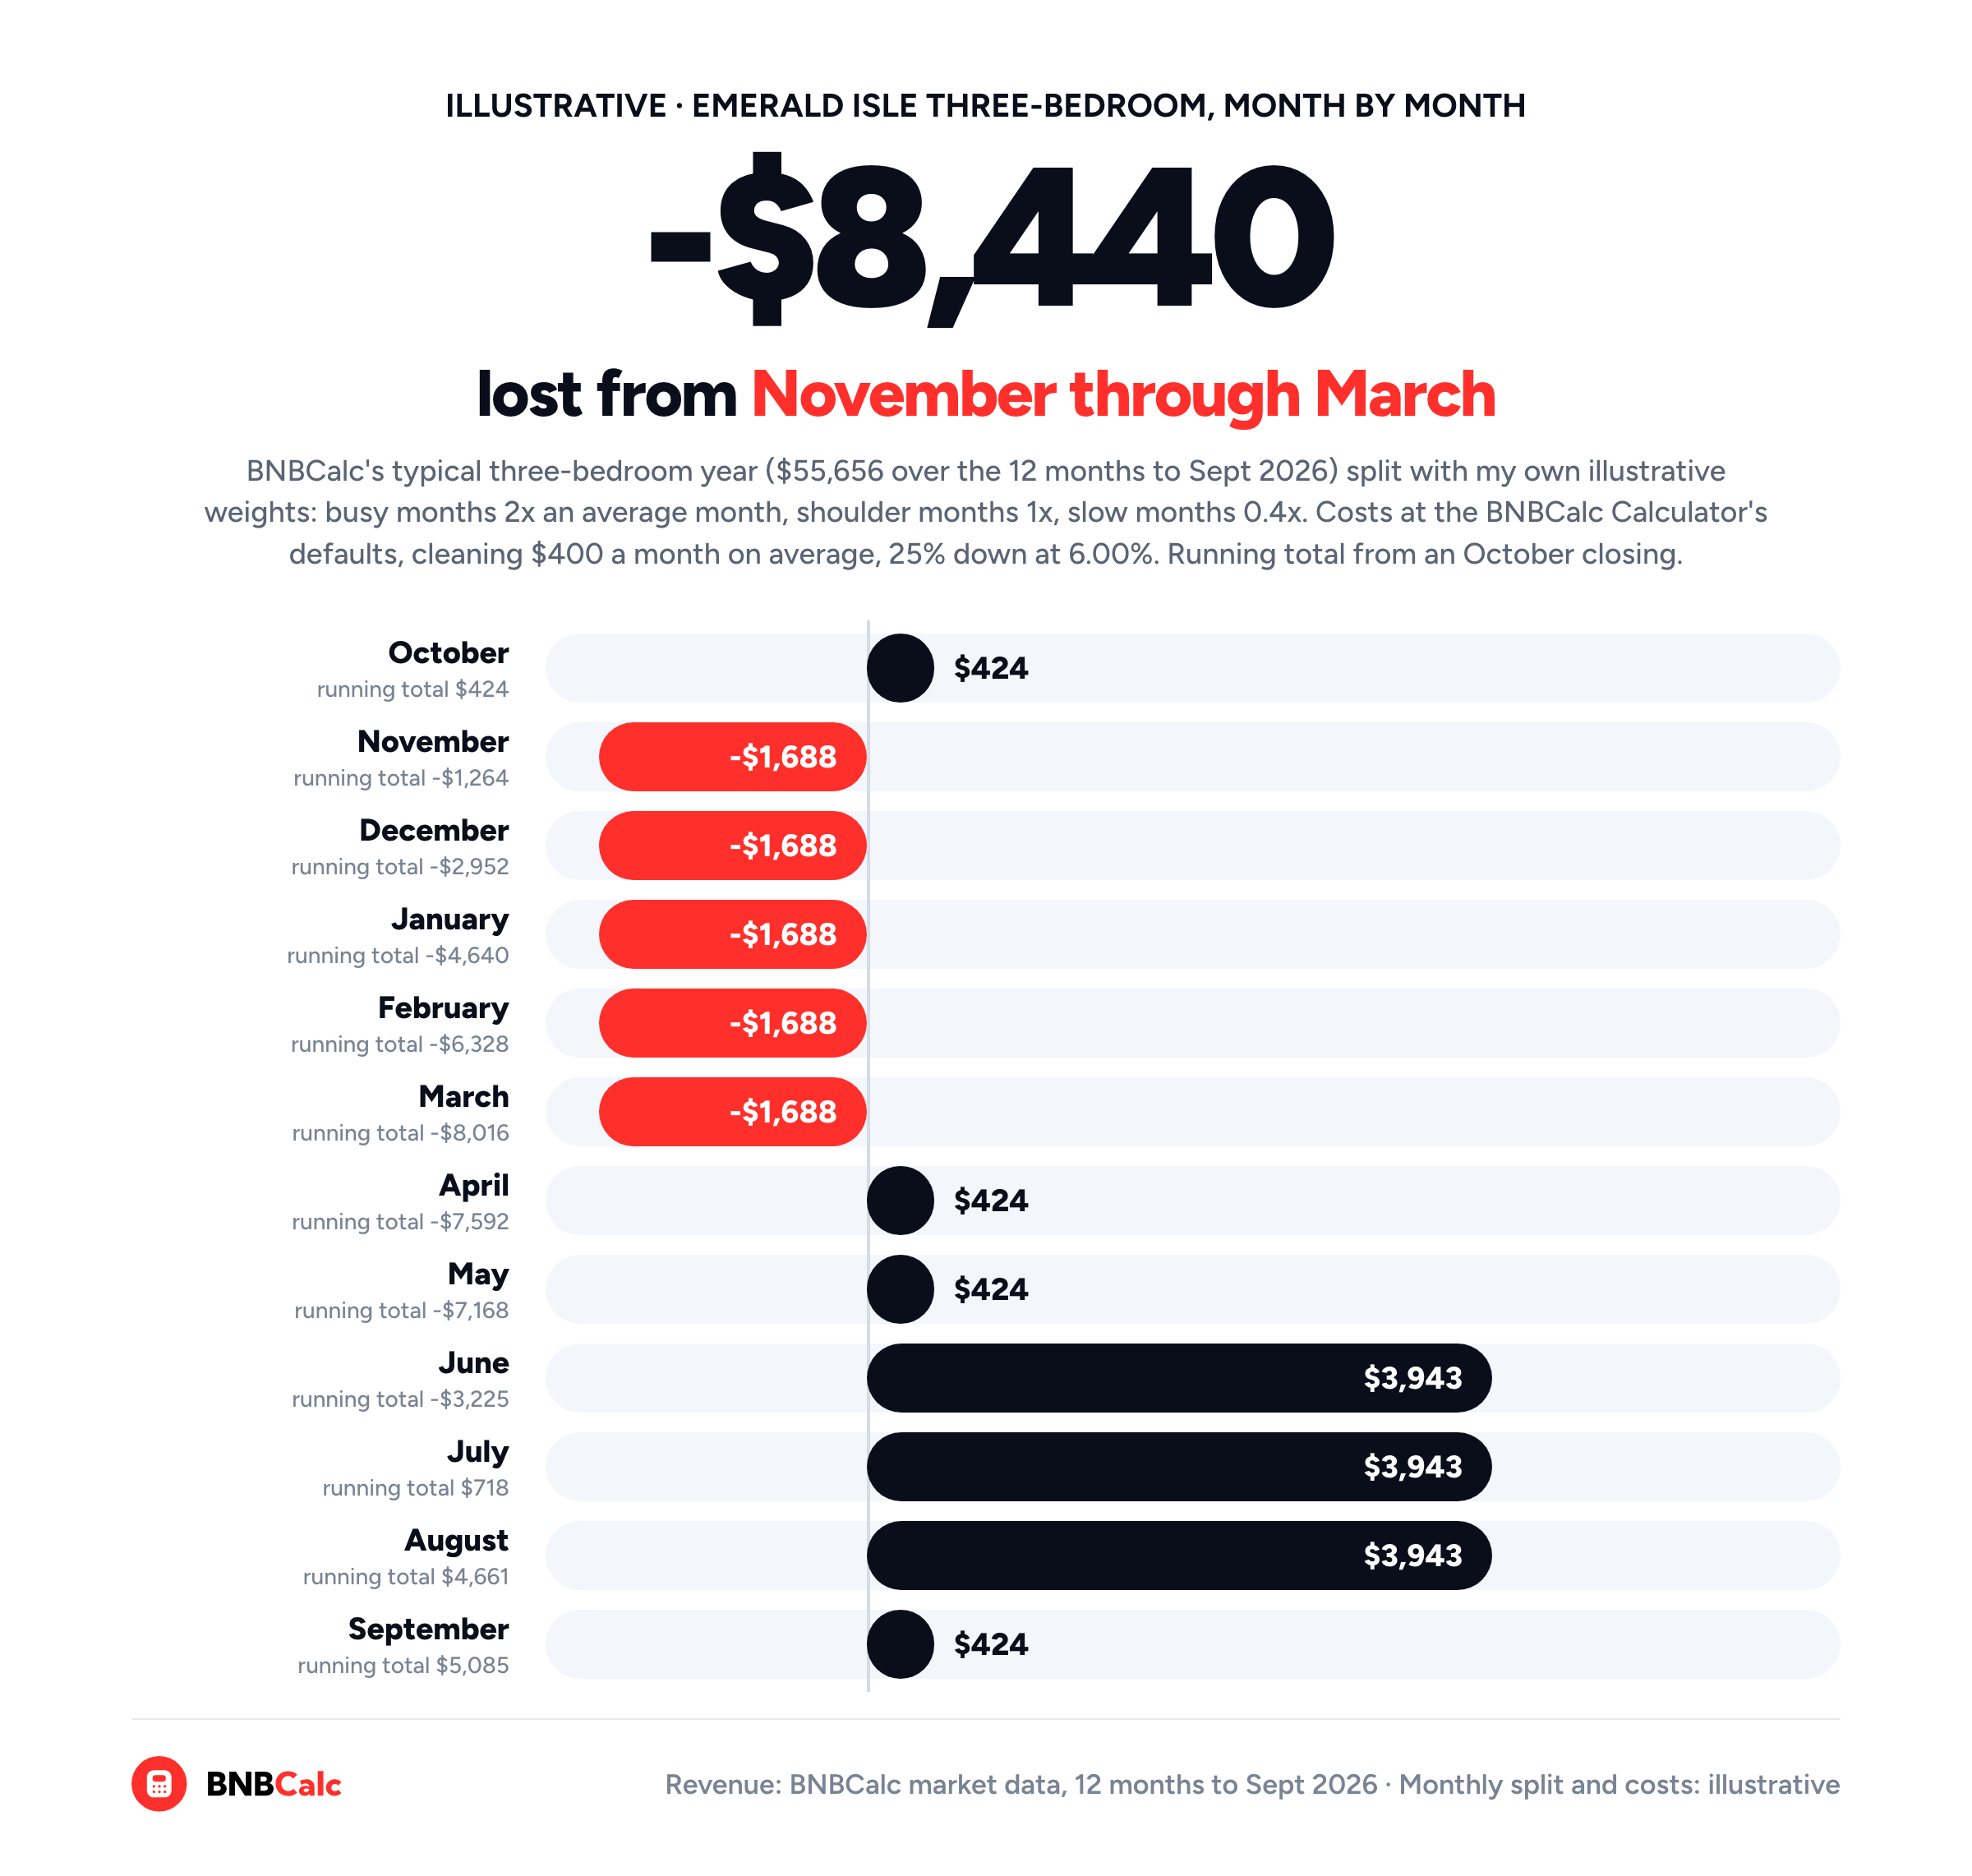
For this example, I've given the three busy months twice an average month's bookings, the four shoulder months one average month each and the five slow months 0.4 of one. Those weights are mine and illustrative, not BNBCalc data, and since 3 × 2 + 4 × 1 + 5 × 0.4 = 12, the months add back to the same year.
| Season (illustrative split) | Bookings a month | Airbnb fee | Cleaning | Fixed costs | Cash flow a month |
|---|---|---|---|---|---|
| Busy: June to August | $9,276 | -$1,438 | -$800 | -$3,095 | $3,943 |
| Shoulder: April, May, September, October | $4,638 | -$719 | -$400 | -$3,095 | $424 |
| Slow: November to March | $1,855 | -$288 | -$160 | -$3,095 | -$1,688 |
Each row is one month in that season. The shoulder months barely clear break-even, the five slow months lose $1,688 apiece, and the three summer months bring in $3,943 each. Those three months carry the year. Notice, too, that the fee and cleaning drop from $2,238 in a busy month to $448 in a slow one, yet the $3,095 doesn't move.
How Much Cash Reserve Does a Seasonal Airbnb Need?
Enough to reach the bottom of your running total. Say you close at the start of October. The first month clears $424, then the slow stretch takes $1,688 a month, so by the end of March you're $8,016 down, and the running total doesn't climb back above zero until July. By September, you're about $5,100 ahead, the year's cash flow.
Close at the start of November instead, and you walk straight into all five slow months: $1,688 × 5 = $8,440, or about 1.7 times what the house makes in a whole year.
The full $8,440 is the number I'd plan on, since you don't get to pick when a deal closes.
Then stress it. What if the slow months only book a quarter of an average month instead of 0.4? Each one loses $2,215, the slow stretch costs $11,075 and the year's cash flow drops to about $2,450.
So I'd size the reserve on the harsher case and add one month of fixed costs for the repair nobody planned: $11,075 + $3,095 = $14,170, or about $14,200. That's on top of the $111,364 you'd put in at closing for the down payment, 3% closing costs and $8,500 of furnishing at the Calculator's defaults (three bedrooms, two bathrooms and one living space).
The reserve, then, comes down to two things you can read before you buy: how many slow months run back to back, and how far below break-even each one lands.
How Can You Shrink an Airbnb's Slow-Season Losses?
The part you control most is how the listing handles the slow months, and BNBCalc Markets shows what the top performers do with them. If you set its performance selector to High and the bedrooms to 3, the Occupancy rate card shows Emerald Isle's top-performing three-bedrooms booked 24.4% of their open nights in February, against the typical three-bedroom's 16.8%.
So the slow months aren't a write-off, and with the fixed costs due anyway, every extra winter booking you win shrinks the hole. And if you plan to use the house yourself, take your weeks in the slow months, since a night you block in February gives up far less than one in July.
So, How Do You Project Airbnb Cash Flow Month by Month?
Start from the year in the BNBCalc Calculator, split your costs into those that move with bookings and those that don't, and divide the fixed ones by what you keep of each booked dollar. That's your monthly break-even. Then find the slow months in BNBCalc Markets and spread the year across them.
For a typical three-bedroom in BNBCalc's Emerald Isle market ($55,656 over the 12 months to September 2026), illustrative costs, a loan and my seasonal split left about $424 in an average month, five months under break-even and a reserve near $14,200. Your address will differ, so run it through the Calculator to see where its running total bottoms out.
Plenty of deals look fine as a year yet run dry in February. Know how deep your slowest stretch goes before you buy, and you can decide whether to carry it, price for it or walk away.
Frequently Asked Questions
Does the BNBCalc Calculator Show Airbnb Cash Flow by Month?
Yes. In the BNBCalc Calculator, the Profit box's 1m view shows your revenue, operating expenses, Mortgage & Taxes and cash flow for an average month, a twelfth of the year. Its Seasonality card adds a planning view, since the Profit tab draws your monthly break-even, a month of operating expenses plus a month of Mortgage & Taxes, as a dashed line. To find the slow months that may fall short of it, check the Occupancy rate card in BNBCalc Markets.
How Do You Calculate an Airbnb's Monthly Break-Even?
Start from the BNBCalc Calculator's costs, then divide your fixed monthly costs by the share of bookings you keep after the variable ones. For a typical three-bedroom in BNBCalc's Emerald Isle market, bought for $367,371 with 25% down at 6.00% (the price and costs are illustrative), $3,095 of fixed costs and 24.12% of variable costs give $3,095 ÷ 0.7588 = $4,079 of bookings a month.
How Much Cash Reserve Should an Airbnb Have?
Build the year in the BNBCalc Calculator, find the slow months in BNBCalc Markets, and hold enough to cover the lowest point of your month-by-month running total, plus a buffer. For the example three-bedroom in BNBCalc's Emerald Isle market, with an illustrative loan, costs and seasonal split, five slow months at $1,688 short come to $8,440, and a harsher winter takes that to $11,075. One month of fixed costs on top puts the reserve at about $14,200.
What Are the Slowest Months for an Airbnb in Emerald Isle?
November through March, according to BNBCalc Markets. Over the 12 months to September 2026, the typical three-bedroom in BNBCalc's Emerald Isle market booked 15.5% to 27.5% of its open nights in those months, with January the slowest, against 55.1% to 78.8% from June through August. Nightly rates ran from $202 to $263 in the slow months and $415 to $480 in the busy ones.
BNBCalc Calculator Pricing and Free Analyses
When you've got an address to run month by month, the BNBCalc Calculator costs $30 a month or $199 a year as of October 2026.
If you'd like to try it first, you can run two property analyses free, or start a 7-day free trial with full access.
On the other hand, if you don't know where to invest yet, use BNBCalc Markets to compare US markets by gross yield and see each one's busy and slow months on its Occupancy rate card.
Airbnb Tax Deduction Calculator
Paying too much in taxes? We have the perfect solution. Simulate an Airbnb home purchase below.
Purchase Price
$450K
Structure Value
70%
Apply Trump's Tax Cut (Bonus Depreciation)
Depreciation
$117,695
Interest
$21,600
Tax
$6,750
Year 1 Deduction
$146,045
Want to claim this deduction? Get a free cost segregation benefit analysis from CSA Partners — no obligation.
Get Full Analysis