8 tracked markets

Source: BNBCalc market metadata · Reviewed by Parker Place, CTO of BNBCalc.com · Data updated July 10, 2026

Best Airbnb Markets in Maryland by Gross Yield

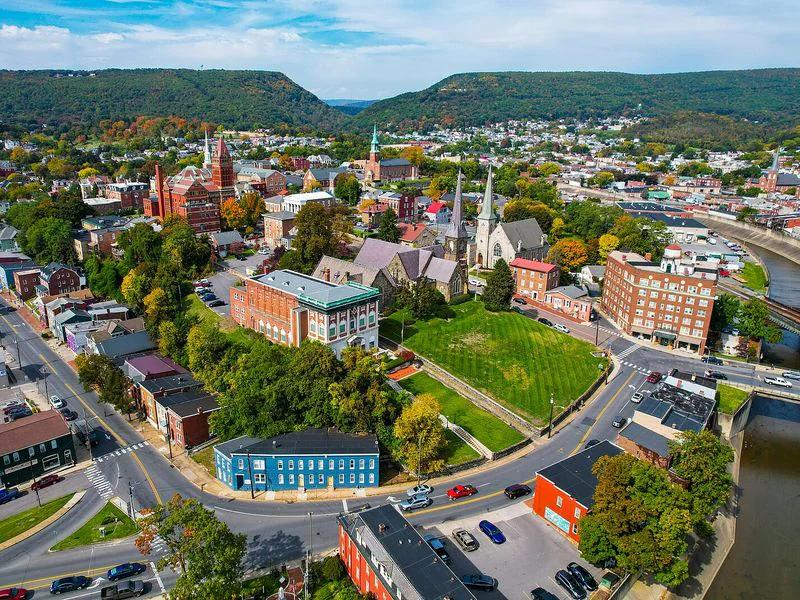
Cumberland is the top Maryland short-term rental market across Airbnb and Vrbo by gross yield, with 22.6% gross yield, $51,906 in average annual revenue, and 916 active listings.

Top gross yield

22.6%

Cumberland

Median gross yield

10.5%

8 markets with yield data

Median annual revenue

$41.7K

Average listing revenue

Tracked markets

8

Statewide market coverage

Filter market rankings

Default rankings show all bedrooms at the average performance tier.

Bedroom count

Performance tier

Top 10 Maryland Airbnb and Vrbo Markets

Cumberland short-term rental market

#1

Cumberland

Cumberland, Maryland offers short-term rental investors a respectable 21.4% gross yield and a strong annual revenue of $48,374. While the impressive $443 average daily rate is highly attractive, buyers should remain cautious of the low 28% occupancy rate across the 905 active listings currently operating in this market.

Yield

22.6%

Revenue

$51.9K

Listings

916

Cambridge short-term rental market

#2

Cambridge

Investors targeting Cambridge can leverage a high average daily rate of $330 and a strong gross yield of 11.7% across 114 active listings. However, the market's exceptionally low 25% occupancy rate poses a significant challenge, requiring strategic management to successfully achieve the estimated $30,549 in annual revenue.

Yield

14.8%

Revenue

$39.0K

Listings

115

Elkton short-term rental market

#3

Elkton

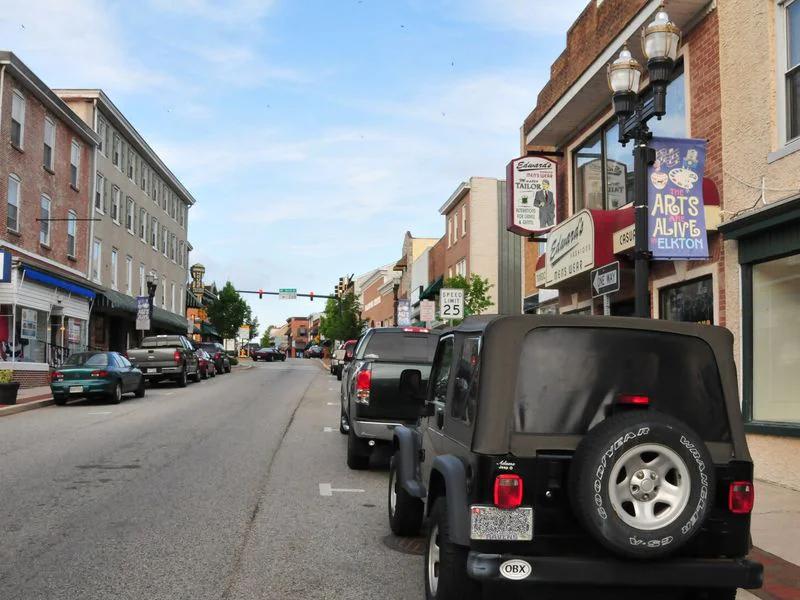
For short-term rental investors, Elkton offers an impressive average daily rate of $412 and a strong gross yield of 11.6% across 149 active listings. However, the market's low 28% occupancy rate represents a notable challenge, meaning operators must carefully optimize their pricing to secure the $44,460 annual revenue potential.

Yield

12.7%

Revenue

$49.3K

Listings

157

Talbot County short-term rental market

#4

Talbot County

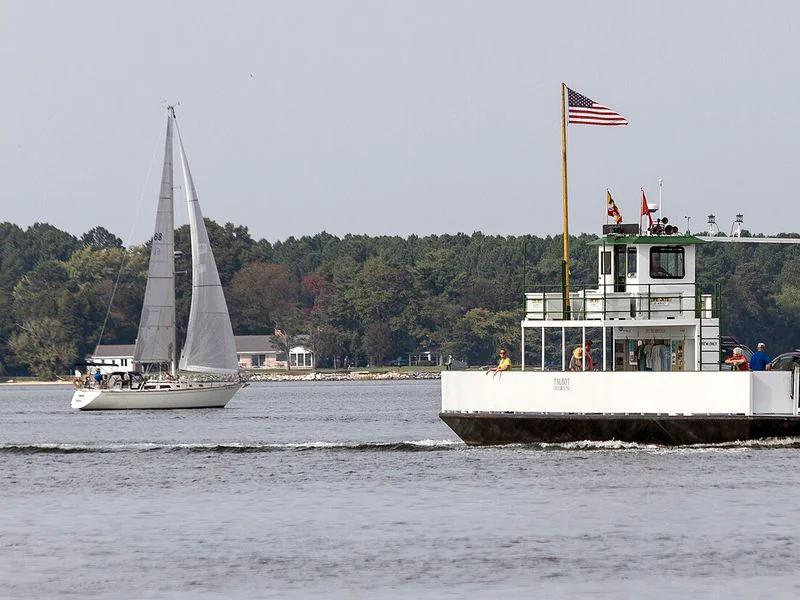
Talbot County delivers a substantial annual revenue of $52,160 and an impressive average daily rate of $504 for short-term rental operators. Despite these strong pricing metrics and a 9.8% gross yield, investors should be cautious of the low 29% occupancy rate across the 213 active listings in the area.

Yield

11.5%

Revenue

$61.7K

Listings

222

Ocean City short-term rental market

#5

Ocean City

Ocean City offers short-term rental investors a strong average daily rate of $306, resulting in a 7.0% gross yield. However, the market is highly competitive with 2,596 active listings, driving occupancy down to a low 24% and limiting average annual revenue to $29,479 for local operators.

Yield

9.4%

Revenue

$40.2K

Listings

2,666

La Plata short-term rental market

#6

La Plata

In La Plata, short-term rental properties achieve a solid average daily rate of $291, contributing to a 7.2% gross yield. However, the relatively low 30% occupancy rate among the 440 active listings means hosts must employ smart pricing to secure the market's $35,248 annual revenue.

Yield

8.4%

Revenue

$41.1K

Listings

441

Baltimore short-term rental market

#7

Baltimore

Baltimore offers short-term rental investors a 6.5% gross yield and a solid average daily rate of $275. However, with 1,668 active listings competing for guests, the occupancy rate sits at 33%, limiting annual revenue to $34,906 and requiring operators to focus on exceptional hospitality to stand out.

Yield

7.5%

Revenue

$40.6K

Listings

1,737

Frederick short-term rental market

#8

Frederick

Frederick provides short-term rental investors with a 6.7% gross yield and a solid average daily rate of $269. Despite these healthy pricing metrics, a moderate 36% occupancy rate across 564 active listings limits annual revenue to $38,367, suggesting that active marketing is necessary to maximize property performance.

Yield

7.4%

Revenue

$42.2K

Listings

579

All Maryland Short-Term Rental Markets

Every market below links to its full BNBCalc market page. Rankings use gross yield first, then annual revenue when yield is missing.

Active listings are Airbnb and Vrbo listings observed as active in the selected market metadata segment. The all-bedrooms view uses all active listings in that market; bedroom filters use the active listing count for the selected bedroom group.

RankMarketGross yieldAnnual revenueMonthly revenueADROccupancyListingsPurchase price
#1Cumberland22.6%$51,906$4,325$43029%916$229,225
#2Cambridge14.8%$38,974$3,248$33128%115$264,086
#3Elkton12.7%$49,342$4,112$37034%157$389,613
#4Talbot County11.5%$61,715$5,143$46932%222$534,407
#5Ocean City9.4%$40,193$3,349$30731%2,666$426,127
#6La Plata8.4%$41,119$3,427$29233%441$491,524
#7Baltimore7.5%$40,553$3,379$24639%1,737$538,867
#8Frederick7.4%$42,244$3,520$25240%579$571,165

How We Rank Markets

For US markets, BNBCalc ranks state market pages by gross yield: annual Airbnb and Vrbo short-term rental revenue divided by estimated property value. Gross yield is a fast way to compare market-level opportunity before operating expenses, financing, taxes, insurance, seasonality, and local rules.

  • Annual revenue uses ADR, adjusted occupancy, and estimated cleaning revenue when cleaning and stay data exists.

  • ADR is nightly-only and excludes cleaning fees and other guest fees.

  • Occupancy is adjusted occupancy of bookable nights, excluding host-blocked nights.

  • Gross yield uses annual revenue divided by estimated property value; it does not include operating expenses, financing, taxes, or local regulation risk.

Compare Rental Demand in Maryland

For long-term rental context, compare statewide Section 8 Fair Market Rent data alongside short-term rental market performance.

Frequently Asked Questions About Maryland Airbnb and Vrbo Markets