
Bezpłatna natychmiastowa analiza
Odkryj przychody Airbnb dla dowolnego adresu lub miasta
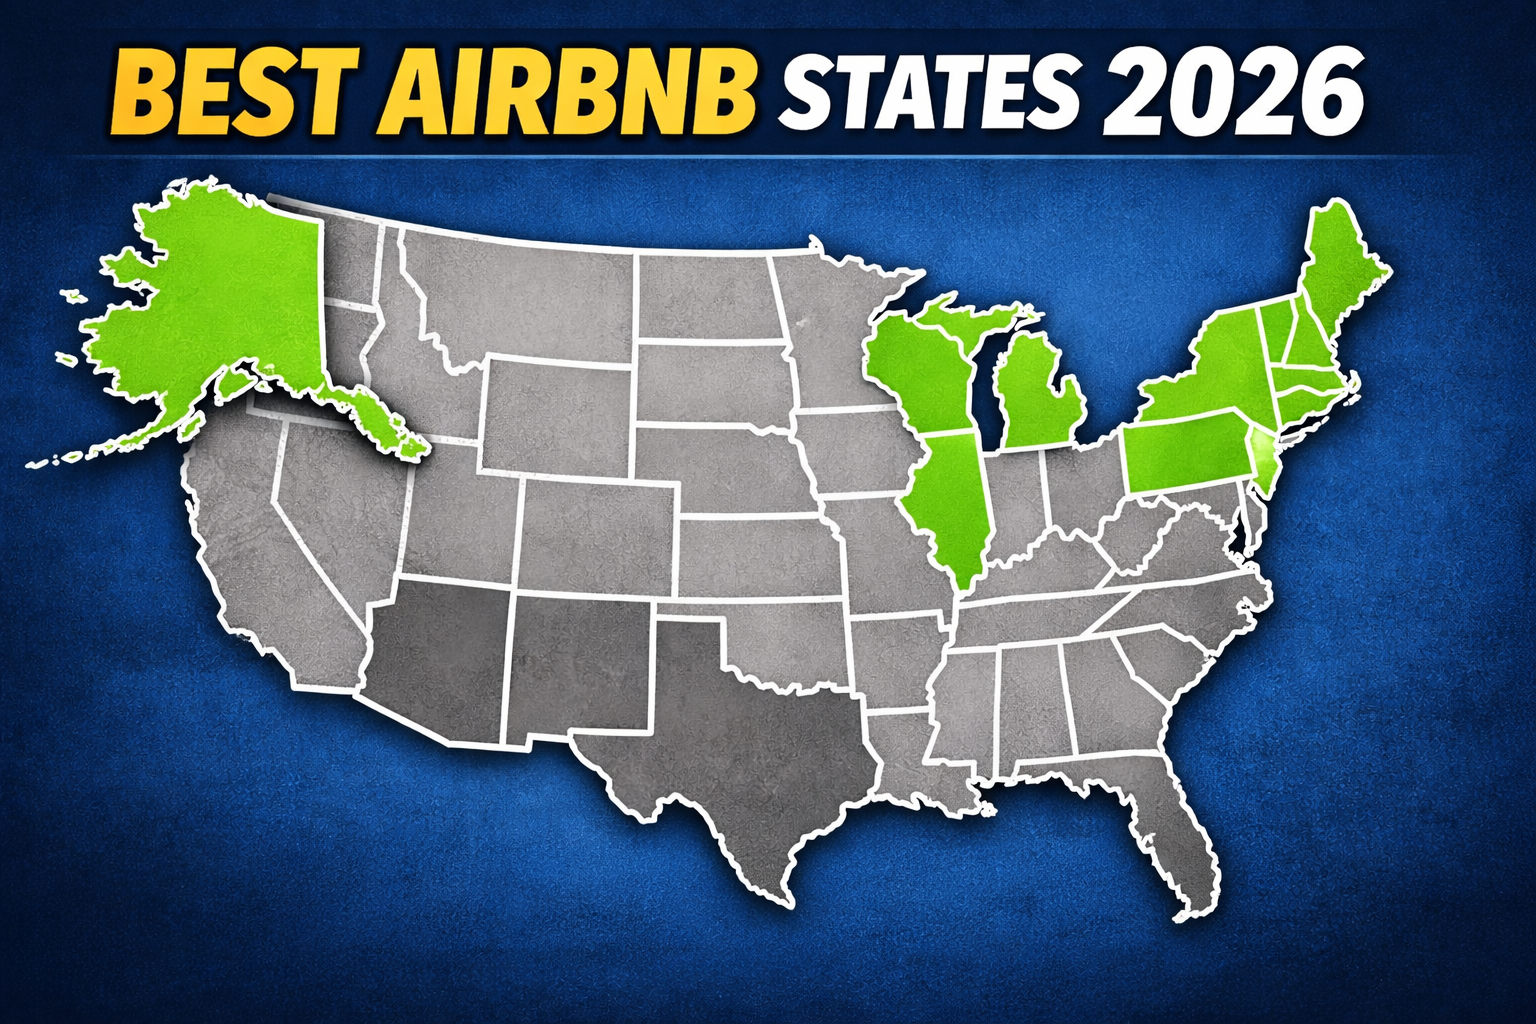
The Best States for Airbnb Investing in 2026
If you're evaluating the best states for Airbnb investing in 2026, the first instinct is to look at familiar names: Florida, Tennessee, Colorado, Arizona. These are the states with the most visible vacation rental activity. They're also, in many cases, not the highest-performing.
BNBCalc analyzed 300,000 STR investment analyses from our users across the U.S., last updated March 30, 2026. And the results? The state-level picture is different from what most investors expect.
How We Ranked States
States are ranked by % of A+/A graded analyses — the share of properties in each state that earned an A+ or A investor grade in BNBCalc. This metric captures consistency: a state where 40% of properties score A+/A is a fundamentally different opportunity environment than one where 20% do. Median cash-on-cash return is included alongside for context. You can learn more about how we grade individual deals in our Investor Score for Airbnb & Rental Properties: How to Grade Any Deal guide.
All analyses assume: 20% down payment, 30-year fixed mortgage, interest rates between 4.5%–9%, minimum purchase price of $75,000.
The Top 10 States
| Rank | State | Median CoC | % A+/A Grades | |------|-------|-----------|--------------|------------| | 1 | Alaska | 11.5% | 41.9% | | 2 | Illinois | 11.2% | 41.7% | | 3 | Maine | 11.4% | 40.9% | | 4 | Vermont | 11.0% | 40.7% | | 5 | North Dakota | 9.4% | 39.7% | | 6 | Minnesota | 11.0% | 38.6% | | 7 | Pennsylvania | 10.5% | 37.7% | | 8 | Michigan | 9.9% | 37.2% | | 9 | Rhode Island | 10.5% | 36.7% | | 10 | Kentucky | 8.9% | 36.0% |
State-by-State Breakdown
1. Alaska — 11.5% Median CoC | 41.9% A+/A
Alaska leads the country, and the reasons are structural. Tourism demand is strong — Northern Lights, Denali, sport fishing, outdoor recreation — and the supply of short-term rental properties is thin relative to comparable destination states. Fewer competing listings means less pricing pressure. Travelers to Alaska also tend to book longer stays, which improves occupancy economics.
The tradeoffs are real: remote property management, fewer local PM options in many areas, and meaningful seasonality in some markets. Fairbanks (15.9% median CoC, 51.4% A+/A) and the broader interior Alaska market show consistent results. Investors willing to manage the logistics are finding a market that most of the country hasn't discovered yet.
2. Illinois — 11.2% Median CoC | 41.7% A+/A
Illinois is the most counterintuitive name on this list. It's not a vacation destination state in the conventional sense — and that's precisely why it performs.
Illinois STR markets run primarily on Chicago metro demand: drive-to leisure, corporate travel, suburban event hosting, and weekend escapes from the city. Property prices in many Illinois markets are well below coastal comparables, which makes the Airbnb cash on cash return by state math work in ways it simply doesn't in Florida or California. Top cities include Waukegan (30% CoC, #1 nationally), Lombard (26.1% CoC), and East Peoria (24.3% CoC). Before investing, it's worth reviewing the Illinois STR lodging tax requirements to understand your full cost picture.
3. Maine — 11.4% Median CoC | 40.9% A+/A
Maine STR markets are driven by coastal tourism, the Acadia National Park corridor, and a genuinely constrained housing supply in desirable areas. What makes Maine stand out is the revenue-to-price relationship: many well-located properties generate strong short-term rental income relative to their purchase price. Bar Harbor, Camden, Southwest Harbor, and several other coastal towns rank in the top 25 cash-flow cities in the country.
Maine also has one of the largest STR-vs-LTR return gaps nationally — which suggests the market's advantage is specific to short-term use, not just general real estate strength. Understanding that gap matters when you're evaluating short-term rental investment by state. Check out The Airbnb Investor's Guide to Gross Rent Multiplier for a deeper look at how purchase price relates to revenue potential.
4. Vermont — 11.0% Median CoC | 40.7% A+/A
Vermont's STR market draws from three demand sources: fall foliage season, ski winter, and summer recreation. All three generate sustained demand from the Boston, New York, and Hartford metro corridors. Supply is naturally limited by geography — the state is small and the most desirable markets are constrained. Ski communities like Winhall and Stowe-adjacent markets populate the upper end of the Vermont rankings, but the state's performance is broader than ski-only.
Vermont has the second-largest STR vs. long-term rental CoC gap of any state in our dataset. Investors choosing traditional rental in Vermont instead of Airbnb are leaving substantial returns on the table. Make sure to properly weigh the STR vs. LTR data to evaluate that tradeoff for your market.
5. North Dakota — 9.4% Median CoC | 39.7% A+/A
North Dakota's 39.7% A+/A rate is legitimate, but the sample size (141 analyses) is smaller than the other top-10 states. The STR market here is driven primarily by energy sector business travel and event-based demand in Bismarck and Fargo. The numbers are consistent with the broader pattern — treat the state data with appropriate caution until the dataset grows.
6. Minnesota — 11.0% Median CoC | 38.6% A+/A
Minnesota combines Twin Cities metro demand with a well-established lake country tourism economy. Shakopee (25.6% CoC), Grand Marais (#11 nationally in cash flow), and Lutsen anchor a list of markets with consistent performance. At 2,242 analyses, Minnesota is one of the better-validated states in the top 10.
Lake property STR in Minnesota performs particularly well in the July-August window, but markets closer to the Twin Cities metro — Shakopee, Pequot Lakes — hold occupancy better year-round. When managing properties across multiple Minnesota markets, smart specialty pricing strategies can meaningfully lift seasonal revenue.
7. Pennsylvania — 10.5% Median CoC | 37.7% A+/A
Pennsylvania's performance is driven by two geographic zones: the Pocono Mountains (Mount Pocono, East Stroudsburg, Big Bass Lake, Jim Thorpe) and the Pittsburgh and Philadelphia suburban markets.
The Poconos benefit from consistent drive-to leisure demand from New York and Philadelphia, and a market deep enough that many investors have found their footing here. The breadth of Pennsylvania's performance across geography and market type gives it a consistent 37.7% A+/A rate.
8. Michigan — 9.9% Median CoC | 37.2% A+/A
Michigan divides clearly into two STR zones: the Lake Michigan shoreline (Mears, Ludington, Stevensville, Saugatuck corridor) and the northern inland lake region (Boyne Falls, Gaylord, Williamsburg, Central Lake). Both deliver.
Summer beach and lake demand in western Michigan runs strong. The northern lake region benefits from four-season outdoor recreation — skiing, snowmobiling, and leaf-peeping extend revenue well beyond July and August. Keeping properties consistently guest-ready across multiple seasons requires real operational discipline, and it all starts by keeping your Airbnb clean between guests.
9. Rhode Island — 10.5% Median CoC | 36.7% A+/A
Rhode Island's small footprint concentrates almost all STR activity along Narragansett Bay and the southern coastline: Westerly, Narragansett, Newport, and Block Island. That concentration creates natural supply constraints. Demand from the Providence and Boston metro areas is consistent, and the distinct coastal tourism identity keeps summer occupancy high.
10. Kentucky — 8.9% Median CoC | 36.0% A+/A
Kentucky may be the most underestimated state on this list. Strong performance across Williamstown (88% A+/A rate — one of the highest city-level rates in the country), Lawrenceburg, Georgetown, Shelbyville, and other markets reflects a diverse demand base: bourbon trail tourism, horse country events, Kentucky Derby-adjacent demand in spring, and outdoor recreation in the Red River Gorge area.
The median CoC of 8.9% is the lowest in the top 10, but the grade distribution and geographic breadth make Kentucky a consistently productive state for STR investors. Owners scaling often work with rental management companies to handle the operational load across dispersed markets.
States That Didn't Make the Top 10
A few notable absences worth understanding:
Florida is one of the highest-volume STR states in the country, and individual Florida markets perform very well (Seacrest Beach at 28.2% CoC is #2 nationally). But saturation in major Florida markets, rising property prices, and high F-grade rates in metros like Miami, Orlando, and Tampa pull down the state distribution. Florida at the state level doesn't crack the top 10 among the best states for Airbnb investing in 2026, even though Florida at the city level produces some of the best returns anywhere.
Tennessee (Nashville, Gatlinburg, Pigeon Forge) has faced increasing competition and rising purchase prices in its primary STR markets. Returns have compressed over the past few years as investor interest drove up property costs. Individual deals still work, but Tennessee as a whole doesn't rank in the top 10 by either CoC or A+/A rate in current data.
Colorado faces the same challenge: popular mountain markets with high purchase prices. Breckenridge, Vail, and Steamboat Springs command premiums that make CoC math difficult. Colorado STR can still work for specific properties at the right price — individual analysis required.
Texas and Arizona are large states with wide market variance. Individual markets in both states perform well. But neither state concentrates performance the way the top STR markets in 2026 do — high F-grade rates in many Texas and Arizona metros pull the state-level distributions down.
Using State Rankings as a Starting Point
State data narrows your search — it doesn't replace individual property analysis. A high-ranked state improves the probability of finding a strong deal. Any individual property can outperform or underperform the state median based on its specific location, purchase price, condition, management quality, and local competition.
Use the state list to build your shortlist. Then run individual property analyses on the addresses you're seriously considering. Our guide on how to analyze an Airbnb investment property walks through the full evaluation process. Knowing where your listing will be distributed across booking platforms is another factor worth locking down early — short-term rental investment by state only pays off if guests can actually find your property.
Run a free Airbnb analysis on BNBCalc →
Data from 300,000 BNBCalc analyses, last updated March 30, 2026. All analyses assume 20% down, 30-year mortgage, interest rates between 4.5%–9%, minimum purchase price of $75,000.
Airbnb Tax Deduction Calculator
Paying too much in taxes? We have the perfect solution. Simulate an Airbnb home purchase below.
Purchase Price
$450K
Structure Value
70%
Apply Trump's Tax Cut (Bonus Depreciation)
Depreciation
$117,695
Interest
$21,600
Tax
$6,750
Year 1 Deduction
$146,045
Want to claim this deduction? Get a free cost segregation benefit analysis from CSA Partners — no obligation.
Get Full Analysis