
Free instant analysis
Reveal Airbnb revenue for any address or city
Picking a short-term rental market usually comes down to hearsay and guesswork. Someone mentions a city on a podcast, a listing looks promising on Zillow, and a forum thread from two years ago swears the area is booming. None of that tells you what the properties there actually earn.
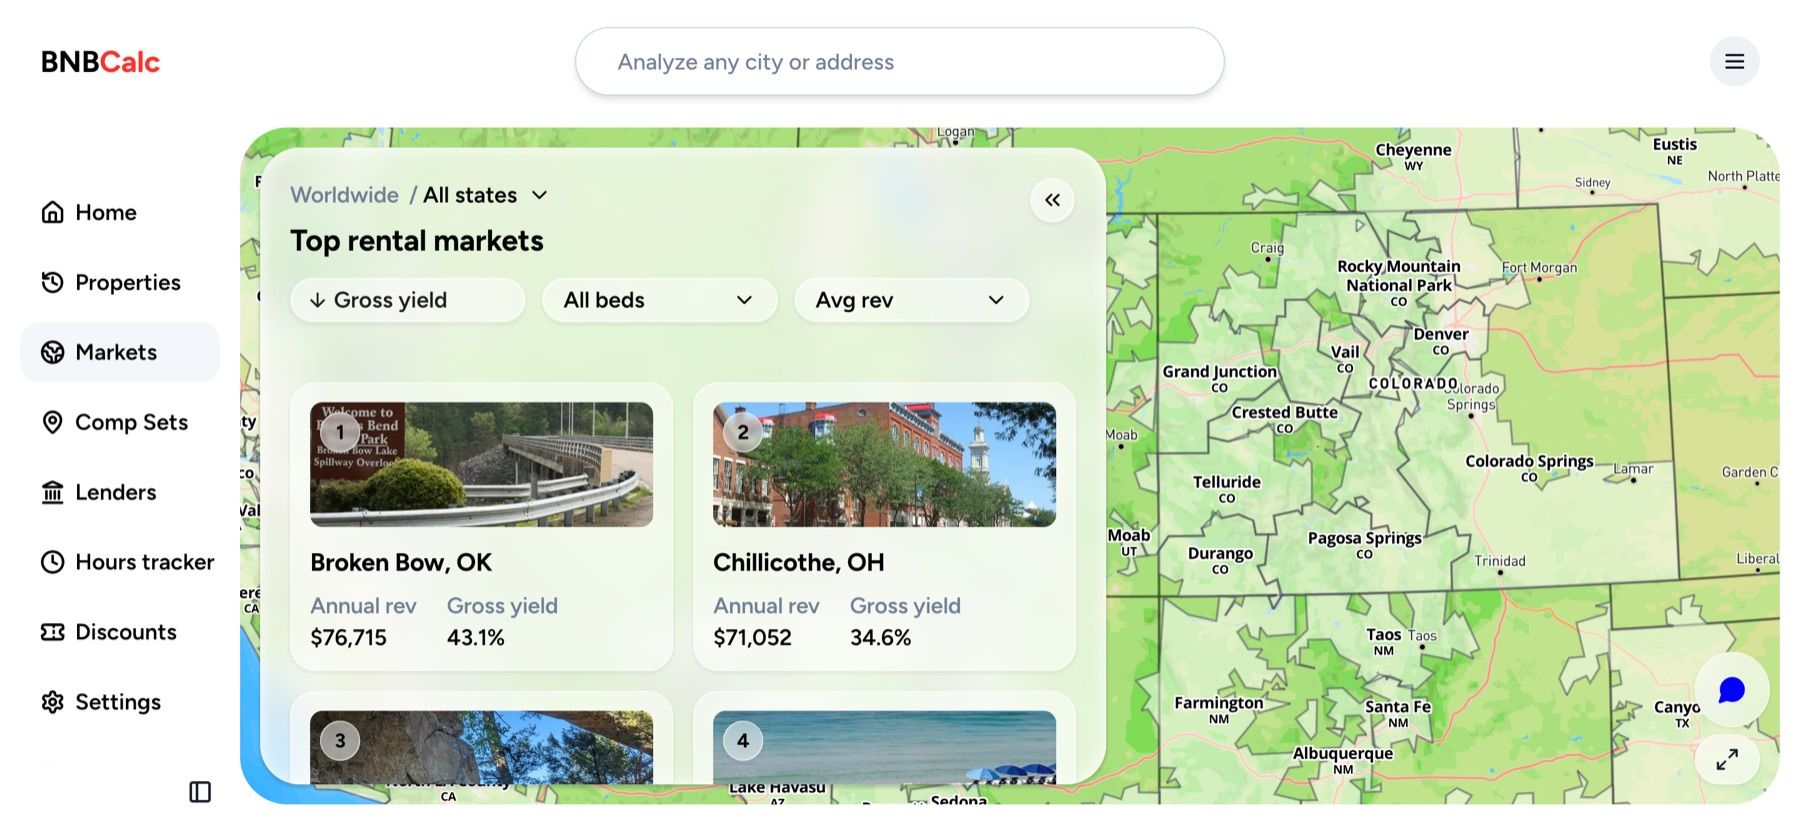
BNBCalc Markets is live, and it answers that question directly. It's a searchable map of more than 10 million active Airbnb and Vrbo listings across 2,000+ markets in 157 countries, with the revenue, occupancy and pricing behind every one of them.
You can look before you pay, too. Broken Bow, Oklahoma is free to explore with no subscription at all, and every plan opens with a 7-day trial. Here's what's inside, how to use it, and what it costs.
What Is BNBCalc Markets?
If you've used the BNBCalc Calculator, you already know what it does for a single property: paste in an address, get the deal math back. Markets works one level up. It's where you figure out which city is worth your attention before you go hunting for addresses in it.
Open any market and you'll see every active Airbnb and Vrbo listing in the area, what each one earns, how full it stays, and what it charges a night. Three years of history sit behind those numbers, so you can tell whether a place has been growing or cooling instead of reading one snapshot and hoping. Prices show in 9 currencies, and the coverage runs worldwide, so a market in Portugal reads the same way as one in Texas.
That last part catches people out. Most tools stop at the US border.
What You Get in Every Market
Marketwide Performance Stats
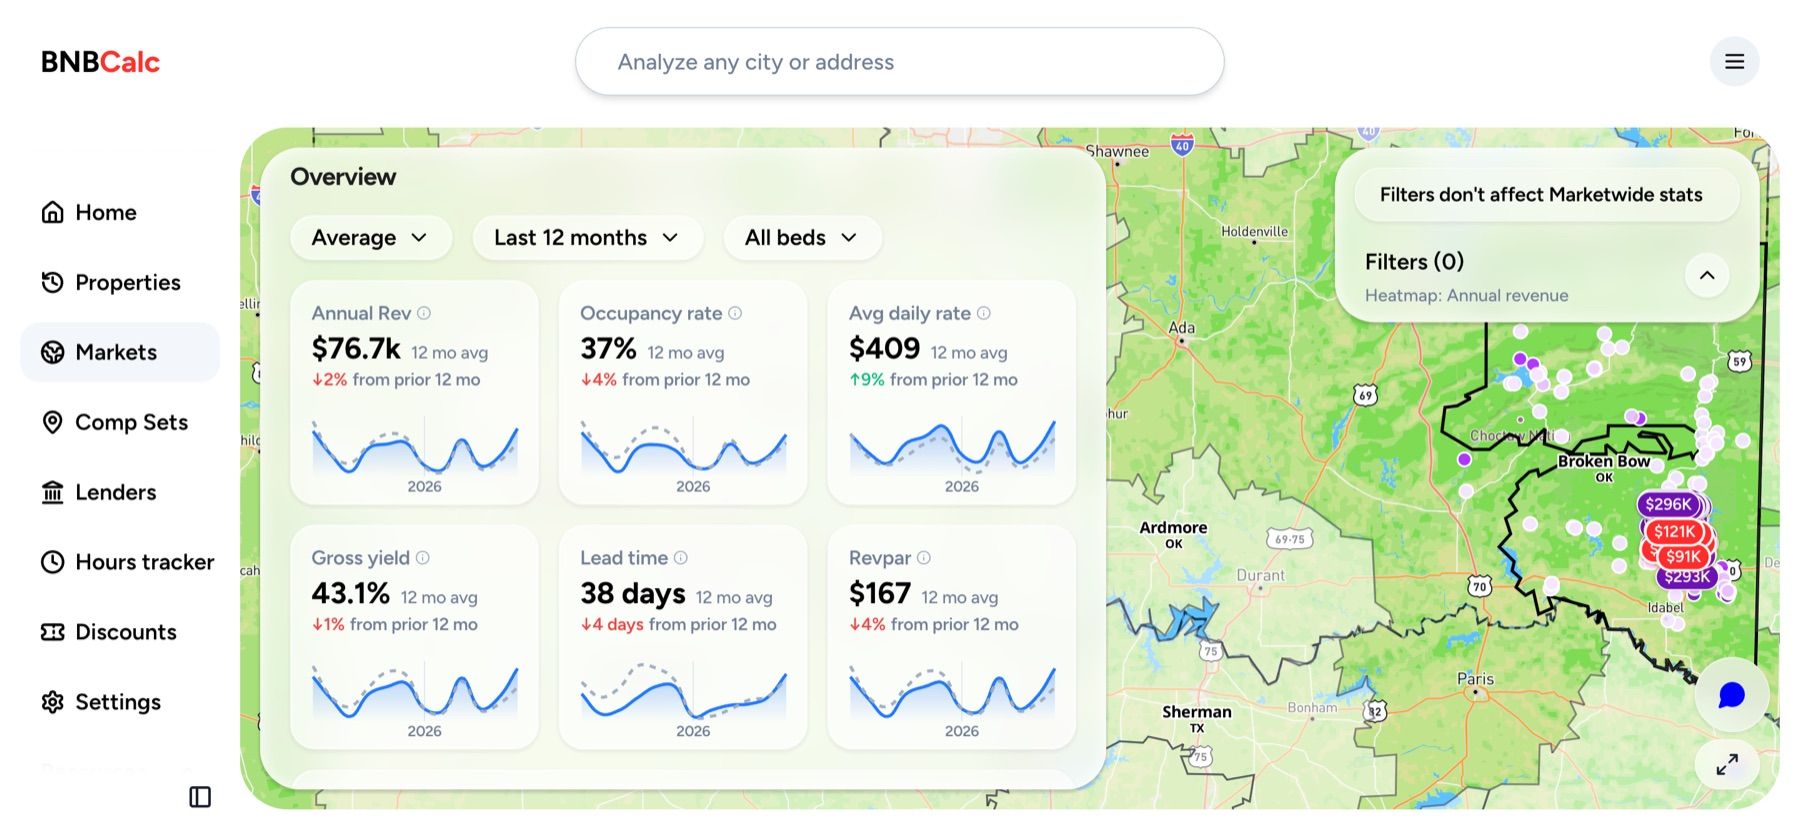
Every market opens on a summary of how the whole area is doing: annual revenue, occupancy, average daily rate, gross yield, RevPAR, and how far ahead guests tend to book.
Each figure comes with a chart underneath it and a comparison against the previous twelve months, so you see the direction as well as the number. Three dropdowns at the top let you swap the average for the median, change the time window, or filter the whole view down to a single bedroom count.
Revenue and Yield by Bedroom Count
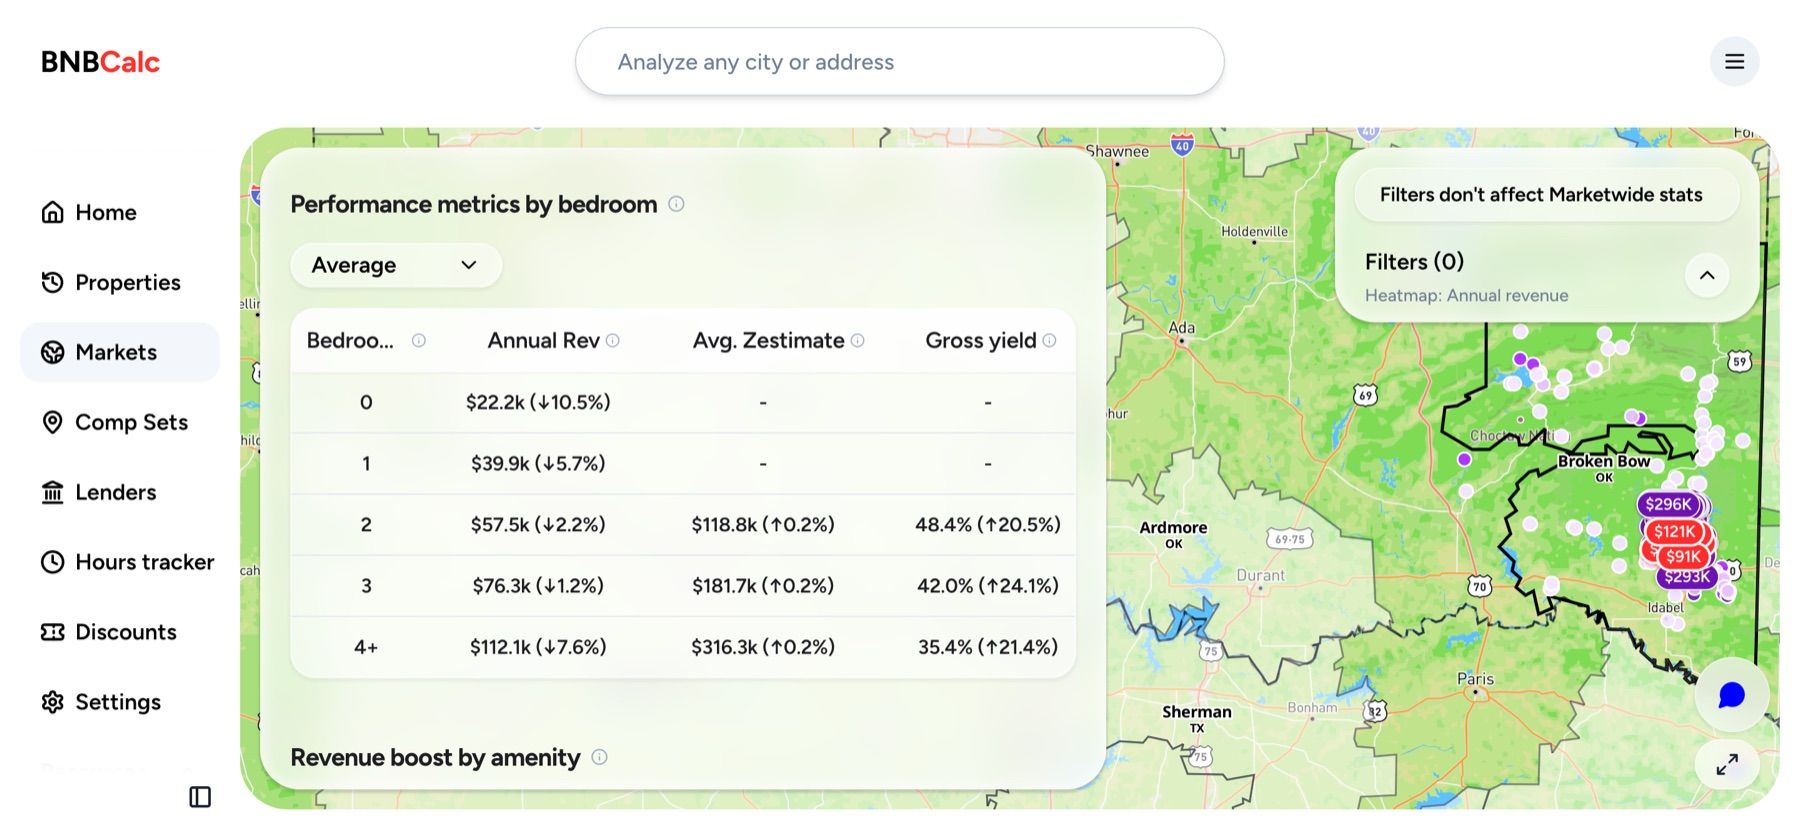
Market averages hide a lot, so the next table splits the same area up by property size. For every bedroom count you get annual revenue, average property value, gross yield, how many listings of that size exist, and the typical cleaning fee.
Put those columns side by side and you can see whether the biggest properties are really the best buy, or whether something smaller hands back more on what you'd spend. Worth knowing before you go looking: gross yield and estimated property value are available on US markets.
Amenity Revenue Analysis
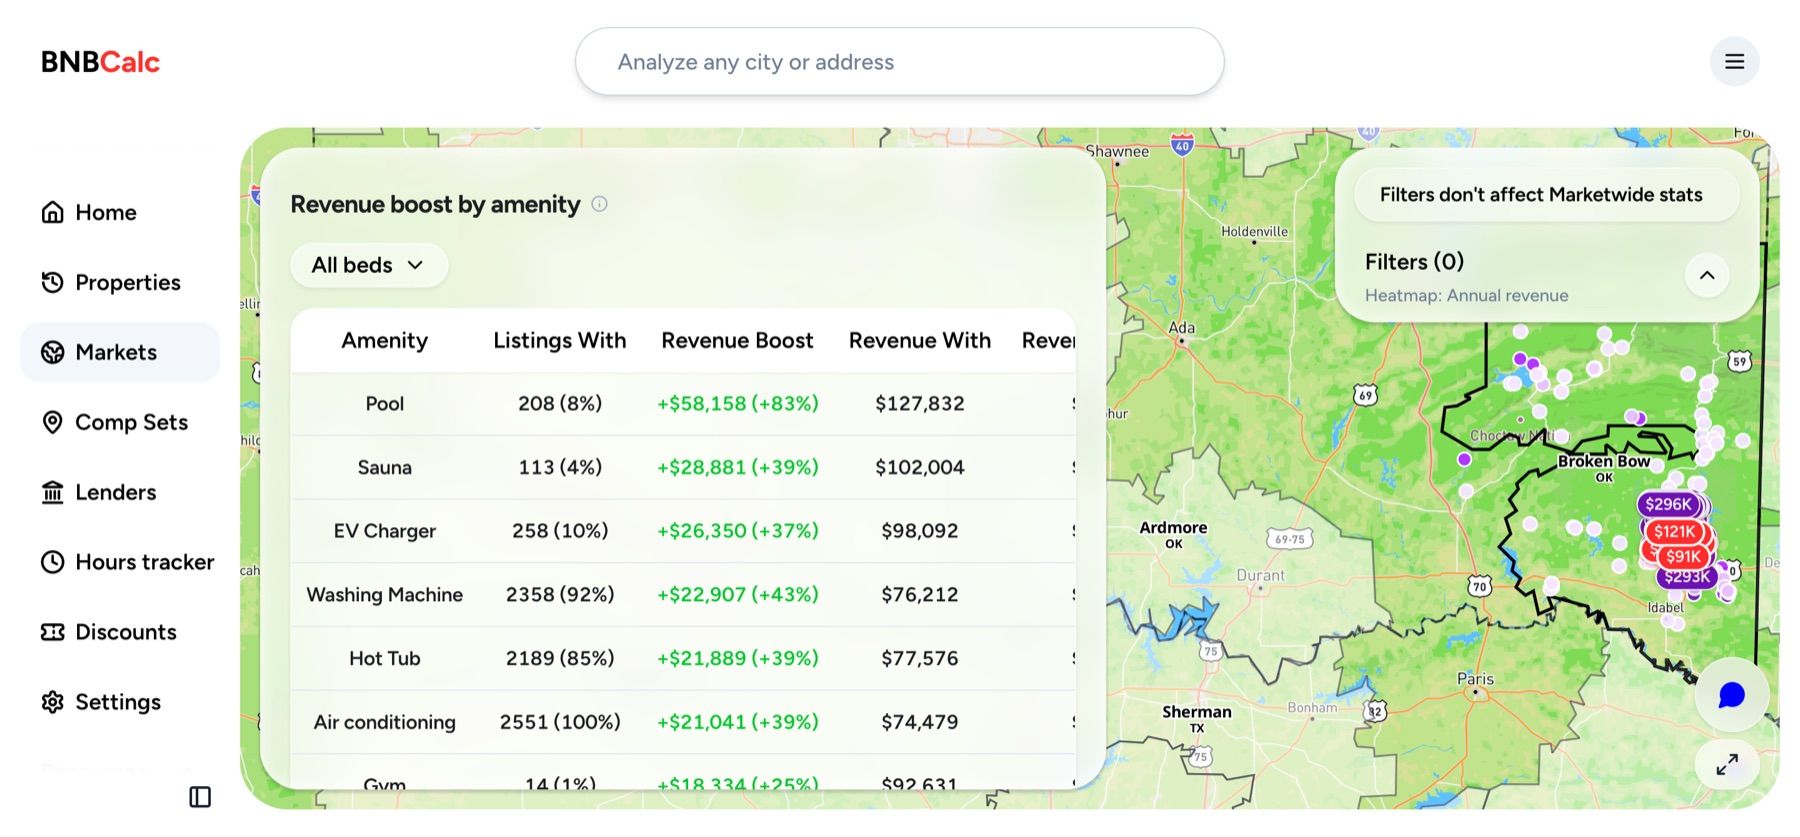
This is the one that surprises people. Markets puts a dollar figure on individual amenities, showing what listings with a pool, hot tub, sauna, EV charger or gym earn against listings without one.
The column beside it is where the actual decision lives, because it tells you how much of the market already has that amenity. Adding something almost nobody offers is a very different proposition from adding what everyone installed two years ago, and either way you get to price the renovation before committing to it.
Seasonality Through the Year
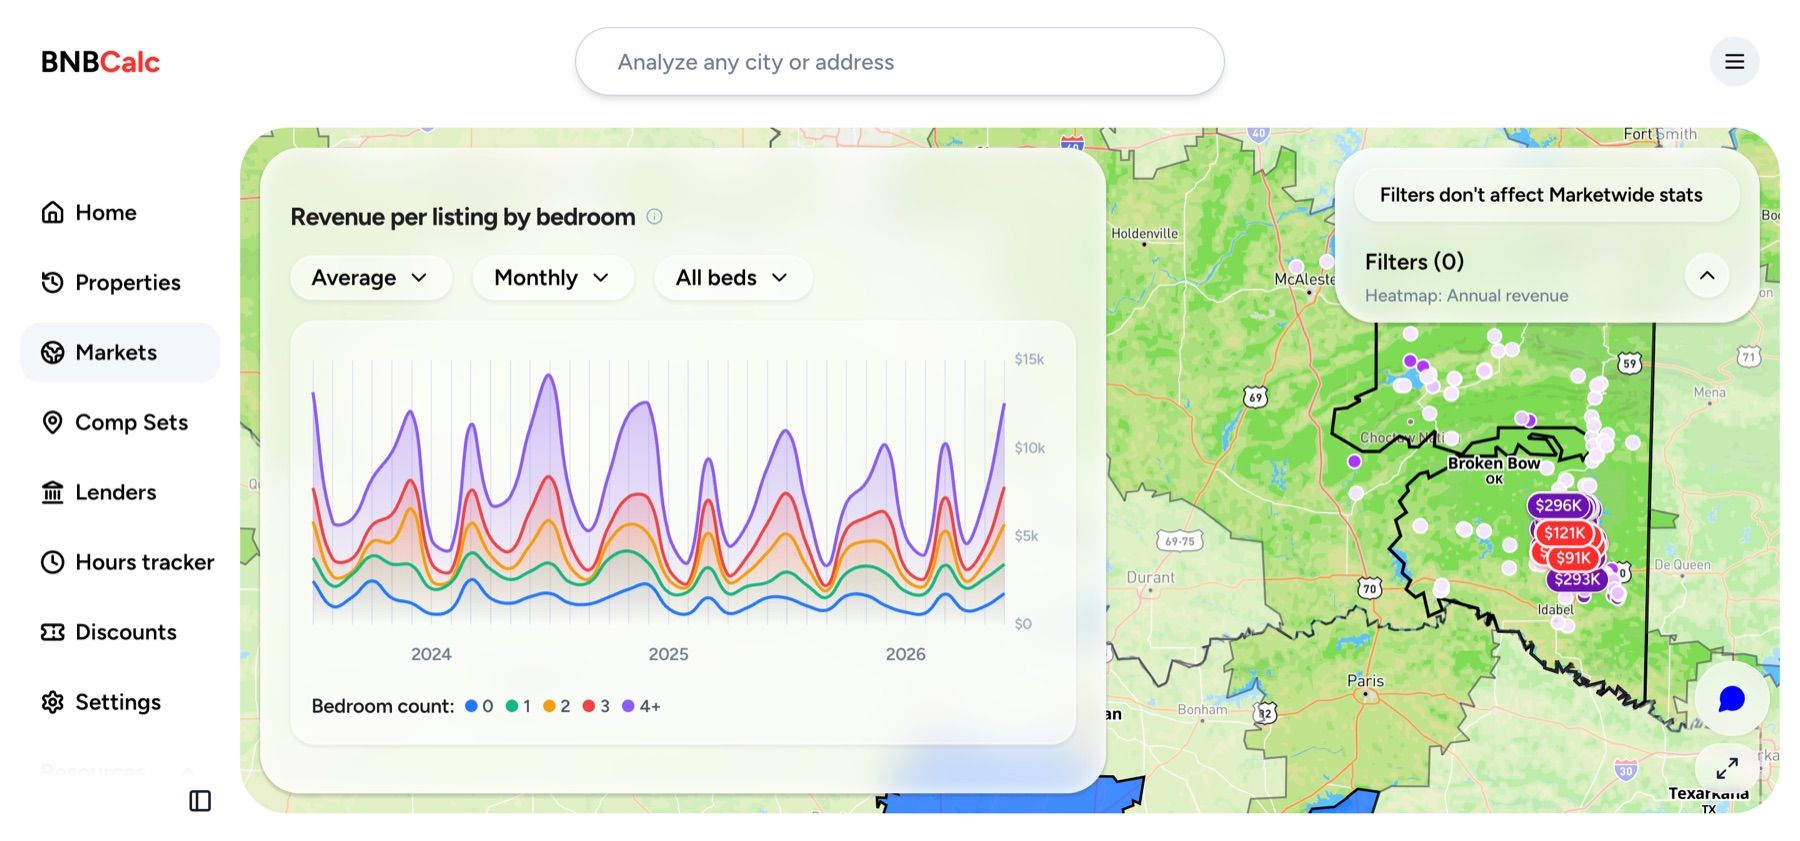
An annual revenue figure smooths over the fact that money doesn't arrive evenly. This chart plots revenue per listing month by month across three years, with a separate line for each bedroom count, so you can see which stretches carry the year and which ones you'd need reserves to get through.
Three years on one screen also shows you something a single year can't, which is whether a market's peaks have been climbing, holding steady, or flattening out.
Weekly Demand and Booking Windows
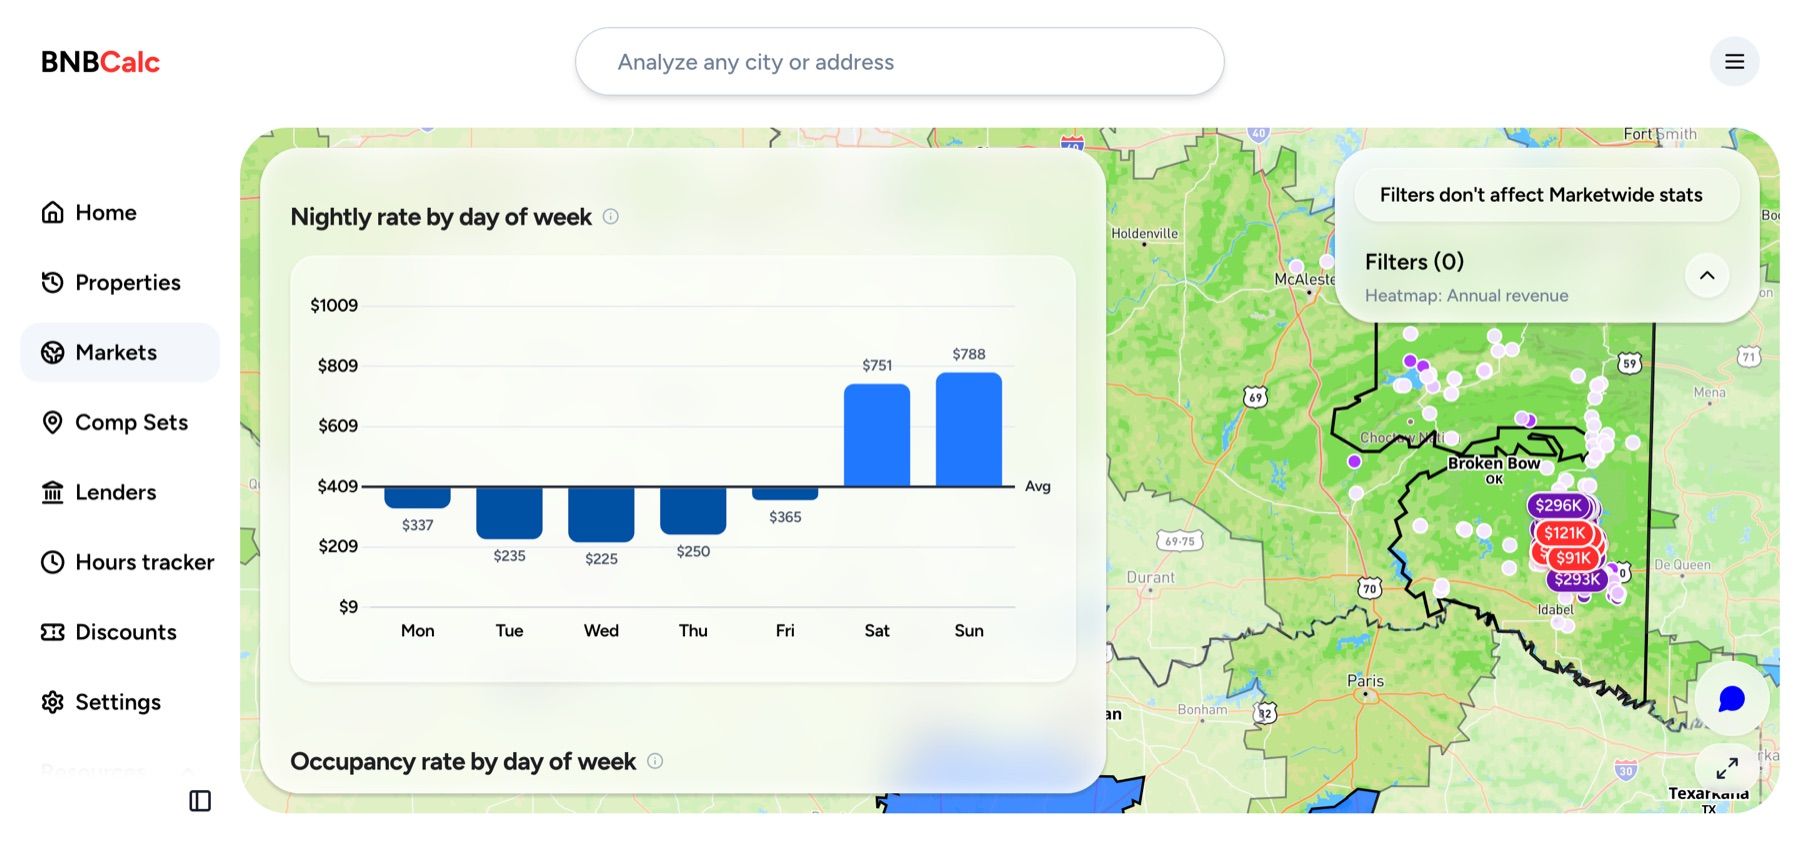
Zoom in from months to days and you get nightly rates and occupancy broken out by day of the week. Leisure markets usually lean hard on weekends, and this shows you exactly how hard, which matters when you're setting minimum stays or working out whether a midweek discount is worth offering.
Markets pairs that with how far ahead guests book, split by property size. Longer booking windows give you more warning and more room to adjust pricing, while shorter ones mean you're filling the calendar close to the date.
Operator and Host Mix
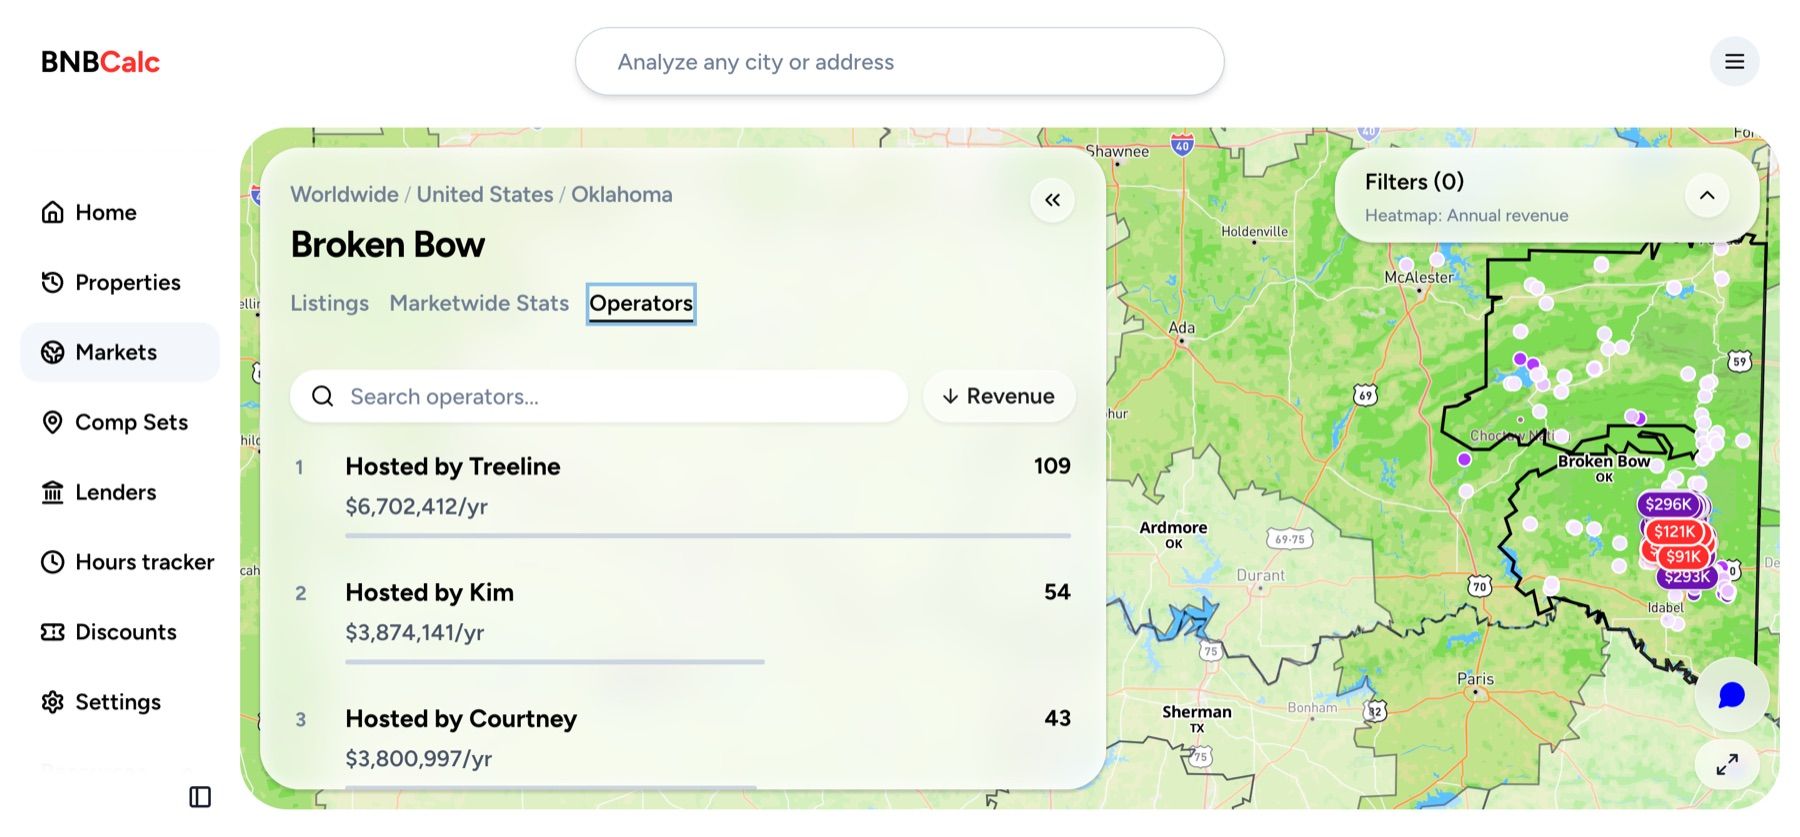
Click over to the Operators tab and you'll see who you'd actually be competing with. It ranks the biggest hosts and management companies in the market by how many listings they run and what those listings bring in between them.
Markets also shows the split between professionally managed listings and independent hosts. An area dominated by professional operators is a different proposition from one full of people renting out a spare place on weekends, and that difference shows up in what you pay for a property as much as in what it takes to run one well.
Every Listing, Browsable and Filterable
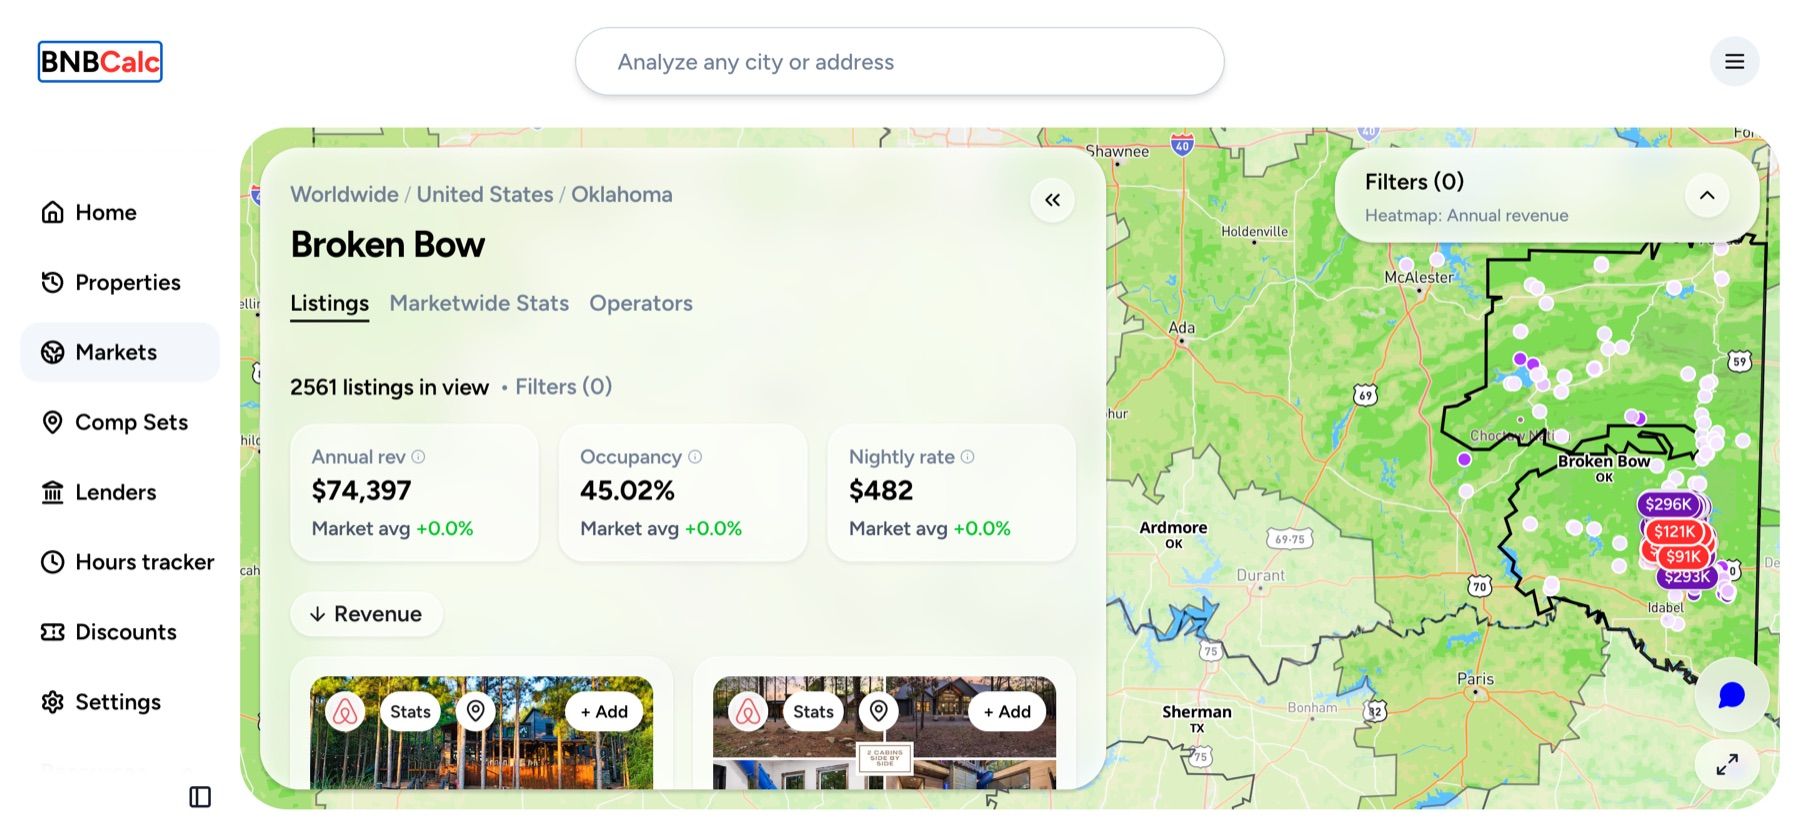
If you'd rather skip the summaries, the Listings tab hands you everything raw. You can sort and filter by annual revenue, gross yield, occupancy, revenue performance tier, bedrooms, beds, room type, amenities, star rating, review count, listing age, operator, and source.
One filter is quietly more useful than the rest, and that's whether a calendar is blocked by the owner or genuinely booked. From the outside they look identical. They mean opposite things. Every listing carries a Street View link too, so you can look at the actual building without leaving the page.
Heatmaps and Market Composition
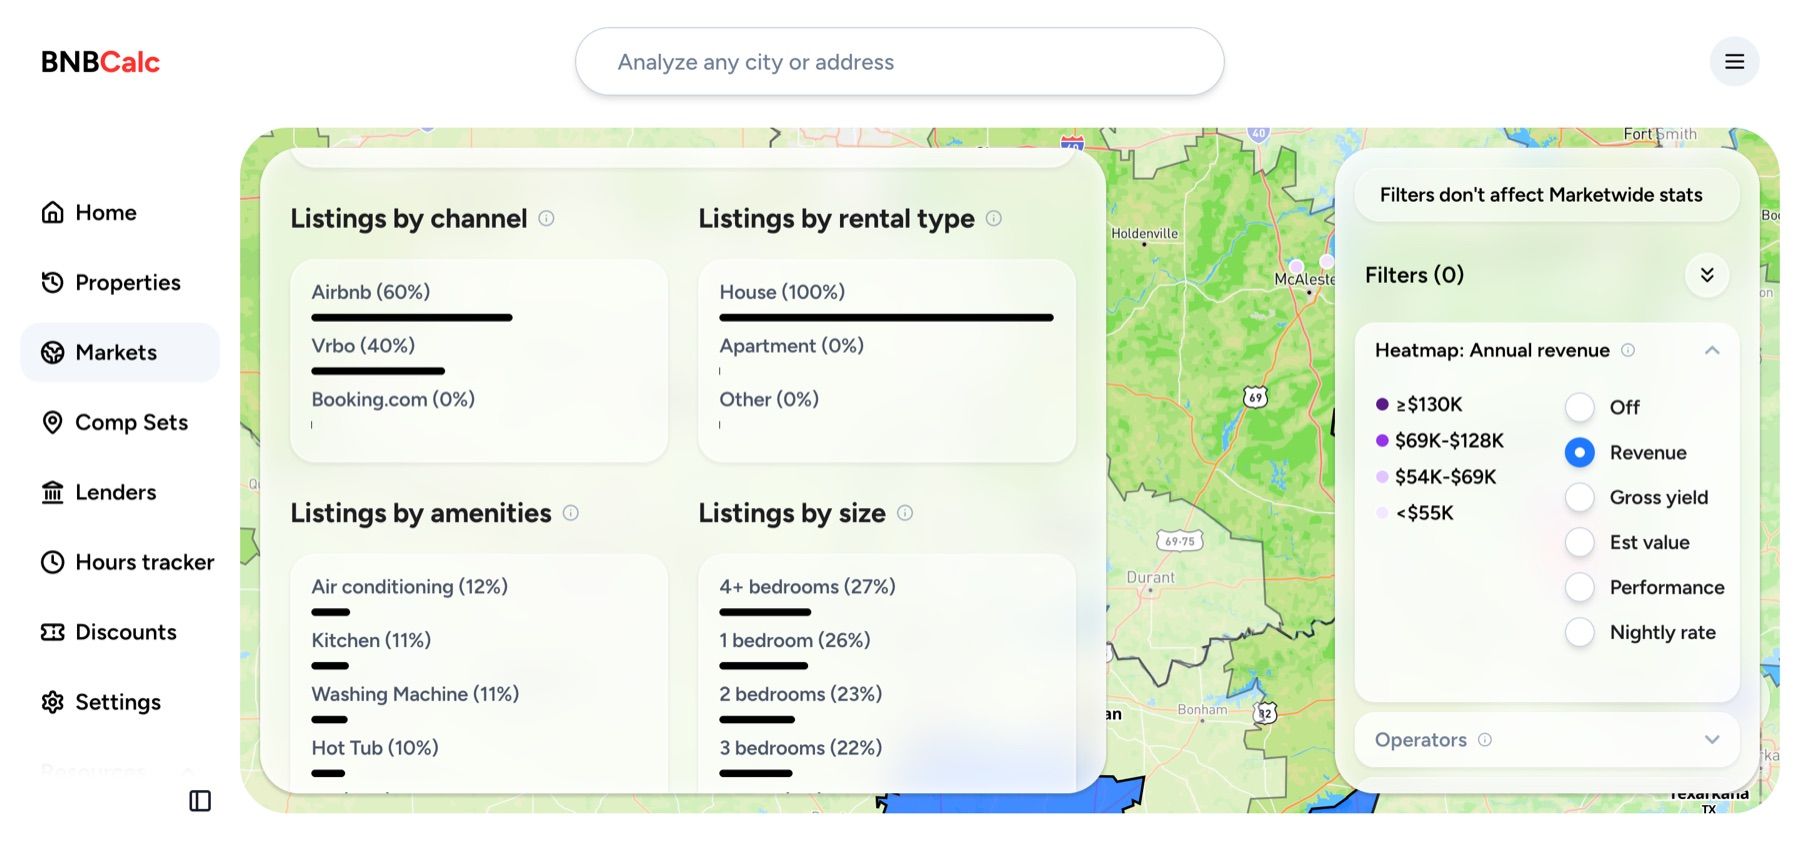
When you don't yet know which market to open, the map carries five heatmap layers: revenue, gross yield, estimated value, performance tier and nightly rate. Switch one on and a whole state colors itself in. It takes seconds, and it's usually the quickest way to turn a list of twelve maybes into the three worth a proper look.
The panels alongside break the area down by booking channel, rental type, amenity mix and property size. That's how you check whether somewhere is all houses or half apartments, and how the Airbnb and Vrbo split actually falls, before you start shopping.
Comp Sets and CSV Export
Once you've narrowed things down to the listings you care about, save them as a comp set. Keep it, share it with a partner, or send it to a lender who wants evidence of what comparable properties in the area earn. When you're ready to model, export 26 columns of listing data to CSV, covering revenue, daily rate, occupancy, RevPAR, bedrooms, review score, cleaning fee, host name and the listing URL, then run the numbers in whatever spreadsheet you already trust.
It's the same job a comparative market analysis does for long-term rentals, built on live rental performance instead of sale comps.
How to Use BNBCalc Markets
The best way to learn how to use Markets is to actually go in and use it. It was made to be intuitive, so a few minutes is enough to get comfortable with it.
- Pick a market. Start on the map and work down from a country to a city or region, or type a place straight into the search bar.
- Read the overview first. Revenue, occupancy, nightly rate and yield sit right at the top, and they tell you in one glance whether an area is worth a closer look.
- Break it down by bedroom count. The table underneath shows what each property size earns and what it's worth, so you can see which sizes the market actually rewards.
- Check the amenities and the calendar. One shows you what guests pay extra for, the other shows you when the money arrives through the year.
- See who else is there. The Operators tab ranks the biggest hosts in the market, and the Listings tab lets you open any single property and look at it up close.
Every panel responds to the filters and dropdowns around it, so you can narrow to one bedroom count or a different time window and watch the whole market redraw itself. When something does look worth chasing, the Calculator comes with the same subscription and picks up from there.
BNBCalc Markets Pricing
Markets runs $79 a month, or $399 a year if you'd rather pay annually and keep 58% of the difference.
| Billing | Price | What you get |
|---|---|---|
| Monthly | $79/mo | Full access to every market, billed month to month |
| Annual | $399/yr | The same access at a 58% saving, billed once a year |
Both options include the BNBCalc Calculator. Property-level underwriting comes with your subscription rather than costing extra, and every plan opens with a 7-day free trial. Prices here are as of July 2026, with current pricing always on the pricing page.
Who BNBCalc Markets Is For
Anyone weighing up a market before spending real money on it. Investors comparing a shortlist of cities can rank them on yield instead of reputation. Realtors show a client what a property would earn as a rental rather than asserting it. Property managers size up a territory and spot underperforming portfolios worth pitching, and cohosts walk into an owner conversation already knowing the amenity payoffs and the seasonality.
It earns its keep in a market you already know, as well. Even after years in the same city, you'll still learn which renovation pays this season and where the professional operators have been gaining ground on you.
Thousands of investors, property managers, cohosts and realtors already use BNBCalc, and the category keeps growing around them. Short-term rentals were worth $131.45 billion in 2025 and are projected to reach $244.13 billion by 2031, according to Mordor Intelligence, while Airbnb alone booked $2.7 billion in revenue in Q1 2026, up 18% year over year, per its results filed with the SEC.
Still building a shortlist? Our roundups of the best cities and best states for Airbnb investing are a reasonable place to start before you open any of them in Markets.
Frequently Asked Questions
Which Countries and Markets Does BNBCalc Markets Cover?
BNBCalc Markets covers more than 2,000 short-term rental markets across 157 countries, built on a live map of over 10 million Airbnb and Vrbo listings. Coverage is global rather than US-only, and figures render in 9 currencies, so a market in Europe or Latin America reads the same way as one in the United States. Gross yield and estimated property value are available on US markets.
Does BNBCalc Markets Cover Vrbo, or Just Airbnb?
Both. Markets shows Airbnb and Vrbo listings for the same market together, treating Vrbo as a full data source rather than a secondary one. That holds across comp sets, listing-level browsing, and the 26-column CSV export. A source filter lets you isolate one platform, and every market shows the channel split so you can see how the two divide up before you commit.
Can I Export Data From BNBCalc Markets?
Yes. Save any group of listings as a comp set, then export 26 columns of listing data to CSV, including revenue, daily rate, occupancy, RevPAR, bedrooms, review score, cleaning fee, host name and the listing URL. Comp sets can also be saved and shared, so you can hand a market to a partner or a lender without them rebuilding the research from scratch.
How Much Does BNBCalc Markets Cost?
Markets costs $79 a month or $399 a year, a 58% saving on the annual plan, as of July 2026. A Markets subscription includes everything in the Calculator plan, so it's one subscription covering both. Both options carry the same access to every market BNBCalc covers, and both start with a 7-day free trial.
Can I Try BNBCalc Markets Before Subscribing?
Yes, in two ways. Broken Bow, Oklahoma is a free market you can explore without a subscription at all, including its full stats, amenity analysis and listing data. Beyond that, every plan starts with a 7-day free trial, so you can research the market you actually care about before paying anything.
Try It on Your Own Market
The fastest way to judge any research tool is to point it at a market you already know and see whether it tells you something you didn't. Open BNBCalc Markets, start your 7-day free trial, and run the city you've been circling for months.
Airbnb Tax Deduction Calculator
Paying too much in taxes? We have the perfect solution. Simulate an Airbnb home purchase below.
Purchase Price
$450K
Structure Value
70%
Apply Trump's Tax Cut (Bonus Depreciation)
Depreciation
$117,695
Interest
$21,600
Tax
$6,750
Year 1 Deduction
$146,045
Want to claim this deduction? Get a free cost segregation benefit analysis from CSA Partners — no obligation.
Get Full Analysis