8 tracked markets

Source: BNBCalc market metadata · Reviewed by Parker Place, CTO of BNBCalc.com · Data updated July 10, 2026

Best Airbnb Markets in Iowa by Gross Yield

Dubuque is the top Iowa short-term rental market across Airbnb and Vrbo by gross yield, with 16.1% gross yield, $42,320 in average annual revenue, and 832 active listings.

Top gross yield

16.1%

Dubuque

Median gross yield

13.1%

8 markets with yield data

Median annual revenue

$30.1K

Average listing revenue

Tracked markets

8

Statewide market coverage

Filter market rankings

Default rankings show all bedrooms at the average performance tier.

Bedroom count

Performance tier

Top 10 Iowa Airbnb and Vrbo Markets

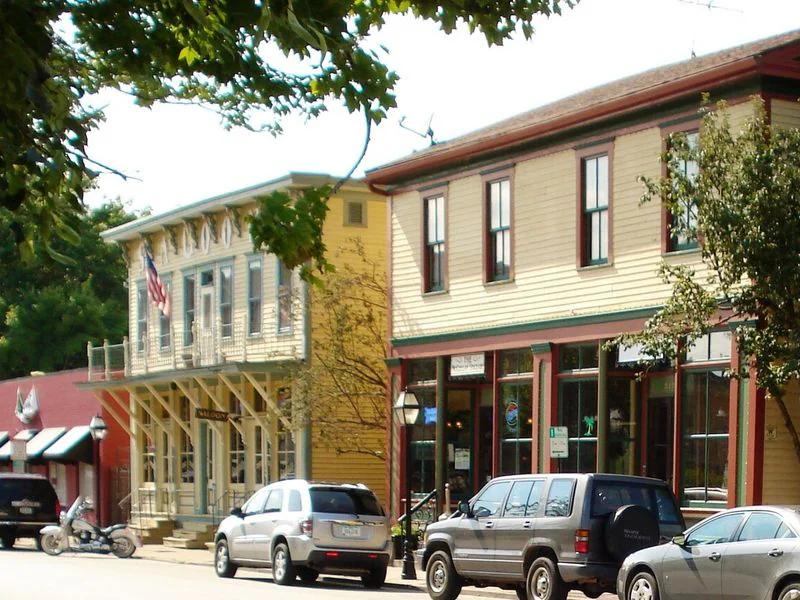
Dubuque short-term rental market

#1

Dubuque

In Dubuque, short-term rental investors can expect a 13.3% gross yield and an annual revenue of $34,694. However, the low 30% occupancy rate across 786 active listings means that maintaining the $279 average daily rate requires a highly targeted approach to attract consistent guest bookings.

Yield

16.1%

Revenue

$42.3K

Listings

832

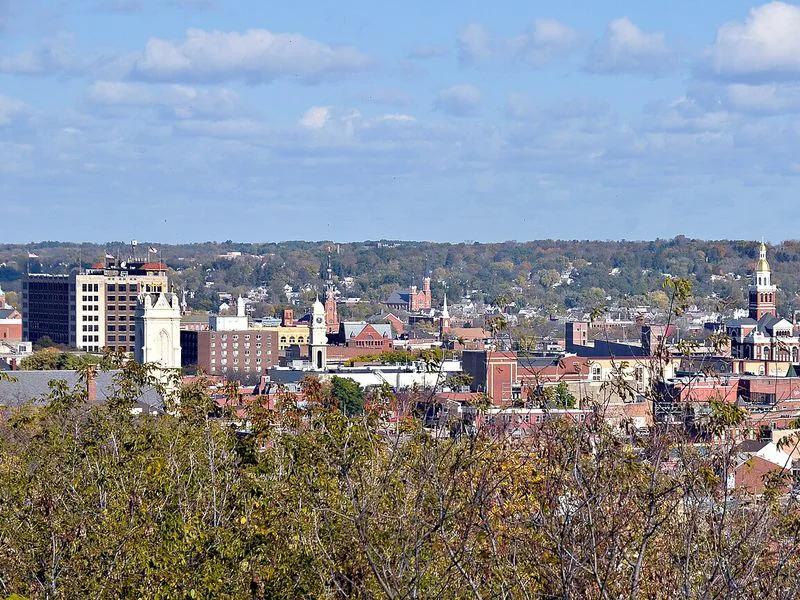
Spencer short-term rental market

#2

Spencer

The Spencer short-term rental market offers a solid 12.7% gross yield and a high average daily rate of $289. However, with a very low occupancy rate of 23% across 202 active listings, investors must carefully evaluate demand patterns to secure the average annual revenue of $25,786.

Yield

15.5%

Revenue

$32.1K

Listings

220

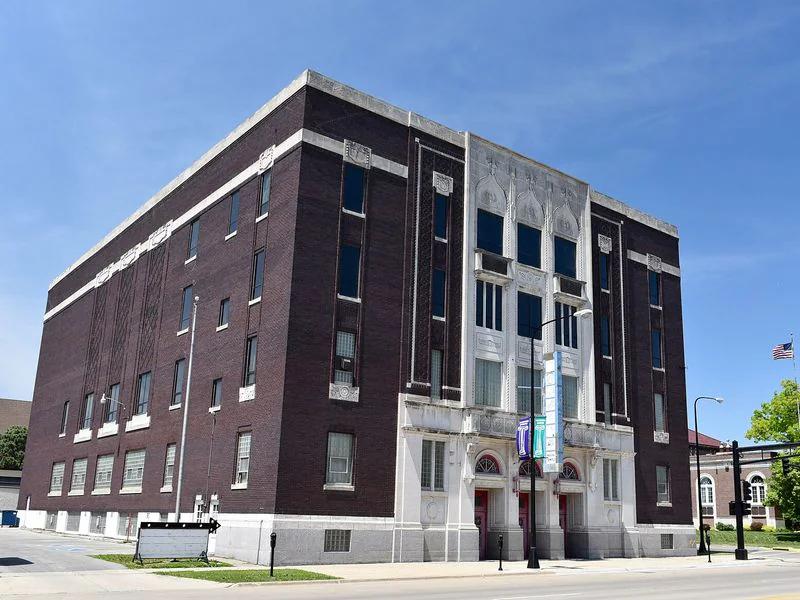
Waterloo short-term rental market

#3

Waterloo

Waterloo offers short-term rental investors a strong 11.7% gross yield and a moderate average daily rate of $201 across 251 active listings. However, a low occupancy rate of 32% means buyers must implement smart pricing strategies to successfully reach the market's annual revenue potential of $25,125.

Yield

14.0%

Revenue

$30.8K

Listings

254

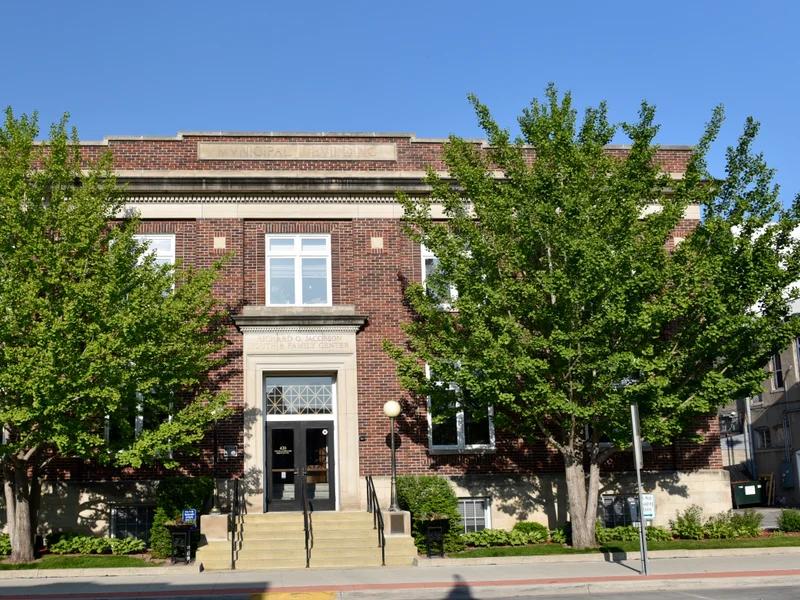
Iowa City short-term rental market

#4

Iowa City

Investors targeting Iowa City will find a stable market with 552 active listings generating a gross yield of 12.4% and an average daily rate of $191. The market supports a 40% occupancy rate and an annual revenue of $28,850, offering a moderate but reliable entry point for short-term rental buyers.

Yield

13.8%

Revenue

$32.6K

Listings

585

Ames short-term rental market

#5

Ames

Ames presents a niche opportunity for short-term rental buyers, featuring 202 active listings and a gross yield of 12.3%. Although the average daily rate is a solid $211, the low occupancy rate of 29% limits the average annual revenue to $23,644 for local operators.

Yield

12.3%

Revenue

$24.1K

Listings

206

Davenport short-term rental market

#6

Davenport

The Davenport short-term rental market presents a compelling 10.6% gross yield and a moderate average daily rate of $170 for prospective buyers. With 323 active listings generating $23,974 in annual revenue, investors should note the 37% occupancy rate when projecting their potential cash flow and portfolio growth.

Yield

12.2%

Revenue

$27.8K

Listings

324

Sioux City short-term rental market

#7

Sioux City

In Sioux City, a low-density market of just 128 active listings allows short-term rental investors to capture an 8.1% gross yield. However, buyers must budget carefully for a low occupancy rate of 28% and a modest annual revenue of $18,278 based on a $181 ADR.

Yield

9.4%

Revenue

$21.5K

Listings

132

Des Moines short-term rental market

#8

Des Moines

The Des Moines short-term rental market provides investors with an 8.0% gross yield and a steady occupancy rate of 35%. While the annual revenue of $25,520 and ADR of $181 are modest, the 677 active listings suggest a moderately sized market with room for strategic operators.

Yield

9.2%

Revenue

$29.5K

Listings

696

All Iowa Short-Term Rental Markets

Every market below links to its full BNBCalc market page. Rankings use gross yield first, then annual revenue when yield is missing.

Active listings are Airbnb and Vrbo listings observed as active in the selected market metadata segment. The all-bedrooms view uses all active listings in that market; bedroom filters use the active listing count for the selected bedroom group.

RankMarketGross yieldAnnual revenueMonthly revenueADROccupancyListingsPurchase price
#1Dubuque16.1%$42,320$3,527$28134%832$263,296
#2Spencer15.5%$32,115$2,676$29327%220$207,135
#3Waterloo14.0%$30,781$2,565$19637%254$219,706
#4Iowa City13.8%$32,564$2,714$17745%585$236,307
#5Ames12.3%$24,106$2,009$19431%206$195,636
#6Davenport12.2%$27,757$2,313$16641%324$228,379
#7Sioux City9.4%$21,521$1,793$16834%132$228,651
#8Des Moines9.2%$29,493$2,458$17840%696$320,760

How We Rank Markets

For US markets, BNBCalc ranks state market pages by gross yield: annual Airbnb and Vrbo short-term rental revenue divided by estimated property value. Gross yield is a fast way to compare market-level opportunity before operating expenses, financing, taxes, insurance, seasonality, and local rules.

  • Annual revenue uses ADR, adjusted occupancy, and estimated cleaning revenue when cleaning and stay data exists.

  • ADR is nightly-only and excludes cleaning fees and other guest fees.

  • Occupancy is adjusted occupancy of bookable nights, excluding host-blocked nights.

  • Gross yield uses annual revenue divided by estimated property value; it does not include operating expenses, financing, taxes, or local regulation risk.

Compare Rental Demand in Iowa

For long-term rental context, compare statewide Section 8 Fair Market Rent data alongside short-term rental market performance.

Frequently Asked Questions About Iowa Airbnb and Vrbo Markets