8 tracked markets

Source: BNBCalc market metadata · Reviewed by Parker Place, CTO of BNBCalc.com · Data updated July 10, 2026

Best Airbnb Markets in Indiana by Gross Yield

Michigan City is the top Indiana short-term rental market across Airbnb and Vrbo by gross yield, with 18.2% gross yield, $46,263 in average annual revenue, and 755 active listings.

Top gross yield

18.2%

Michigan City

Median gross yield

14.5%

8 markets with yield data

Median annual revenue

$38.3K

Average listing revenue

Tracked markets

8

Statewide market coverage

Filter market rankings

Default rankings show all bedrooms at the average performance tier.

Bedroom count

Performance tier

Top 10 Indiana Airbnb and Vrbo Markets

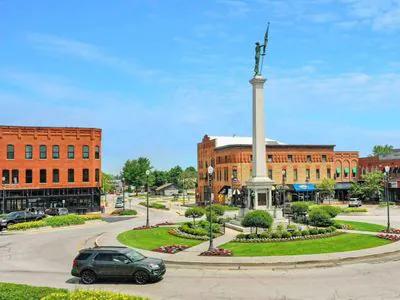
Michigan City short-term rental market

#1

Michigan City

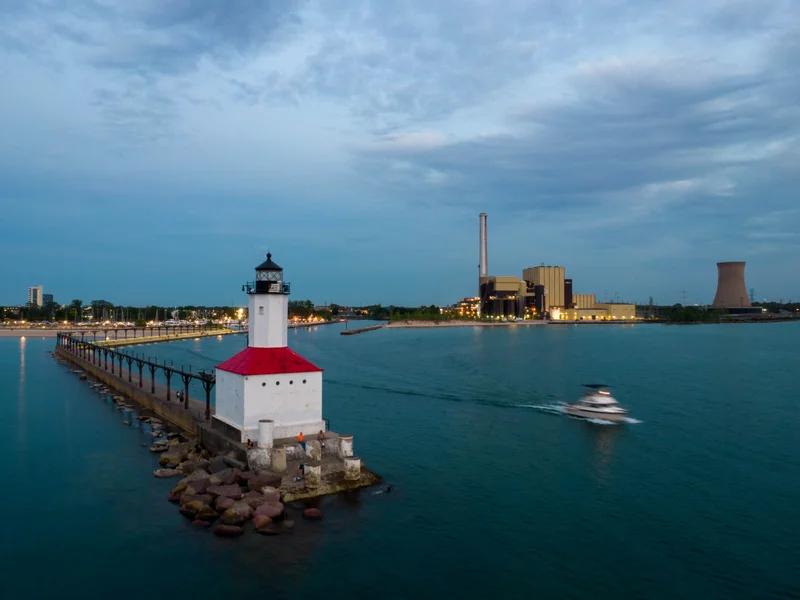
Michigan City presents an attractive opportunity for short-term rental investors, boasting a 16.7% gross yield and $42,040 in annual revenue. To succeed among the 716 active listings, hosts must navigate a 36% occupancy rate while leveraging the strong average daily rate of $297.

Yield

18.2%

Revenue

$46.3K

Listings

755

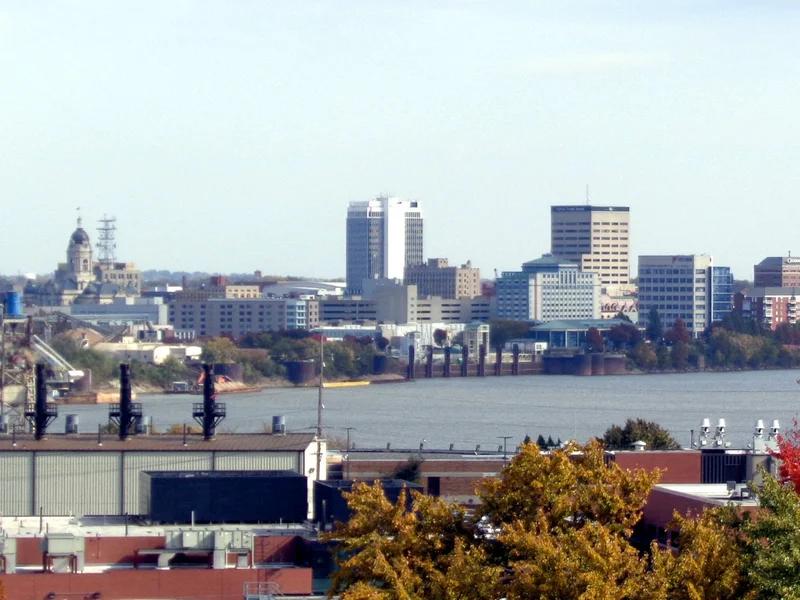
Evansville short-term rental market

#2

Evansville

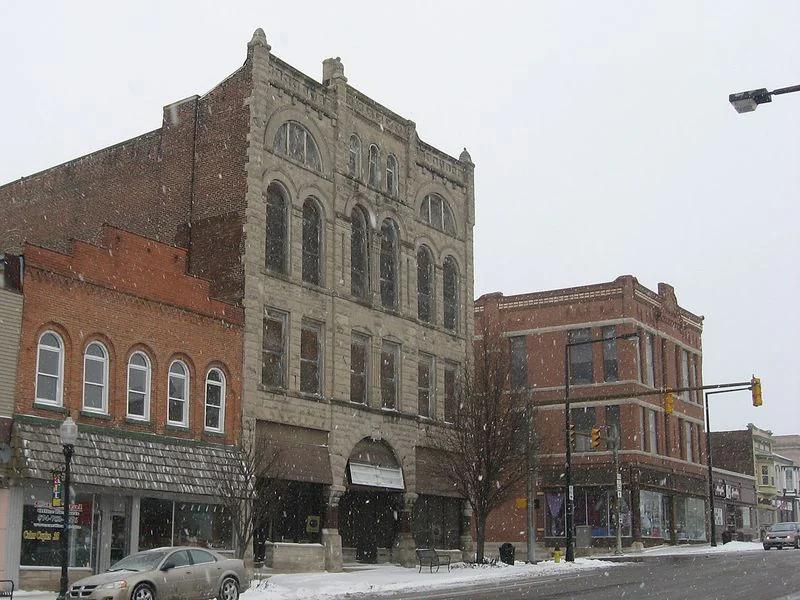
In Evansville, short-term rental properties deliver a solid 15.2% gross yield and a steady 36% occupancy rate. To successfully capture the $25,577 in annual revenue, active investors must navigate 888 active listings while pricing their properties competitively around the market's $174 average daily rate.

Yield

17.5%

Revenue

$30.2K

Listings

922

South Bend short-term rental market

#3

South Bend

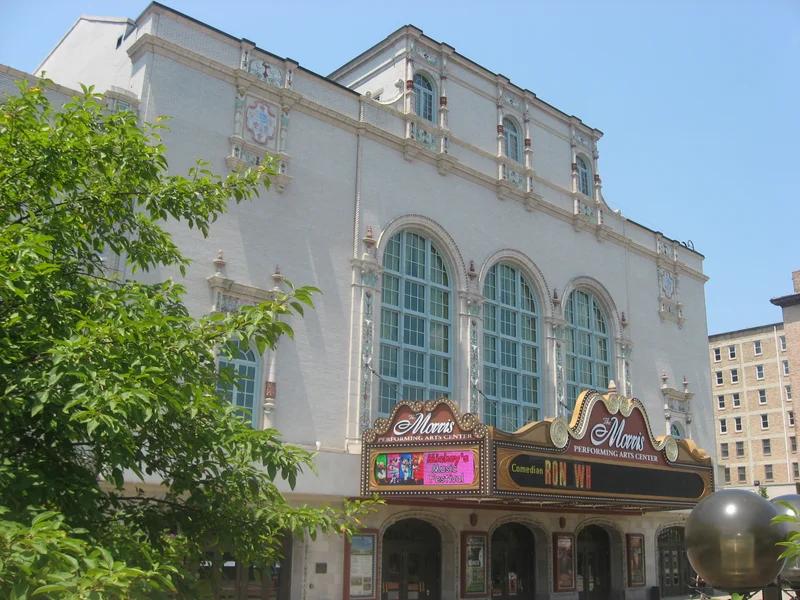
South Bend offers short-term rental investors a strong $398 average daily rate, driving a 13.3% gross yield and $41,203 in annual revenue. However, the low 28% occupancy rate across 1,321 active listings suggests that demand is highly seasonal, requiring owners to maximize peak periods to maintain profitability.

Yield

17.4%

Revenue

$55.2K

Listings

1,386

Indianapolis short-term rental market

#4

Indianapolis

In Indianapolis, short-term rental investors can capitalize on a solid 13.1% gross yield and a steady average daily rate of $212. While the market features a substantial 2,830 active listings, managing the relatively low 38% occupancy rate is crucial to consistently achieving the area's average annual revenue of $32,767.

Yield

15.1%

Revenue

$38.3K

Listings

2,972

Bloomington short-term rental market

#5

Bloomington

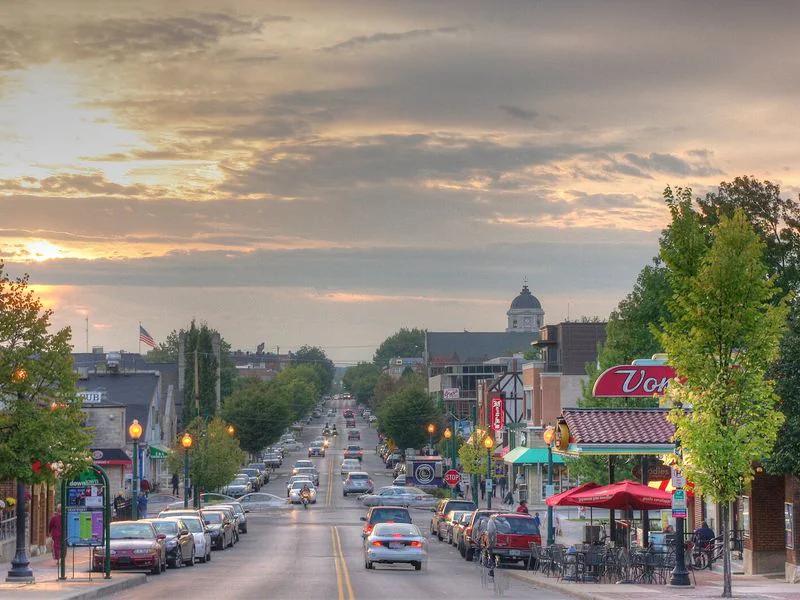
The Bloomington short-term rental market delivers a solid 12.7% gross yield and an attractive average daily rate of $299. However, with 494 active listings, investors must focus on maximizing property appeal to overcome a low 30% occupancy rate and capture the average annual revenue of $36,591.

Yield

13.9%

Revenue

$40.8K

Listings

508

Logansport short-term rental market

#6

Logansport

Logansport, Indiana offers short-term rental investors a solid 12.1% gross yield and a healthy average daily rate of $229 across 239 active listings. However, buyers must carefully weigh this yield against a low 29% occupancy rate and limited annual revenue of $24,848.

Yield

13.7%

Revenue

$28.7K

Listings

253

Angola short-term rental market

#7

Angola

The Angola short-term rental market presents a solid 10.3% gross yield and an average daily rate of $246 for prospective buyers. However, with a low 32% occupancy rate across 234 active listings, investors must focus on property differentiation to consistently capture the market's $30,143 in annual revenue.

Yield

12.9%

Revenue

$38.3K

Listings

244

Fort Wayne short-term rental market

#8

Fort Wayne

In Fort Wayne, short-term rental investors can achieve an 8.8% gross yield with an average daily rate of $174. While there are 480 active listings, the 37% occupancy rate means properties must be priced competitively to reach the average annual revenue of $23,082.

Yield

9.8%

Revenue

$26.0K

Listings

487

All Indiana Short-Term Rental Markets

Every market below links to its full BNBCalc market page. Rankings use gross yield first, then annual revenue when yield is missing.

Active listings are Airbnb and Vrbo listings observed as active in the selected market metadata segment. The all-bedrooms view uses all active listings in that market; bedroom filters use the active listing count for the selected bedroom group.

RankMarketGross yieldAnnual revenueMonthly revenueADROccupancyListingsPurchase price
#1Michigan City18.2%$46,263$3,855$26741%755$254,197
#2Evansville17.5%$30,190$2,516$16742%922$172,187
#3South Bend17.4%$55,237$4,603$37536%1,386$316,663
#4Indianapolis15.1%$38,251$3,188$20444%2,972$252,848
#5Bloomington13.9%$40,829$3,402$27935%508$292,898
#6Logansport13.7%$28,697$2,391$21634%253$208,963
#7Angola12.9%$38,278$3,190$25436%244$297,732
#8Fort Wayne9.8%$26,020$2,168$16144%487$264,939

How We Rank Markets

For US markets, BNBCalc ranks state market pages by gross yield: annual Airbnb and Vrbo short-term rental revenue divided by estimated property value. Gross yield is a fast way to compare market-level opportunity before operating expenses, financing, taxes, insurance, seasonality, and local rules.

  • Annual revenue uses ADR, adjusted occupancy, and estimated cleaning revenue when cleaning and stay data exists.

  • ADR is nightly-only and excludes cleaning fees and other guest fees.

  • Occupancy is adjusted occupancy of bookable nights, excluding host-blocked nights.

  • Gross yield uses annual revenue divided by estimated property value; it does not include operating expenses, financing, taxes, or local regulation risk.

Compare Rental Demand in Indiana

For long-term rental context, compare statewide Section 8 Fair Market Rent data alongside short-term rental market performance.

Frequently Asked Questions About Indiana Airbnb and Vrbo Markets