
Kostenlose Sofortanalyse
Airbnb-Umsatz für jede Adresse oder Stadt anzeigen
How to Analyze an Airbnb Investment Property: The Complete STR Guide
You found a property that looks promising. Maybe it's near the beach, or in a mountain town, or just outside a major tourist attraction. The listing photos are gorgeous, and you can already picture the five-star reviews rolling in.
But here's the thing: most Airbnb investors lose money because they buy on emotion instead of data.
I've seen it happen dozens of times. Someone falls in love with a property, convinces themselves the numbers "will work out," and ends up with a cash-flow-negative nightmare that eats into their savings every month.
This guide will show you exactly how to analyze a short-term rental investment before you buy—the same process I use for every property in my portfolio.
The 5 Numbers That Make or Break an Airbnb Investment
Before you get lost in granite countertops and hot tub dreams, you need to understand five core metrics. These numbers tell you whether a property will make money or drain your bank account.
1. Average Daily Rate (ADR)
What it is: The average nightly price your property will command.
Why it matters: ADR is half of your revenue equation. A property with $200 ADR and 60% occupancy generates $43,800/year. The same property at $150 ADR? Only $32,850.
According to Mashvisor's 2025 market data, ADR varies dramatically by market—from budget-friendly midwest destinations at $80-120/night to premium coastal markets commanding $400+ per night.
"The gap between premium and mainstream markets is widening. Rancho Palos Verdes, CA shows $817 ADR while mid-tier suburbs struggle to maintain pricing power."
2. Occupancy Rate
What it is: The percentage of available nights that are actually booked.
Why it matters: Occupancy is the other half of your revenue equation. High ADR means nothing if your calendar is empty.
Mashvisor reports that the average US occupancy rate in spring 2025 is around 50%, down from 57% last year. This decline is due to:
- An influx of new short-term rental listings outpacing demand
- Inflation-induced belt-tightening among US travelers
- A lull in international arrivals
What's considered good? Analysts now label 55%+ occupancy as "good" performance—a realistic yet competitive benchmark you should aim to beat through dynamic pricing, quality photos, and amenity upgrades.
3. Gross Revenue
What it is: ADR × Occupancy Rate × 365 days
Example calculation:
- ADR: $175/night
- Occupancy: 58%
- Annual Revenue: $175 × 0.58 × 365 = $37,047
This is your top-line number before any expenses.
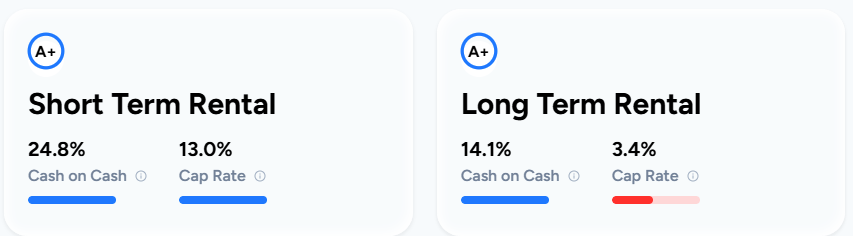
4. Cash-on-Cash Return
What it is: Your annual cash flow divided by the total cash you invested.
Formula: (Annual Revenue - All Expenses - Debt Service) ÷ Total Cash Invested × 100
This is the single most important metric for STR investors. As BiggerPockets explains:
"Cash-on-cash return is one of the most important return on investment (ROI) measurements in real estate. Fortunately, it's also very easy to understand."
STR Cash-on-Cash Benchmarks:
| Performance | Cash-on-Cash | What It Means |
|---|---|---|
| Exceptional | 20%+ | Top-tier, rare find |
| Excellent | 15-20% | Strong performer |
| Good | 10-15% | Solid investment |
| Fair | 7-10% | Proceed with caution |
| Poor | Below 7% | Likely not worth the effort |
According to Mashvisor's analysis of the top 25 STR markets, median cash-on-cash returns range between 6.16% and 7.45%. Properties exceeding these benchmarks are outperforming the market.
5. Cap Rate
What it is: Net Operating Income ÷ Property Value × 100
Why it matters: Cap rate strips away financing to show the property's inherent profitability. It's useful for comparing deals across different markets and financing scenarios.
"Cap rate is not a measurement of investment performance or return—it is a measurement of market sentiment."
For STRs, target a cap rate of 6% or higher. Anything below 4% is a red flag unless you're in a high-appreciation market.
STR Operating Expenses: What Most Investors Miss
Here's where new Airbnb investors get burned. They calculate revenue, subtract the mortgage, and think they're done. Wrong.
Short-term rentals have significantly higher operating costs than long-term rentals. As BiggerPockets emphasizes:
"PITI (principal, interest, taxes, and insurance) still dominates the expense category—but real expenses accustomed to STRs need to be included so you can see the actual operating costs. It is not just a mortgage and utilities payment each month!"
Complete STR Expense Checklist
| Expense Category | Typical Cost | Notes |
|---|---|---|
| Mortgage (P&I) | Varies | Your biggest fixed cost |
| Property Taxes | 1-2% of value/year | May differ for STRs in some areas |
| Insurance | +20% vs. traditional | STRs require specialized coverage |
| Utilities | $200-500/month | You pay ALL utilities—guests use more than you'd expect |
| Internet | $50-100/month | High-speed is non-negotiable |
| Cleaning | $75-200/turnover | Your second-biggest variable cost |
| Property Management | 20-30% of revenue | If not self-managing |
| Platform Fees | 3-15% of booking | Airbnb, VRBO commissions |
| Supplies | $100-300/month | Toiletries, linens, kitchen essentials |
| Maintenance/Repairs | 5-10% of revenue | Things break faster with constant guest turnover |
| Furnishing Reserve | $200-500/month | Furniture wears out and needs replacement |
| Lawn/Pool/Hot Tub | $100-400/month | Property-specific amenities |
| Permits/Licenses | Varies | Required in many jurisdictions |
| Occupancy Taxes | 6-15% of revenue | Many cities require STR-specific taxes |
"If you plan to use a management company or software to handle your STR, make sure you build those fees into the budget. Features unique to your property—pool/hot tub maintenance, pest control, security—need consideration."
Pro tip: I budget 35-45% of gross revenue for total operating expenses (excluding debt service). If your numbers only work at 25%, you're probably missing something.
How to Analyze an Airbnb Property: Step-by-Step
Here's the exact process I use before making an offer on any STR property.
Step 1: Check If STRs Are Even Legal
Before you run a single number, verify that short-term rentals are allowed in your target market. Many cities have banned or heavily restricted Airbnb-style rentals.
Check for:
- Zoning restrictions
- Permit requirements
- Occupancy limits
- Minimum stay requirements
- HOA restrictions (if applicable)
A property with amazing numbers is worthless if you can't legally operate it.
Step 2: Estimate Revenue with Data
Don't guess. Use actual market data to estimate your revenue potential.
BiggerPockets recommends two approaches:
Option 1: Use a data tool
"Your first option is AirDNA, which provides all the relevant data you need to run a good analysis of an STR deal. They show high-level stats about the market and occupancy rates, and ADR by month, enabling you to thoroughly analyze your potential rental income."
Option 2: Manual research
"If you don't want to pay for the data, you can determine occupancy rates by clicking on any property calendar on Airbnb. This lets you see how many days a property is occupied for the month. Make sure you're thorough—look at several properties that are good comps and look at their calendars year-round to account for seasonality."
Or use BNBCalc—we pull comparable properties automatically and let you adjust assumptions based on your specific situation.
Step 3: Account for Seasonality
This is where many investors get blindsided. A beach house that crushes it in summer might sit empty for four months in winter.
"Seasonal variance will affect your numbers. For example, in Denver, a 1-bedroom rental near downtown saw a 30 percent decrease in interest from November through March."
Always analyze full-year revenue, not just peak season projections.
Step 4: Build Your Expense Budget
Use the expense checklist above to build a complete operating budget. Be conservative—it's better to be pleasantly surprised than underwater.
Step 5: Calculate Your Returns
With revenue and expenses estimated, calculate:
- Net Operating Income (NOI) = Gross Revenue - Operating Expenses
- Cash Flow = NOI - Debt Service (mortgage payments)
- Cash-on-Cash Return = Annual Cash Flow ÷ Total Cash Invested
- Cap Rate = NOI ÷ Purchase Price
Step 6: Analyze the Competition
Before finalizing your analysis, study your competition. BiggerPockets calls this the "enemy method":
"Evaluate the comps to see where you should fall amongst them and where you can outperform them. If all of the listings have terrible photography, you can immediately outperform most of them. If you are the only one in the area with a hot tub or pool or amenity that is sought after, you can outperform."
Look for gaps you can exploit—better photos, unique amenities, superior guest communication.
Best Markets for Airbnb Investment in 2025
Not all markets are created equal. Mashvisor's 2025 analysis identified top-performing markets using these criteria:
- Median property price under $1,000,000
- At least 100 active STR listings (proves demand)
- Minimum 2.00% cash-on-cash return
- Occupancy rate of 50% or more
Emerging Markets to Watch
According to Mashvisor's fastest-growing markets report, secondary and tertiary cities are seeing explosive growth:
| Market | YoY Listing Growth | Why It's Growing |
|---|---|---|
| San Gabriel, CA | +709% | LA overflow, Asian food tourism |
| Davenport, FL | +707% | Minutes from Disney World |
| Winter Haven, FL | Strong growth | "Goldilocks" market—strong occupancy, rising returns |
| Wilmington, NC | Growing | Coastal revival, film industry boom |
| Saratoga, NY | Growing | Racing season summer crowds |
"Smaller cities like San Gabriel, Davenport, and Winter Haven are emerging as 'goldilocks' markets with strong occupancy and rising returns."
Markets to Approach with Caution
Be careful in oversaturated markets where supply has outpaced demand. Mashvisor notes:
"The decline in occupancy is due to an influx of new short-term rental listings that have outpaced demand growth, inflation-induced belt-tightening among US travelers, and a lull in international arrivals amid ongoing political uncertainties."
Signs of an oversaturated market:
- Occupancy rates below 45%
- Rapidly increasing listing counts
- Aggressive price cutting among hosts
- Long "days on market" for existing listings
Common Airbnb Investment Mistakes (And How to Avoid Them)
After years of analyzing STR deals, I've seen the same mistakes over and over.
Mistake #1: Using Peak Season Numbers Year-Round
That mountain cabin might book at $400/night during ski season—but what about mud season? Always use annual averages, not best-case scenarios.
Mistake #2: Underestimating Turnover Costs
Every guest checkout triggers cleaning costs, supply restocking, and potential maintenance. A property with 100 turnovers per year can easily spend $15,000+ on cleaning alone.
Mistake #3: Ignoring Regulation Risk
STR regulations are tightening across the country. A market that's STR-friendly today might not be tomorrow. Factor regulatory risk into your analysis.
Mistake #4: Forgetting About Furnishing
Unlike long-term rentals, you're responsible for furnishing the entire property—beds, couches, kitchenware, linens, towels, everything. Budget $10,000-30,000+ for initial setup, plus ongoing replacement reserves.
Mistake #5: Assuming You'll Beat Market Averages
Everyone thinks their property will be the exception. Maybe it will be—but run your numbers assuming average performance first. If the deal only works at 80% occupancy when the market average is 55%, walk away.
"If your annual principal and interest payments alone are $80,000 and the data says you will only gross $50,000, it is so far off that it probably won't work even if you outperform your competitors."
When the Numbers Don't Work (But the Deal Might Still Make Sense)
Here's something I've learned: cash flow isn't everything.
A property with mediocre STR returns might still be a smart investment if:
- You'll use it personally — A beach house you enjoy 6 weeks/year has lifestyle value the numbers don't capture
- Appreciation is strong — Some markets trade cash flow for equity gains
- Tax benefits are significant — Bonus depreciation can offset lower cash returns
- It's a value-add opportunity — A tired property might perform much better post-renovation
"I bought a $630,000 property in St. Petersburg and took a $140,000 tax deduction through bonus depreciation in Year 1. That turned a good deal into an incredible one. Add in 15% appreciation over two years from Florida's net migration boom, and the cash-on-cash return was just one piece of a much bigger picture."
— Parker Place, Founder of BNBCalc
The key is understanding why you're making the investment—and being honest about whether the numbers support your thesis.
Run Your Own STR Analysis
Ready to analyze a specific property? Here's what you need:
- Property details — Address, purchase price, bedrooms/bathrooms
- Financing terms — Down payment, interest rate, loan term
- Market data — Comparable ADR and occupancy rates
- Expense estimates — Use the checklist above
Plug these into BNBCalc's free Airbnb calculator and get your cash-on-cash return, cap rate, and Investor Score in seconds.
Don't buy on emotion. Buy on data.
Airbnb Tax Deduction Calculator
Paying too much in taxes? We have the perfect solution. Simulate an Airbnb home purchase below.
Purchase Price
$450K
Structure Value
70%
Apply Trump's Tax Cut (Bonus Depreciation)
Depreciation
$117,695
Interest
$21,600
Tax
$6,750
Year 1 Deduction
$146,045
Want to claim this deduction? Get a free cost segregation benefit analysis from CSA Partners — no obligation.
Get Full Analysis