
Free instant analysis
Reveal Airbnb revenue for any address or city
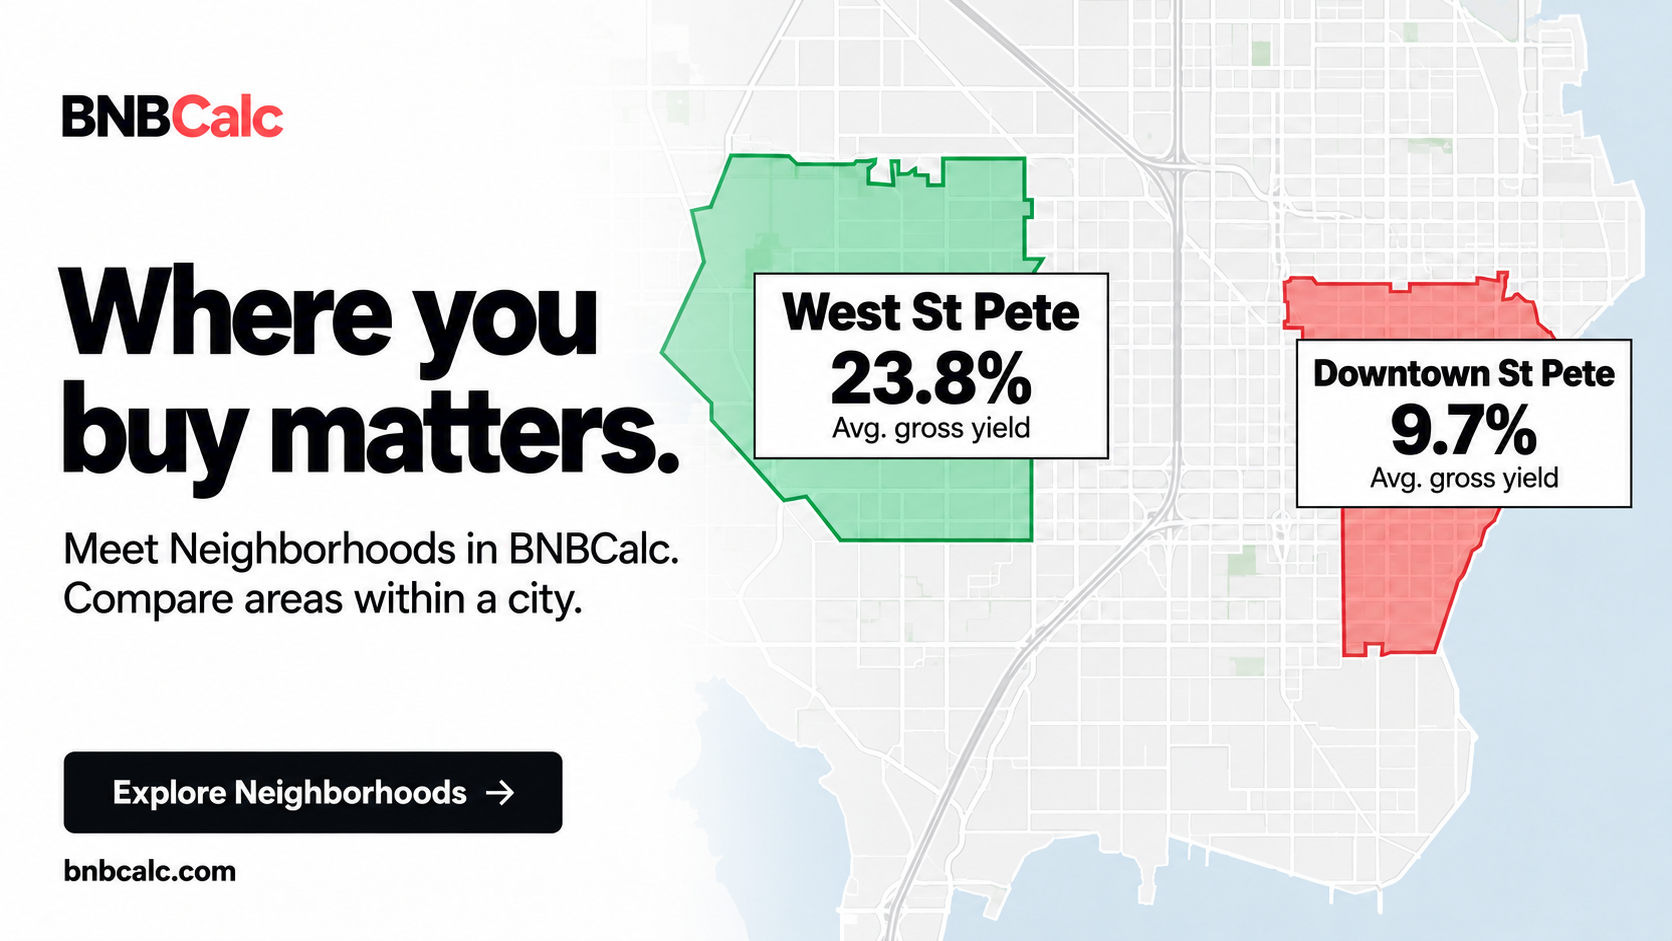
Today, we're introducing Neighborhoods in BNBCalc Markets: a new way to compare Airbnb submarkets by gross yield and narrow your search within a city.
Submarkets are the smaller local areas inside a broader market. Neighborhoods helps you see how their earning potential compares with home prices, then explore the listings behind the numbers.
Why I built Neighborhoods
I was looking for an Airbnb in the Tampa area, and my search was too broad.
I wanted the best bang for my buck: a property with strong earning potential at a price that made sense. But I hadn't narrowed down where to look.
I kept seeing the same destinations come up on social media: the Smoky Mountains, Kissimmee, Joshua Tree. I wanted a way to find opportunities based on the numbers, including places that weren't filling my feed.
Even after focusing on Tampa, I still had a lot of ground to cover. A market-wide average could give me context. I needed to compare the smaller areas inside it.
That problem is why we built Neighborhoods in BNBCalc Markets.
Compare Airbnb submarkets by gross yield
Neighborhoods brings a map and a ranked list of local areas into the same view. Compare gross yield to find areas with stronger earning potential for the price.
Gross yield compares potential annual rental revenue with estimated home price, before expenses and financing. It helps put a high revenue number in context; it is not take-home profit.
You can also compare estimated revenue, occupancy, nightly rates, and home prices, then open the listings in an area that interests you.
That last part matters to me. A high revenue number is only one piece of the decision. I also want to know what it might cost to buy there.
You can narrow the comparison by bedroom count, too. If I'm looking for a three-bedroom home, I want a starting point that reflects the kind of property I'm considering.
Local areas I can put a name to
I also wanted a map that felt closer to how people talk about a place.
When you're trying to learn an area, neighborhood names help you get your bearings. Having to translate between ZIP codes, a map, and the places people actually mention adds work.
We built Neighborhoods around named local areas, so you can move from a broad market to somewhere you can picture and research further.
The area names and boundaries are a research guide; they aren't official zoning boundaries.
From a broad search to a shortlist
Here's how I'd start in Tampa:
- Open Neighborhoods and compare the areas by gross yield.
- Choose the bedroom count that fits the home you're looking for.
- Look at revenue alongside estimated home prices, then open the listings in the areas that stand out.
Once an address makes the shortlist, the BNBCalc Calculator helps work through that specific property's numbers, including expenses and financing.
This is the workflow I wanted for my own search: a clearer way to decide where to spend my time.
The figures are estimates. Before buying, check the individual property, local rental rules, and the costs of owning and operating it.
Explore Neighborhoods in BNBCalc Markets
BNBCalc Markets covers 2,300+ markets worldwide. Neighborhoods adds a closer look inside supported US markets, including Tampa.
If your search area feels too broad, start with a city you know and compare the areas within it.
Explore Tampa's neighborhoods →
— Parker
Airbnb Tax Deduction Calculator
Paying too much in taxes? We have the perfect solution. Simulate an Airbnb home purchase below.
Purchase Price
$450K
Structure Value
70%
Apply Trump's Tax Cut (Bonus Depreciation)
Depreciation
$117,695
Interest
$21,600
Tax
$6,750
Year 1 Deduction
$146,045
Want to claim this deduction? Get a free cost segregation benefit analysis from CSA Partners — no obligation.
Get Full Analysis