
Análisis instantáneo gratuito
Revele los ingresos de Airbnb para cualquier dirección o ciudad
Understanding the BNBCalc Investor Score: A Data-Driven Approach to Real Estate Analysis
When you're analyzing dozens of potential investment properties, you need a way to quickly separate the winners from the losers. That's exactly why we built the Investor Score—a standardized grading system that distills complex financial metrics into a single, actionable letter grade.
Every analysis on BNBCalc includes two separate Investor Scores:
- Short-Term Rental (STR) Investor Score — for Airbnb/VRBO strategies
- Long-Term Rental (LTR) Investor Score — for traditional rental strategies
Each score is shown as a letter grade (A+ through F) and color-coded for instant interpretation. Let's break down exactly how it works.
The Two Metrics That Matter Most
The Investor Score is built on two foundational metrics that real estate investors have relied on for decades. As the team at BiggerPockets puts it, these are "the most important return on investment measurements in real estate."
Cash-on-Cash Return (85% Weight)
What it is: Your annual pre-tax cash flow divided by the total cash you invested upfront.
Formula: Annual Cash Flow ÷ Total Cash Invested × 100
Why it matters: Cash-on-cash return tells you how hard your actual dollars are working. Unlike cap rate, it accounts for your financing—making it essential when you're using leverage.
BiggerPockets defines it clearly: "Cash-on-cash return is one of the most important return on investment (ROI) measurements in real estate. Fortunately, it's also very easy to understand."
So what's a good target? According to Mashvisor's 2025 STR market analysis, "A good ROI for short-term rentals typically falls between 5% and 10%, depending on location, property type, and management efficiency. In some high-demand markets, investors may achieve ROIs exceeding 12%."
Their research showed the top 25 STR markets delivering median cash-on-cash returns between 6.16% and 7.45%. Properties exceeding these benchmarks are outperforming the market.
Cap Rate (15% Weight)
What it is: Your Net Operating Income (NOI) divided by the property's value.
Formula: NOI ÷ Property Value × 100
Why it matters: Cap rate strips away financing to reveal the property's inherent profitability—ideal for comparing deals across different markets and financing scenarios.
BiggerPockets explains: "The capitalization rate is the rate of return an investor can expect from an investment in real estate, assuming they pay all cash."
But here's an important nuance that many investors miss. As BiggerPockets notes in their guide to proper cap rate usage: "Cap rate is not a measurement of investment performance or return—it is a measurement of market sentiment."
That's why we weight it at only 15%. Cap rate is useful for property comparison, but cash-on-cash tells you what actually hits your bank account.
For benchmarks, BiggerPockets suggests that "a cap rate of four to 10 percent can historically be viewed as a 'good' investment," though this varies significantly by market and property class.
How We Calculate the Score
BNBCalc converts each metric into a standardized score, then applies weights:
Investor Score = (Cash-on-Cash Score × 85%) + (Cap Rate Score × 15%)
The heavy weighting toward cash-on-cash reflects what actually matters to investors: how much money you're making on the cash you put in.
STR Benchmarks
| Metric | Excellent (Blue) | Good (Green) | Fair (Orange) | Poor (Red) |
|---|---|---|---|---|
| Cash-on-Cash | ≥ 13.5% | 10.5%–13.5% | 4.5%–10.5% | < 4.5% |
| Cap Rate | ≥ 7.2% | 5.6%–7.2% | 2.4%–5.6% | < 2.4% |
LTR Benchmarks
| Metric | Excellent (Blue) | Good (Green) | Fair (Orange) | Poor (Red) |
|---|---|---|---|---|
| Cash-on-Cash | ≥ 9.0% | 7.0%–9.0% | 3.0%–7.0% | < 3.0% |
| Cap Rate | ≥ 5.4% | 4.2%–5.4% | 1.8%–4.2% | < 1.8% |
These thresholds align with industry expectations. BiggerPockets reports that short-term rental expert Garrett Brown is "routinely getting twenty percent (or greater) returns by reinvesting in his short-term rentals." Our A+ threshold reflects this upper tier of performance.
Letter Grade Scale
| Score | Grade | Meaning |
|---|---|---|
| 110+ | A+ | Exceptional—top-tier investment |
| 90-109 | A | Excellent—strong performer |
| 70-89 | B | Good—solid fundamentals |
| 50-69 | C | Average—proceed with caution |
| 30-49 | D | Below average—significant concerns |
| 0-29 | F | Poor—likely negative cash flow |
Real Examples From Our Platform
Here's how the Investor Score works on actual properties analyzed on BNBCalc:
A+ Example: Santa Fe, New Mexico
106 Cam Espejo | 5 bed, 4 bath | $975,000
| Metric | Value | Rating |
|---|---|---|
| Cash-on-Cash | 39.8% | Excellent |
| Cap Rate | 16.4% | Excellent |
| Investor Score | A+ |
This property exemplifies what a top-tier STR investment looks like: nearly 40% cash-on-cash return with a 16%+ cap rate. These numbers far exceed what Mashvisor identifies as typical—placing this firmly in the exceptional category.
A Example: Sevilla, Spain
C. López Azme | 1 bed, 1 bath | €110,000
| Metric | Value | Rating |
|---|---|---|
| Cash-on-Cash | 27.9% | Excellent |
| Cap Rate | 12.4% | Excellent |
| Investor Score | A |
A lower-priced European property with strong fundamentals. The €27,987 cash needed makes this accessible while delivering returns that would make any investor happy.
B+ Example: Kissimmee, Florida
2421 Queenswood Cir | 3 bed, 2 bath | $386,600
| Metric | Value | Rating |
|---|---|---|
| Cash-on-Cash | 17.0% | Excellent |
| Cap Rate | 11.0% | Excellent |
| Investor Score | B+ |
A solid Orlando-area vacation rental. The 17% cash-on-cash significantly exceeds the 5-10% range that Mashvisor considers typical for STR investments.
C+ Example: Franklin, Massachusetts
72 Cross St | 3 bed, 1 bath | $536,100
| Metric | Value | Rating |
|---|---|---|
| Cash-on-Cash | 12.6% | Good |
| Cap Rate | 9.8% | Excellent |
| Investor Score | C+ |
A Northeast property with decent returns but higher entry costs. The cap rate is strong, but the cash-on-cash is moderate for an STR in this price range.
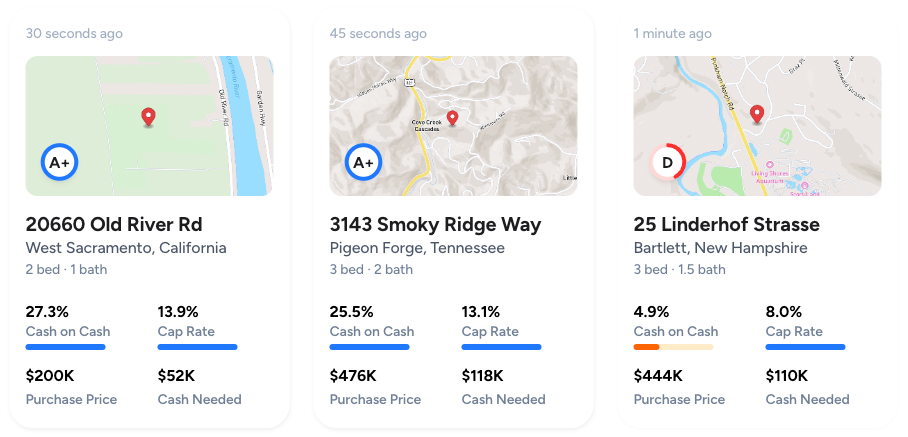
D Example: Bartlett, New Hampshire
25 Linderhof Strasse | 3 bed, 1.5 bath | $444,000
| Metric | Value | Rating |
|---|---|---|
| Cash-on-Cash | 4.9% | Fair |
| Cap Rate | 8.0% | Good |
| Investor Score | D |
This White Mountains property has a respectable cap rate but underwhelming cash-on-cash. At 4.9%, you're barely beating a high-yield savings account—and taking on significantly more risk and effort to do it.
Why You'll See Two Different Scores
The same property can perform very differently depending on your strategy. BiggerPockets notes that "the best potential for cashflow even now in this more difficult market comes from real estate"—but only if you choose the right strategy for each property.
Consider:
- A beachfront condo might earn an A+ as an Airbnb due to high nightly rates and seasonal demand
- That same condo could receive a D as a long-term rental if monthly rents don't justify the purchase price
This side-by-side scoring helps you quickly answer: "Is this property better as a short-term rental or a traditional rental?"
What the Investor Score Is (and Isn't)
It IS:
- A fast snapshot of deal quality
- A standardized way to compare properties across markets
- A starting point for deeper analysis
- Based on industry-standard metrics used by professional investors
It's NOT:
- A guarantee of performance
- A replacement for due diligence on local regulations
- An account of seasonality or execution risk
- A substitute for reviewing the assumptions and comparable properties
As BiggerPockets wisely cautions: metrics like cap rate have limitations—they don't "consider the time value of money and future cash flows, account leverage, and other real estate metrics." That's why we combine multiple metrics and encourage you to dig into the full analysis.
How to Improve a Property's Score
The Investor Score isn't fixed—it responds to your assumptions. Here's what moves the needle:
To increase Cash-on-Cash:
- Negotiate a lower purchase price
- Increase your down payment (reduces debt service)
- Raise ADR or occupancy assumptions (if supported by comps)
- Reduce operating expenses
To increase Cap Rate:
- Lower the purchase price
- Increase projected NOI (revenue minus expenses)
- Reduce management fees or other operating costs
Remember: the goal isn't to game the score—it's to model realistic scenarios and find properties where the fundamentals actually work.
Quick FAQs
Why is my STR score high but my LTR score low?
Short-term and long-term income are modeled differently. STRs can command 2-3x the monthly revenue of traditional rentals in the right markets, which dramatically impacts cash-on-cash return.
What's a "good" Investor Score?
Aim for B or higher. An A-rated property should be a strong performer with solid fundamentals. A+ properties are rare—they typically require either exceptional market dynamics or below-market purchase prices.
How does this compare to industry standards?
Our benchmarks align with what industry experts recommend. BiggerPockets reports that top STR investors are "routinely getting twenty percent (or greater) returns." Our excellent tier (13.5%+ CoC) reflects strong performance, while A+ (20%+) represents the exceptional upper tier.
Airbnb Tax Deduction Calculator
Paying too much in taxes? We have the perfect solution. Simulate an Airbnb home purchase below.
Purchase Price
$450K
Structure Value
70%
Apply Trump's Tax Cut (Bonus Depreciation)
Depreciation
$117,695
Interest
$21,600
Tax
$6,750
Year 1 Deduction
$146,045
Want to claim this deduction? Get a free cost segregation benefit analysis from CSA Partners — no obligation.
Get Full Analysis