Back
Top 5 Short Term Rental (STR) Calculators: A Comprehensive Guide for Airbnb Investors
Discover the best short-term rental calculators for Airbnb investors. Learn how these tools can help you analyze potential investments and optimize your returns.
January 16, 2024

Written by:
Domenico Norton
January 16, 2024

⚡️
Reveal any property's Airbnb profitability
Introduction
Investing in short-term rental properties presents a lucrative opportunity, especially in the thriving Airbnb market. However, success in this arena requires more than just an attractive property listing; it demands in-depth market analysis and strategic planning. This comprehensive guide delves into the top five Short Term Rental (STR) calculators, indispensable tools for both budding and seasoned Airbnb investors. Our goal is not just to inform but to establish ourselves as a beacon of authority in this rapidly evolving field.
Understanding STR Calculators
Short Term Rental Calculators are innovative tools designed to predict the potential revenue and returns of rental properties. These calculators offer insights into various metrics such as estimated annual revenue, average daily rates, occupancy rates, and more. They are vital in making informed investment decisions, helping you to understand the market before committing to a purchase.
Comparative Analysis of Top 5 STR Calculators
In the dynamic world of Airbnb investing, having the right STR calculator can make all the difference. Here, we compare the top five tools in the market, each with its unique features and benefits.
1. BNBCalc: Your All-in-One STR Calculator
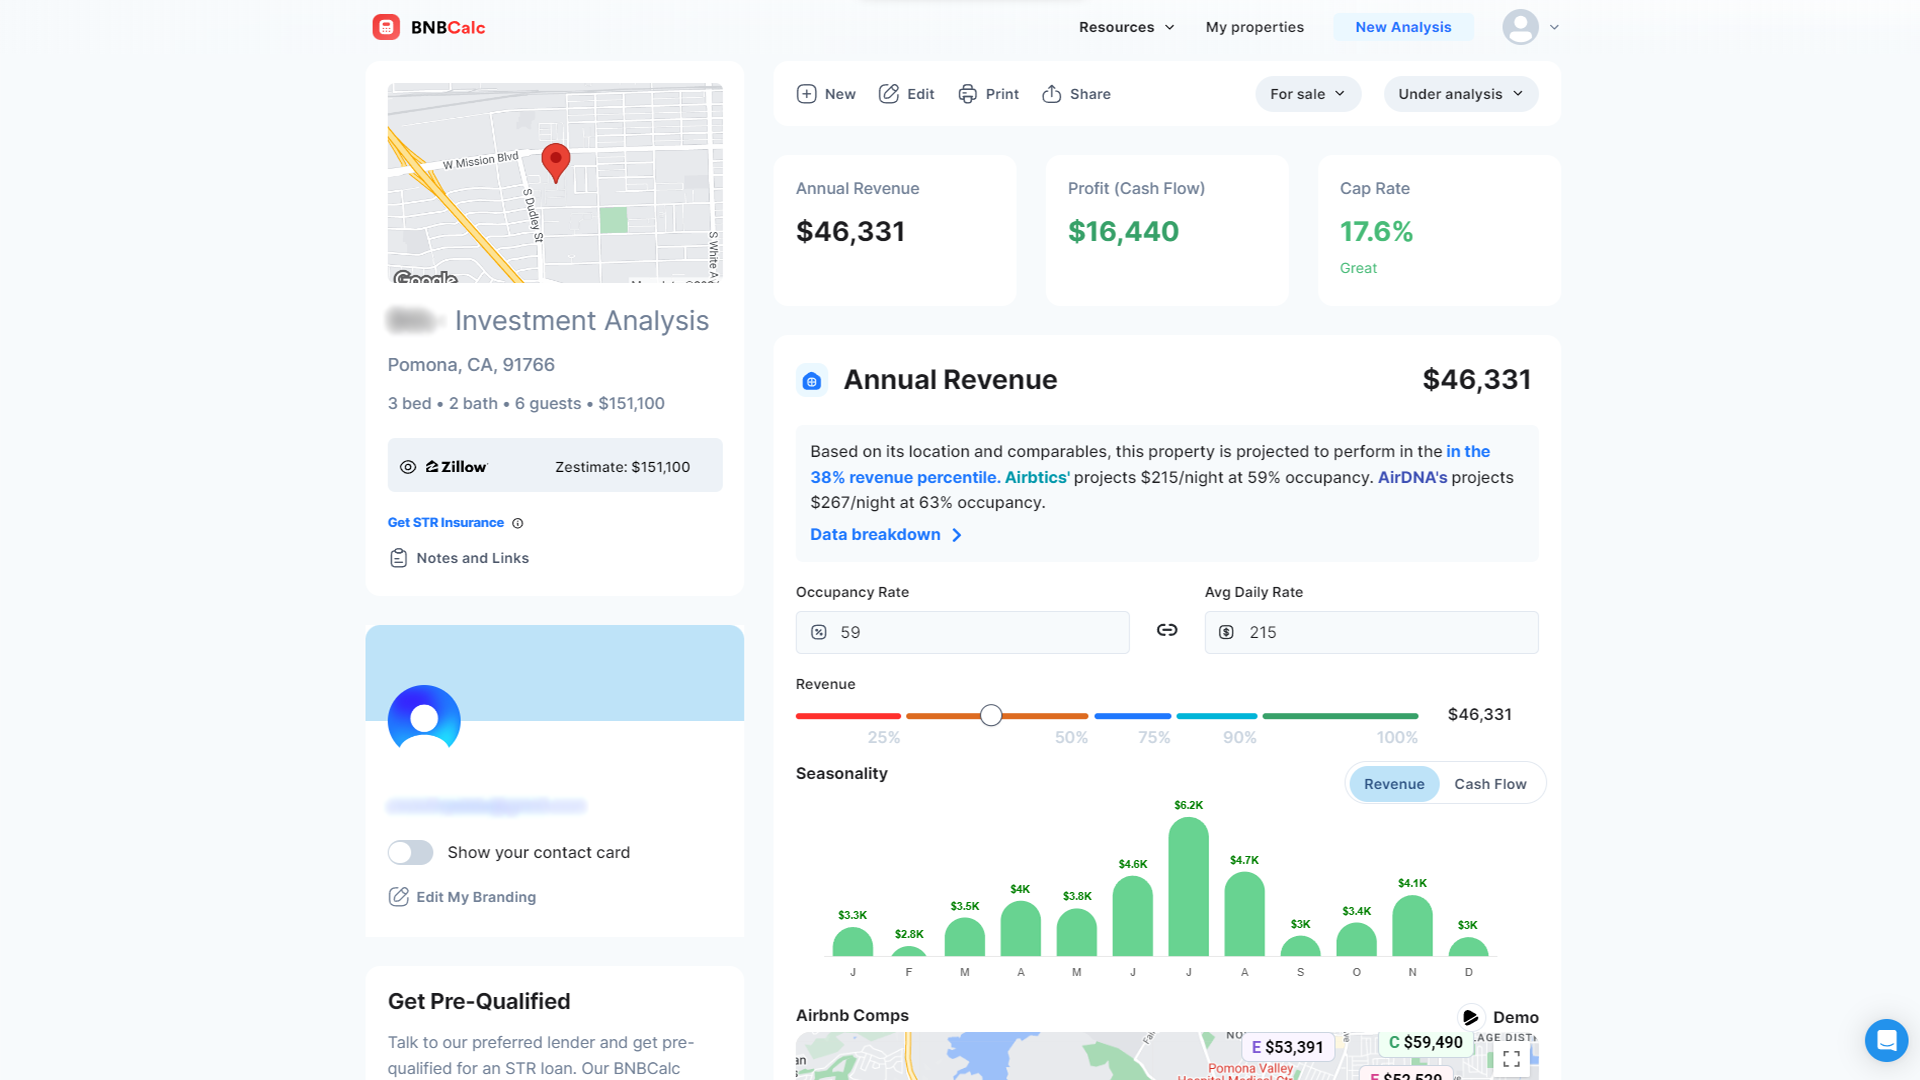
The BNBCalc is your go-to tool, offering a seamless experience for both novice and experienced investors. With this calculator, you can effortlessly determine the expected rental income and return on investment for short-term rental properties across the United States. What's more, it's incredibly user-friendly and gives in depth data. You simply need to create an account by supplying your email address or by linking your Google account, and you’re on your way to getting estimated calculations for your properties.
BNBCalc Estimator Data and Analytics
This short-term rental calculator offers a comprehensive analysis of essential Airbnb data points:
- Estimated annual revenue
- Average daily rate (ADR)
- Airbnb occupancy rate
- A list of comparable Airbnb rentals
- Tax Calculator
Whether you're a homeowner contemplating renting out an extra room or an experienced investor looking to expand your portfolio, BNBCalc has you covered. It even assists property managers in estimating their fees as a percentage of rental income, making it an invaluable tool for real estate professionals.
BNBCalc Cost
Here's the best part: the BNBCalc is entirely free to use on your seven-day trial. You can analyze as many properties as you want, without any hidden costs or data locked behind paywalls. It's all about providing you with the knowledge you need to make informed decisions. Once you have gotten acquainted with the system and your seven days are up, you can continue with your membership at the monthly rate ($29.99), or you can cancel your account.
BNBCalc Pros and Cons
Pros:
- Access to comprehensive, accurate Airbnb data
- Nationwide coverage
- User-friendly interface with no learning curve
- Free and Paid versions available
- Additional STR investment services available, including Tax Calculator and return metrics
Cons:
- Is not as accurate outside the US
- Doesn't offer analysis for multiunit properties
2. AirDNA: Unleash the Power of VRBO Data
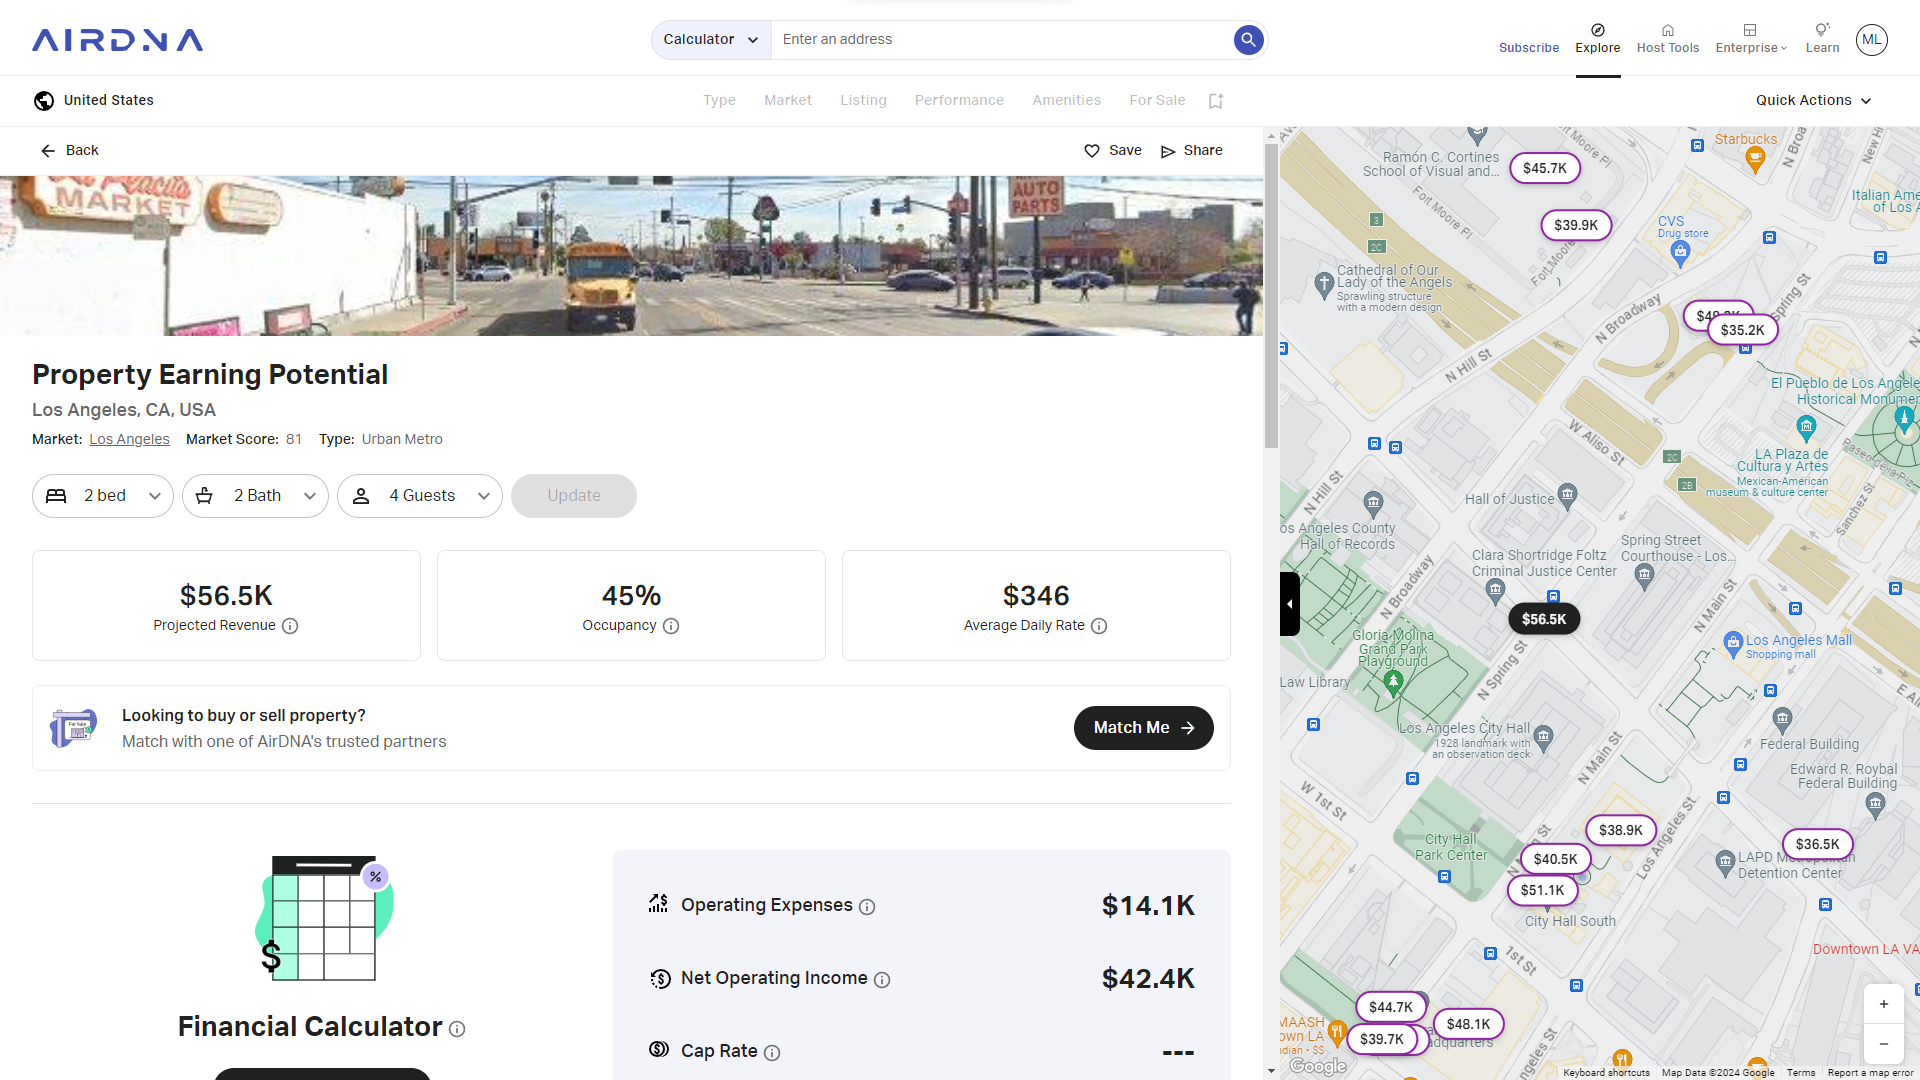
For those seeking a short-term rental calculator with a focus on VRBO data, the AirDNA Rentalizer is your answer. This versatile tool provides various data points and works seamlessly with both Airbnb and VRBO data. However, it's worth noting that extensive access comes at a price.
AirDNA Data and Analytics
AirDNA offers an array of data points, including annual revenue, average daily rate, occupancy rate, operating expenses, net operating income, cap rate, seasonal revenue forecasts, and a list of top comparison properties. These estimates are based on property details such as address, bedroom and bathroom count, and guest capacity.
AirDNA Cost
While AirDNA markets itself as free, this isn't entirely accurate. Free access provides limited data and analytics for a single market. For more extensive coverage, you'll need to subscribe, with pricing starting at $12 per month for a single neighborhood or city, and increasing significantly for broader market access.
AirDNA Pros and Cons
Pros:
- Access to both Airbnb and VRBO data
- Nationwide coverage
- In-depth analysis of critical data points
Cons:
- Limited free access
- Pricing can become prohibitive for extensive market analysis
- Some users report data inaccuracies
3. Rabbu: A Tight Budgets Best Friend
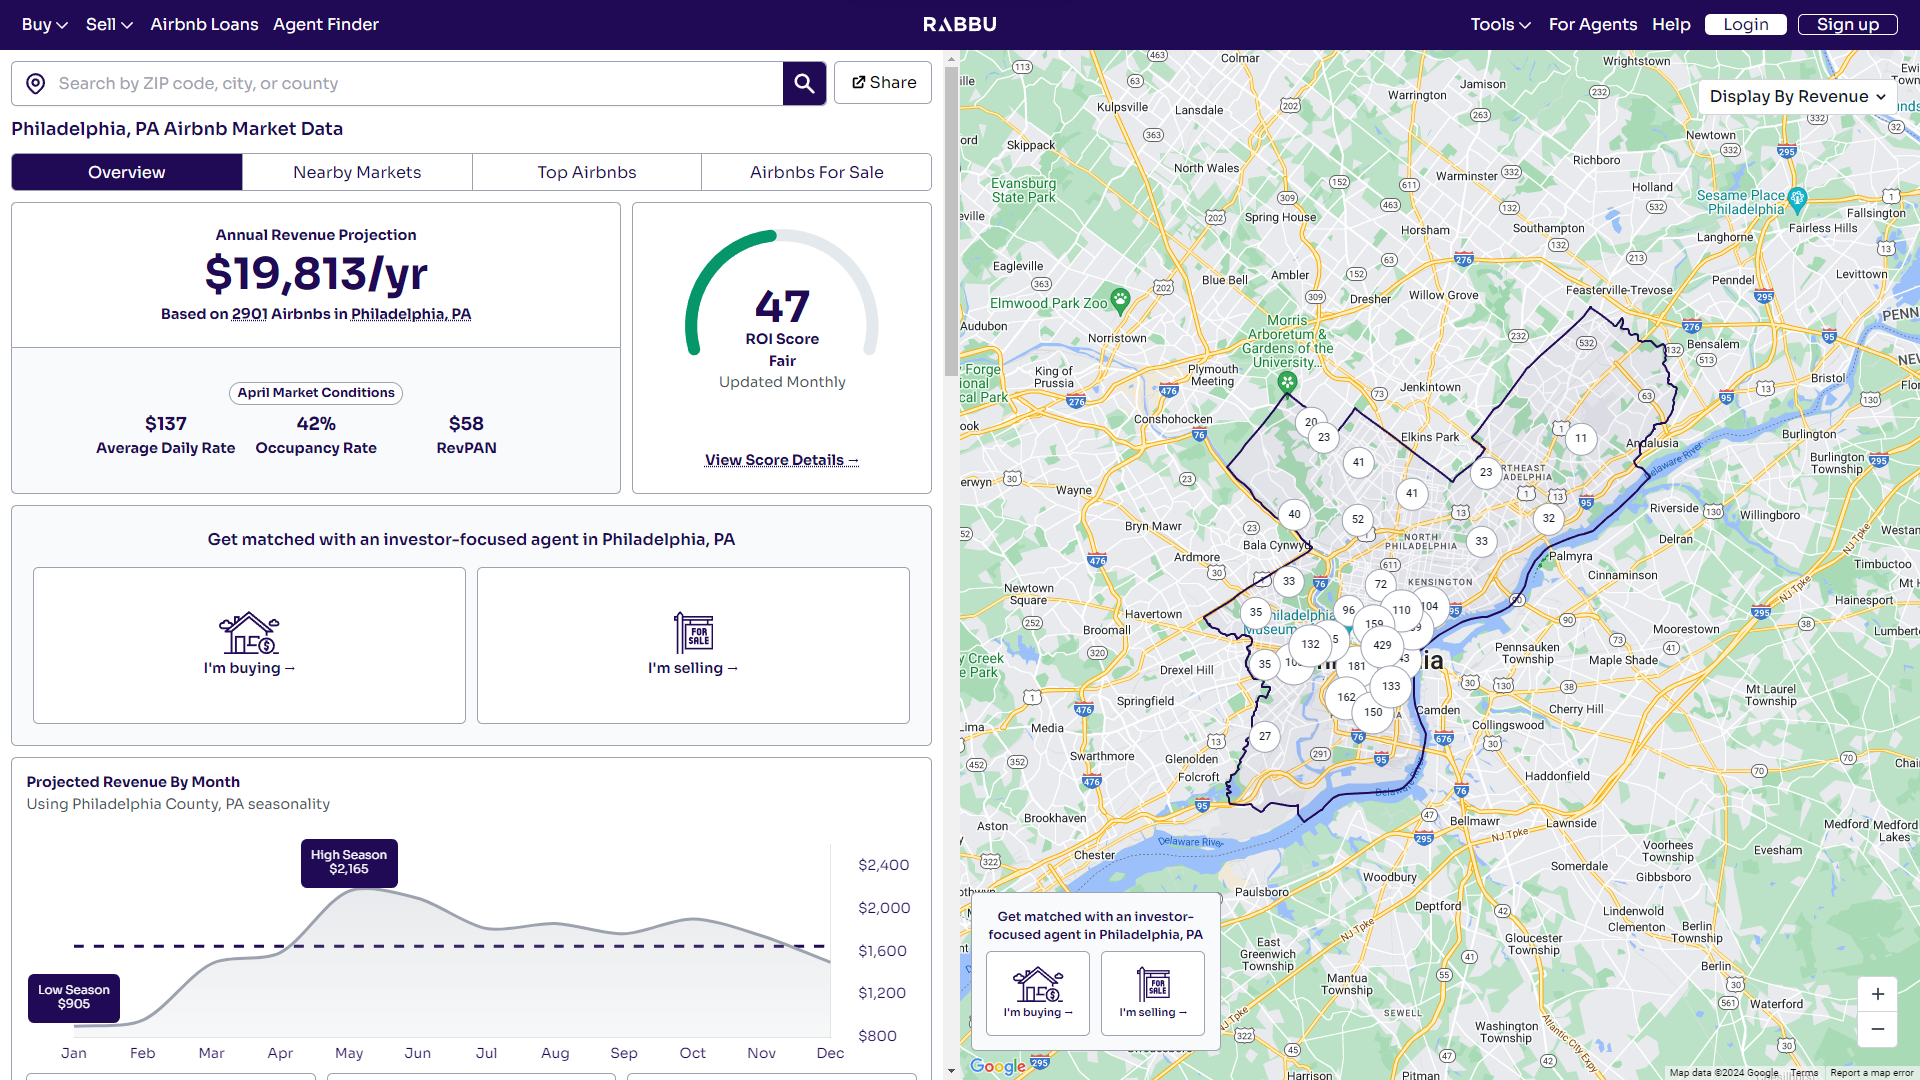
For the budget-conscious short term rental investor, the Rabbu is a fantastic choice. This provides a thorough analysis of income potential for any U.S. address, and the best part? It's entirely free.
Rabbu Data and Analytics
Rabbu offers comprehensive data, including seasonalized monthly revenue projections, annual revenue, average daily rates, occupancy rates, revenue per available night, and a list of comparable properties. You can further customize your evaluation by adding additional details like average ratings, available amenities, number of reviews, and property type.
Rabbu Cost
The Rabbu is entirely free to use, making it an attractive option for those on a tight budget.
Rabbu Pros and Cons
Pros:
- Comprehensive data analysis
- Customizable evaluation with multiple filters
- Completely free to use
Cons:
- No specific data accuracy commitment
- Limited online reviews
4. AllTheRooms: The Cap Rate Specialist
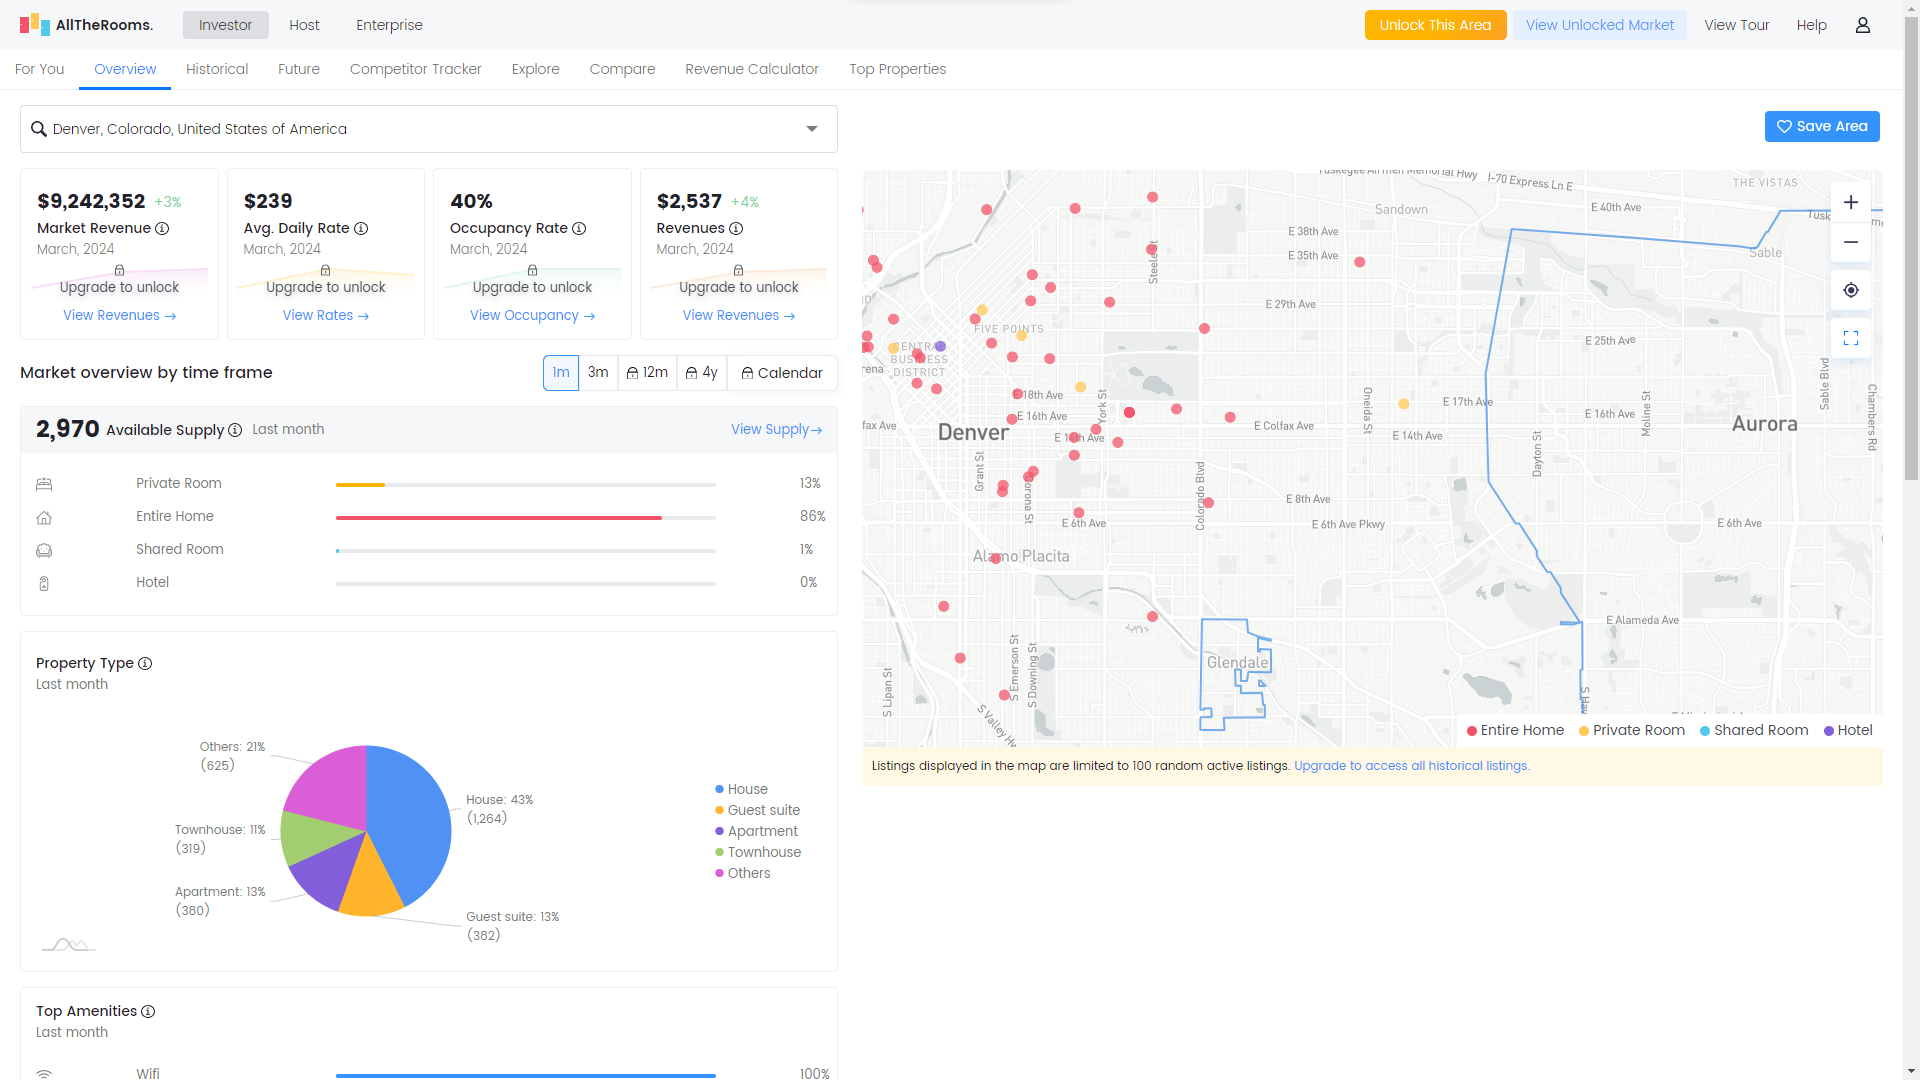
When it comes to estimating cap rates, the AllTheRooms stands out from the crowd. This tool helps short term rental investors evaluate potential rental income based on comparable properties in the same location.
AllTheRooms Data and Analytics
The AllTheRooms offers insights into average daily rates, occupancy rates, revenue, operating expenses, net operating income, and cap rates (upon entering an estimated purchase price). While it excels in cap rate estimation, it doesn't provide a list of comparable Airbnb listings.
AllTheRooms Cost
AllTheRooms offers a free plan suitable for small-scale investors. For more extensive data access, they offer paid plans starting at $19 per area per month.
AllTheRooms Pros and Cons
Pros:
- Specializes in cap rate estimation
- Analysis of major Airbnb data points
Cons:
- Limited free plan
- Lack of comparable Airbnb listings
- No explanation of data processes and accuracy
5. Mashvisor: Your ROI Metrics Expert
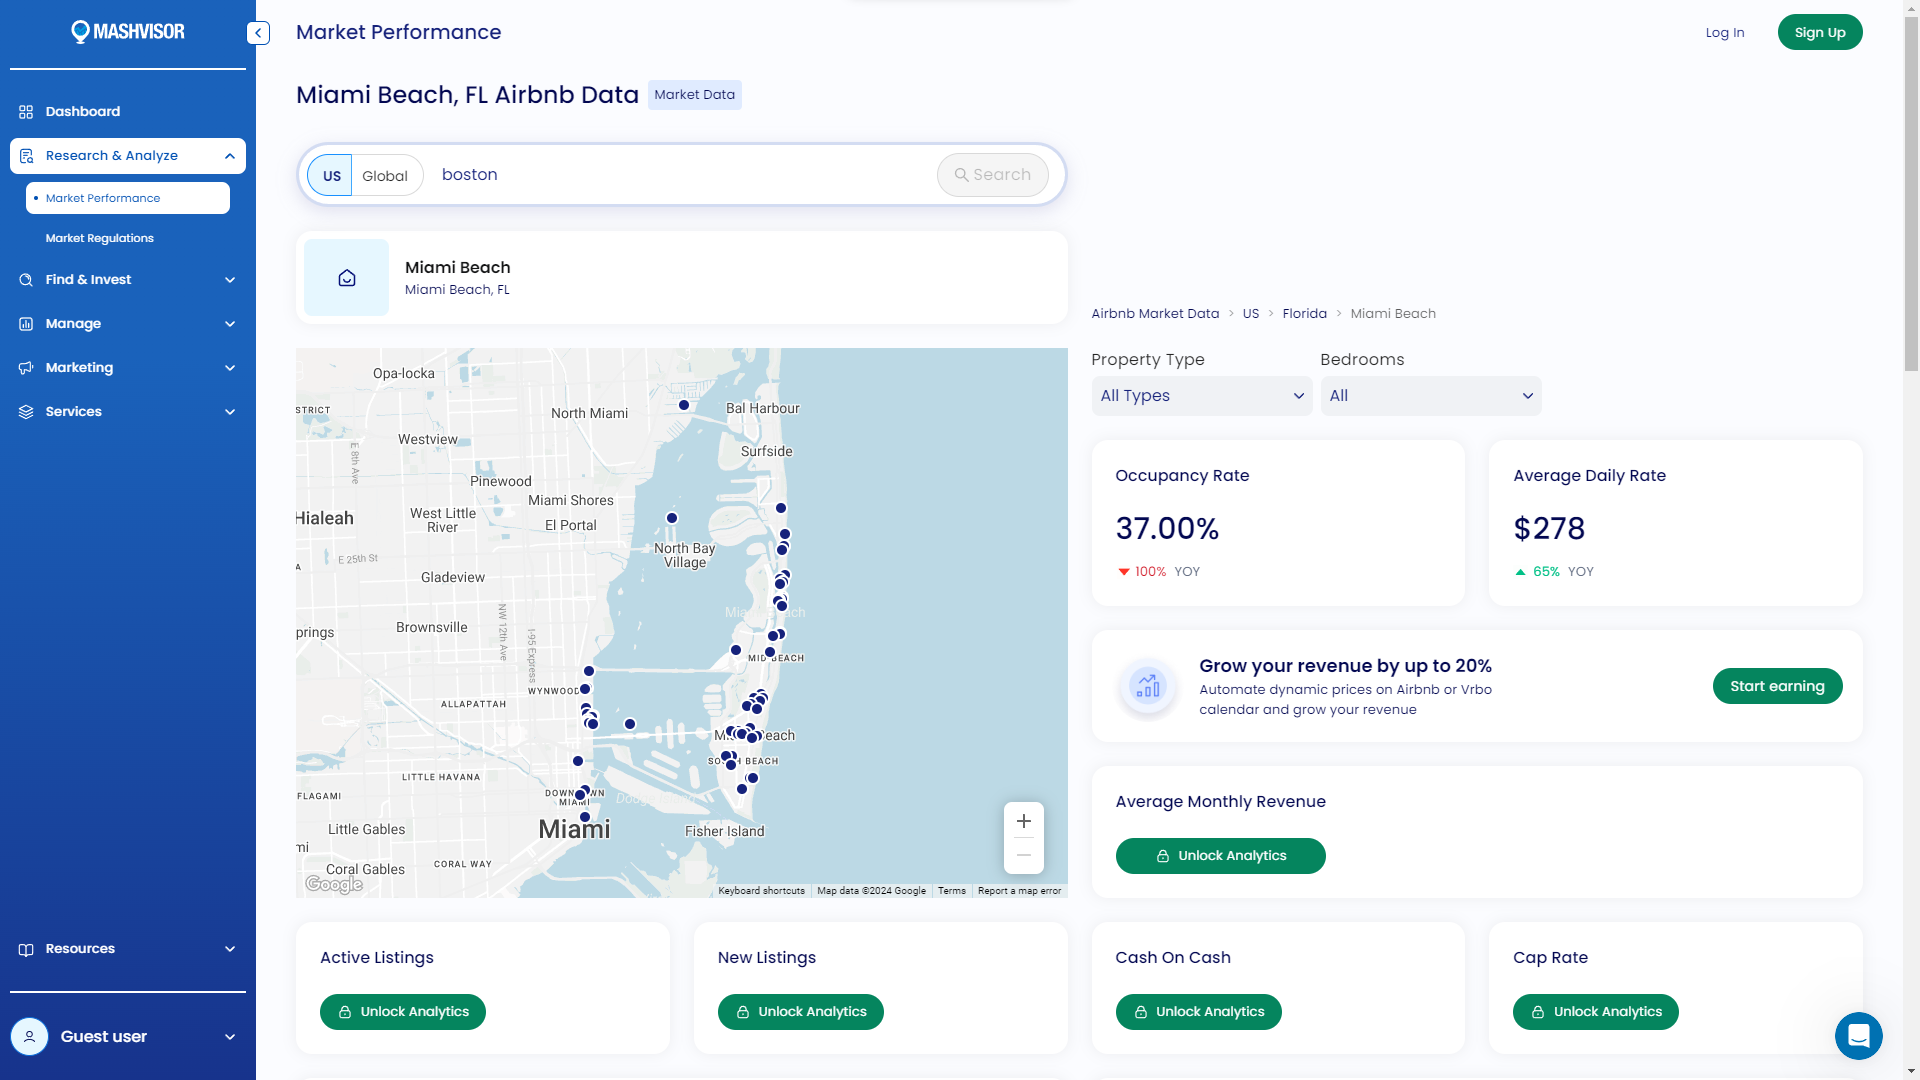
Last but not least on our list is the Mashvisor, tailored for those interested in return on investment metrics. This tool estimates more than just rental income and occupancy rates; it delves into ROI metrics. However, Mashvisor solely utilizes Airbnb data and doesn't include VRBO listings.
Mashvisor Data and Analytics
Similar to other top calculators, the Mashvisor tool asks for property details such as address and bedroom/bathroom count to start the analysis. With a free plan, you gain access to occupancy rates and average daily rates. To access additional Airbnb data metrics, a paid subscription is necessary, with quarterly plans starting at $29.99 per month.
Mashvisor Data Accuracy
Mashvisor sources data directly from the platform, focusing solely on entire property listings. Unfortunately, the company doesn't commit to a minimum level of data accuracy.
Mashvisor Cost
Mashvisor offers a free plan for the Calculator, including occupancy rates and average daily rates only. For more extensive data access, investors must opt for a paid subscription, starting at $29.99 per month for Lite.
Mashvisor Pros and Cons
Pros:
- Offers ROI analysis
- Interactive and customizable analysis
Cons:
- No data accuracy estimate
- Limited free coverage
- Costly paid subscriptions
Expert Insights:
Jeremy Werden, CEO of BNBCalc, emphasizes the importance of thorough analysis: "Don't buy a bad rental property. Run the numbers with worst case, conservative, and best case scenarios. I use BNBCalc to analyze 50 properties for every offer I make. Doing work on the front end sets you up for success on the backend."
According to GrepBeat, "The typical Airbnb host in the U.S. earned around $14K in 2022... With profitability and competition rising, potential owners need as much data as possible for a worthwhile investment. BNB Calc... helps make calculated investment decisions."
Conclusion
In today's competitive vacation rental market, the right STR calculator is more than a tool; it's a crucial partner in your investment journey. Our review reveals the strengths and unique offerings of the top 5 calculators, with BNBCalc standing out for its comprehensive access to essential Airbnb data analytics and additional services. The AirDNA Rentalizer serves as a good alternative for hosts who desire VRBO data, while calculators from AllTheRooms and Mashvisor are suitable for investors interested in ROI metrics. Each of these calculators has its own set of advantages and disadvantages, catering to a range of investor needs.
Whether you're a new investor or a seasoned professional, these calculators offer the insights and data necessary to make informed decisions. With the right tools and knowledge, you can navigate the Airbnb market confidently, making profitable and strategic investment choices.
Additional Resources for Investors
We offer comprehensive guides, tutorials, webinars, and workshops designed specifically for new investors in the Airbnb market, providing a wealth of information for those looking to deepen their understanding.
We Invite Your Feedback
What are your experiences with STR calculators? Do you have questions about starting your investment journey in the Airbnb market? Share your thoughts and questions in the comments section below.
Airbnb Tax Deduction Calculator
Paying too much in taxes? We have the perfect solution. Simulate an Airbnb home purchase below.
Purchase Price
$450K
Structure Value
70%
Apply Trump's Tax Cut (Bonus Depreciation)
Depreciation
$117,695
Interest
$21,600
Tax
$6,750
Year 1 Deduction
$146,045